Over the past two decades, many studies have analyzed whether the yield spread contains predictive contents for future real activity and inflation in many industrialized countries. The empirical evidence for the predictive power of the yield spread for real activity is relatively strong, but the predictive power for future inflation appears to have decreased significantly or disappeared over time in most countries. In this paper, we show that the adoption of inflation targeting (IT) is responsible for the time variation in the predictability of inflation using the term spread in relation to that of output growth across countries and over time.
Around the 1980s, the term structure of interest rates emerged as an active major research topic in several academic fields. The modern asset pricing literature pertaining to the factors underlying the term structure was initiated by the work of Vasicek (1977) and Cox, Ingersoll, and Ross (1985). From a theoretical point of view, the forward-looking nature is inherently an essential characteristic of the bond yields, and many empirical studies have investigated the predictive power of the term structure for the future output growth and inflation since the 1990s. Another recent body of research, the macro-finance literature that started in the 2000s, primarily focuses on the relationship among the level, slope, and curvature factors in the term structure and the macro-variables, such as inflation target of the central bank, actual inflation, and real activity. Rudebusch and Wu (2008), Hördahl , and Bekaert, Cho, and Moreno (2010) found that the level factor, which is primarily driven by the short-term interest rates, accounts for much of the inflation target or the long-run inflation rate, whereas, Tristani and Vestin (2006) the slope, which is often proxied by the term spread, has a marginal relationship with inflation or real activity.
The keys to understanding the term structure are the dynamics of the short-term nominal interest rates and the expectation formation of the market participants on future short-term interest rates, both of which are heavily influenced by monetary policy. Most industrialized countries replaced their primary monetary policy instrument, monetary aggregates, with the short-term interest rate in the 1980s. This policy change implies that the equilibrium of short-term interest rates is directly controlled by the central bank. Accordingly, the long-term bond market participants have changed the way they form expectations of future short-term interest rates. This explains that the objective, instrument, and conduct of monetary policy have been taken into account in a vast majority of research papers in the aforementioned literature.
Another important change in the history of monetary policy is that several developed countries adopted IT in the early 1990s, shifting the preference of the central bank toward stabilizing future inflation variations. Various aspects of IT framework exist, as discussed by Bernanke and Mishkin (1997), but a central implication is that a successful implementation of IT would be able to anchor the expectations of the future inflation rates of private agents to the target inflation rate. This in turn leads to changes in the information composition embedded in the longterm bond yields. However, few studies systematically investigated the effects of IT on long-term bond yields and the changes in the information structure underlying the predictable contents of the term structure for output growth and inflation.
This issue is the main topic that we want to address in this paper. Specifically, we want to identify the relative information on future inflation and output growth contained in the term spread. Our main hypothesis is that under IT, the term spread contains little information on the changes in inflation because IT anchors the future inflation to the target rate, canceling out the target rate component embedded in the long-term bond yield and the short-term interest rate. Estrella (2005) provided a model-based account for this kind of argument. Siklos (2000) found that their results were consistent with our hypothesis in the case of New Zealand.
To build up some intuition, we consider a strict form of IT in which the actual inflation is closely tied to the target inflation rate, possibly time-varying but foreseeable. If the target rate does not change, then any change in the term spread, either the expectations hypothesis component or term premium, would fully reflect the expected changes in other factors, including future real activity, because a slight deviation would exist for future inflation rates from the target.
To this end, we mainly focus on testing the relative information contents of the term spread. A perceived difficulty is that both the concept of IT and its practical implementation vary, as succinctly stated by Bernanke (2003): “
Our empirical analysis confirms the hypothesis. Within the group of IT countries, the predictive power of the yield spread for inflation is lower after the adoption of IT, whereas no systematic tendency of predictability exists for output growth before or after the adoption of IT. We also show that the change in predictability for inflation from period 1 to period 2 exhibits random variations among the countries in the Non-IT group. However, our result is weakened when the forecasting equation of the term spread includes the short-term interest rate as an independent forecasting variable. Hence, a significant amount of the information content embedded in the term spread is shared with the monetary policy instrument. This result is consistent with the finding of Kozicki (1997), who argued that short-term interest rates are better predictors of future inflation for medium and long horizons.
The remainder of this paper is organized as follows. In Section II, we summarize the related literature on the relationship between the predictive power of yield curve and the changes in the preference of monetary policy. In Section III, we select and classify the sample countries. In Section IV, we introduce the methodology, and in Section V, we present the empirical results. In Section VI, we present our conclusions.
In this Section, we briefly review the different studies pertaining to the link between the predictive power of term spread and IT. The predictive power of the yield spread for output growth is rather robust over time and across countries, particularly in earlier studies however, Dotsey (1998) and Estrella, Rodrigues, and Schich (2003 report that the marginal redictability has been less significant in the United States in recent years. In contrast, the findings for inflation are more drastic. Mishkin (1990a), Mishkin (1991), Jorion and Mishkin (1991), Estrella and Mishkin (1997), Schich (1996), and Gerlach (1997) observed the forecasting power of the term spread for inflation in the United States and some of members of the Organization for Economic Cooperation and Development (OECD), particularly for longer horizons. Many subsequent studies, as highlighted by Stock and Watson (2003), found little forecasting power for inflation in many industrialized countries when the inflation persistence is considered. However, even after controlling for inflation persistence, the predictive power of the spread for inflation still exists in some countries prior to adopting IT, most notably in New Zealand and in the United Kingdom, as shown in Section V. Hence, inflation persistence is not a sufficient explanation for diminishing predictive contents of the yield spread for inflation.
Several studies have attempted to identify the causes of time-variation of predictability and the decrease in forecasting power for inflation relative to output. Mishkin (1990a) estimated a forecasting equation for future inflation using the term spread in the United States from 1953 to 1987 and found that the coefficient of determination (R2) and the coefficient of the yield spread declined for the post-1979 period. Schich (1999) also found that the predictability has changed over time in the United States and the United Kingdom, among the G-7 countries. Using a breakpoint test, he argued that the United States monetary policy might be closer to IT in the 1980s than in the late 1970s. The United Kingdom adopted exchange rate targeting in 1987 and IT in 1992. Using a simple analytical model, Estrella (2005) demonstrated that if the monetary authority implements strict IT, then the optimal parameter values of both the current inflation gap and the current output gap in the monetary policy reaction function increase, thereby reducing the predictive power of the yield spread. He reported that the forecasting power for inflation has significantly decreased in the United States since 1987.1 For output growth, Benati and Goodhart (2008) found a significant change in the predictive power of the yield spread for several countries, but this change cannot be due to a single economic factor.
The reductions in the predictive contents of the yield spread for inflation relative to output growth are more pronounced in the United Kingdom, New Zealand, and the United States, particularly in recent years, coinciding with the IT era. Hence, it is natural question whether IT is responsible for the dissipating predictive power of the yield spread for inflation in a global context. To build up some intuition, we consider a standard Fisher equation, as follows:

where
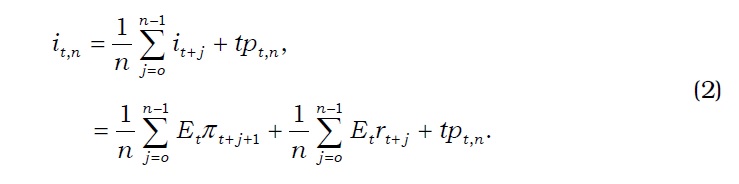
The second equality comes from the Fisher equation. If the central bank sets an inflation target that would prevail at time
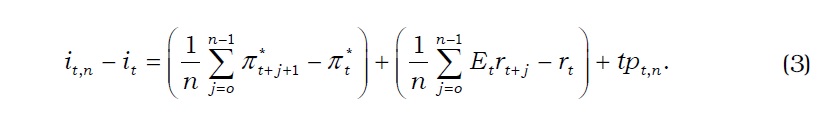
This equation implies that a change in the term spread would reflect a change in the average future real interest rates net of the current rate, term premium, or both as long as the target inflation rates are not altered for
Some additional evidence has been reported for other IT countries. Siklos (2000) found a low and insignificant forecasting power of the term spread for future inflation over most of the forecasting horizons in New Zealand, but also found a significant forecasting power in Australia and the United States He argued that a strong commitment to IT accounts for the difference between New Zealand and the other two countries.
The aforementioned studies are likely to support the hypothesis that the adoption of IT is a major cause of diminishing predictability of inflation when tested within a selected group of IT countries, but a more rigorous and systematic test would require a comparison of the predictive contents of the term spread for inflation in IT countries with those of the countries before IT adoption or with those of the countries that have not adopted IT. Additionally, we examine the predictive power of the term spread for inflation relative to that for output growth. We use this examination to determine the general relationship between the predictive power of the term spread and the IT regime.
1In contrast to these results, Gamber (1996) employed the Granger test and the vector autoregressive (VAR) analysis to show that the predictive content of the yield spread for inflation actually increased in the United States after 1979, whereas that for real activity decreased during the same period.
III. Classification of Sample Countries
We consider two groups of countries: IT countries that have adopted IT during the sample period, and Non-IT countries that have not adopted IT. Our sample countries are selected according to the following criteria. First, for the long-term bond yield to actually represent the marketdetermined prices embodying rational expectations of the market participants, the sample countries must have well-developed financial markets. The proxy for this criterion we employ in this paper is the ratio of the added value of the financial industry to that of the total industry in 2006, which is the year in which data became available for all the countries.2 We select both IT and Non-IT countries with a ratio greater than 20%. Second, for the IT countries, the sample period encompassing the times before and after the adoption of IT must be sufficiently long to enable the assessment of the predictive power of the term spread. According to Roger (2009) and Hammond (2012), close to 30 countries have officially adopted IT.3 However, most of these countries officially adopted IT after 1999, thereby indicating that the statistical test of predictability for these countries is difficult because of the lack of data for the IT period.4 The Non-IT countries must also have data series comparable with the IT countries.
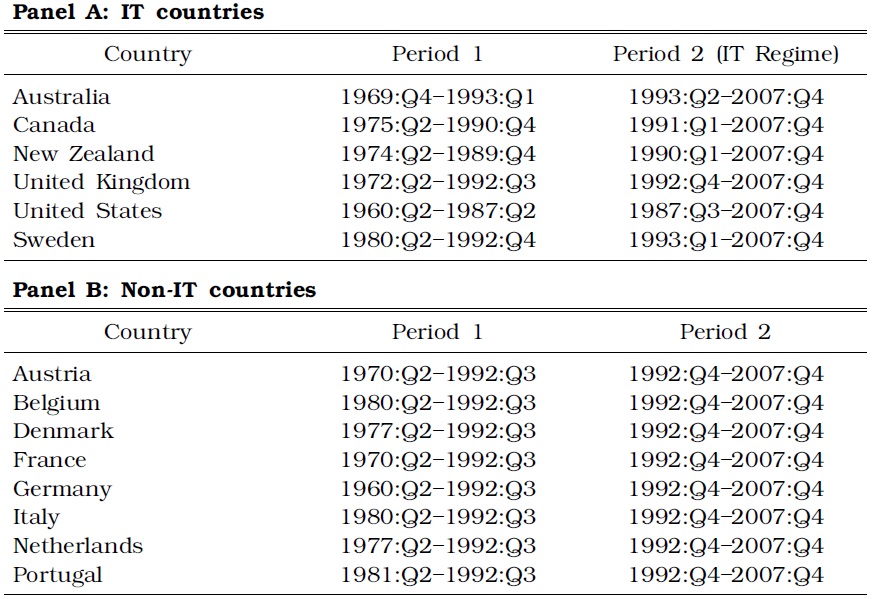
Although the United States does not announce its exact inflation target range, we follow the convention that the United States monetary authority has been implementing IT implicitly since the era of the Greenspan regime [see Goodfriend (2004) or Carare and Stone (2006), for instance]. For this reason, we include the United States as an IT country. The sample period and the adoption date of IT are reported in Panel A of Table 1.
[TABLE 1] CLASSIFICATION OF THE IT AND NON-IT COUNTRIES

CLASSIFICATION OF THE IT AND NON-IT COUNTRIES
According to our second selection criterion, the IT regime for most countries started in the early 1990s, except for the United States. To compare the forecasting power of the yield spread with the periods before and after IT across the groups, we divide the sample periods of the Non-IT countries in the fourth quarter of 1992 to make the two periods comparable to the IT countries.5 We use this date because the first sample periods are relatively short for some of the Non-IT countries, although we may also use the average of the IT adoption dates of the IT countries. The Non-IT countries and their sample periods are reported in Panel B of Table 1.
In the sample period, we truncate the most recent data points for all countries starting from 2008 to buffer our results against the global financial turmoil triggered by the United States financial crisis. Meanwhile, we omit Japan because the information contents of the term spread would be marginal,
2We obtain the data from Structural Analysis (STAN) Databases of OECD. The financial industry includes finance, insurance, real estate, and business services. 3The classification of IT countries and Non-IT countries is difficult and is incomplete. For instance, Germany and Switzerland were categorized as IT countries by Bernanke, Laubach, Mishkin, and Posen (1999), whereas they were not considered as IT countries by Ball and Sheridan (2004). 4We also exclude Finland and Spain because they adopted IT for a short period in the 1990s, but gave up the IT policy prior to the launch of the Euro. 5We also choose different starting points for the second period from the first quarter of 1991 through the second quarter of 1993, and we confirm that our results are not very different across different selection of the two periods.
Various estimation strategies have been used in previous studies to measure the predictability of output growth and inflation using the term spread. In recent years, advanced techniques, such as the time-varying parameter approach of Stock and Watson (1998), Bayesian time-varying (VAR) of Benati and Goodhart (2008), a VAR framework restricted by the affine term structure model of Ang, Piazzesi, and Wei (2006), and a nonlinear threshold model of Duarte, Venetis, and Paya (2005), have also been proposed. These methodologies are alternatives to our analysis, but the main focus of our paper is to identify the differences in the predictability between the groups of countries and over time on the same ground, rather than measuring the time-variation in the predictability for a particular country within a sample period. Thus, we use two standard metrics to gauge the forecastability of the term spread; one standard metric is based on a simple linear forecasting equation, whereas the other is based on a VAR framework.
>
A. Two measures of Forecasting Power
We consider the following baseline linear single forecasting equation:

where
The first measure of the predictive power of the term spread is the coefficient
A vast majority of papers, including recent ones by Aretz and Peel (2010), D'Agostino, Giannone and Surico (2006), Chinn and Kucko (2010), Nakaota (2005), and Poke and Wells (2009), followed a variant of this equation, although this in-sample predictability test may be misleading for out-of-sample forecasts if the estimated coefficients are statistically unstable, as pointed out by Stock and Watson (2003). While some earlier works used a form of Equation (4) without
Several studies, such as those of Kozicki (1997) and Benati and Goodhart (2008), showed that the short-term interest rate is an important control variable in the forecasting equation of the term spread. Indeed, we find that our results are weakened with the inclusion of the shortterm interest rate. Nevertheless, no consensus exists in theory about whether the short-term interest rate is a required regressor in study of the predictive power of the term spread. Moreover, the majority of empirical studies have not included the short-term interest rate as a regressor. Thus, we present the results without the short-term interest rate, but remark on the difference when the short-term interest rate is included in the prediction equation.
The second measure of the predictability that is considered in this paper is a metric based on the forecast errors in a multivariate context. We consider a VAR model of the following:
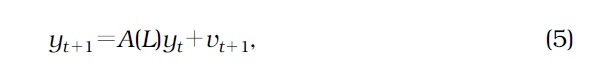
where

This statistic has an advantage over the economic significance of
Most of the quarterly data were obtained from the International Financial Statistics (IFS) database of the International Monetary Fund. Inflation,
6We also estimated the model with different numbers of lags and found that the results are similar, except for those of Australia. 7Fortunately, the results under the VAR ordering of Canova and De Nicolo (2000) are not qualitatively different from ours.
In this Section, we present the estimates of the two explained metrics in the previous Section and assess the hypothesis that the forecasting power of the term spread for inflation in the IT countries would decrease after IT adoption. For the hypothesis to become valid, the forecasting power of the term spread for future inflation, measured by the estimated metrics in the second period (IT regime), should be lower than that in the first period. Such a decrease in the forecasting power for future inflation would support the hypothesis more strongly if no significant difference exists between periods 1 and 2 in terms of the predictive contents for inflation in the Non-IT countries or the predictive contents for output growth relative to inflation in the IT countries.
>
A. Predictability Based on Single Forecasting Equation
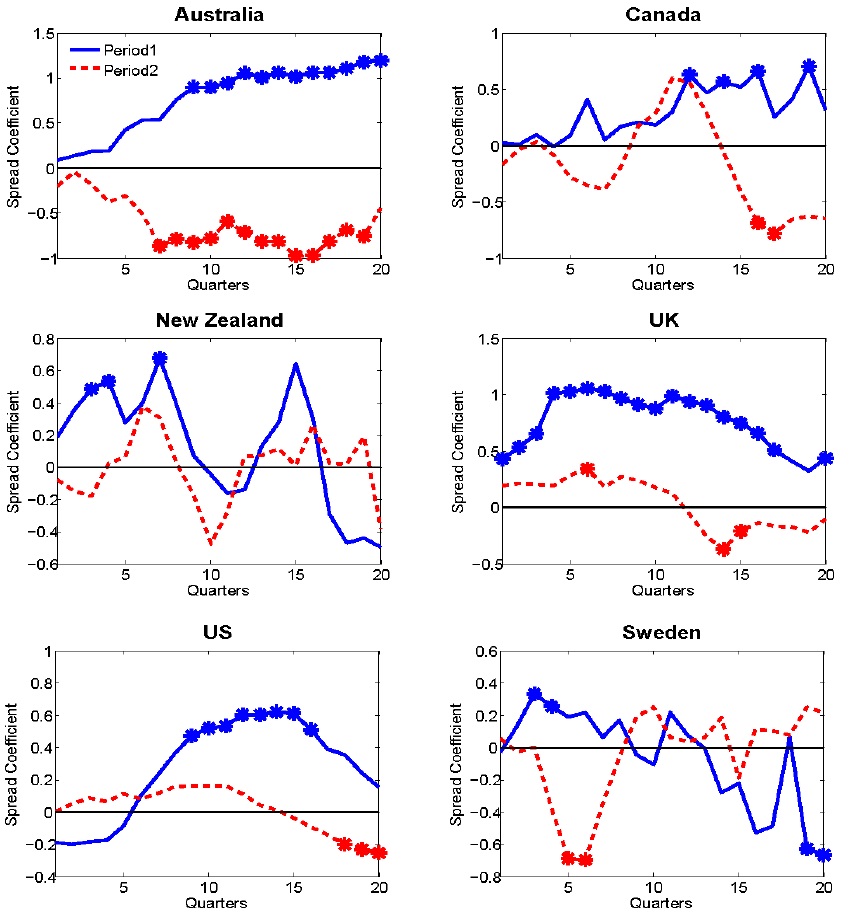
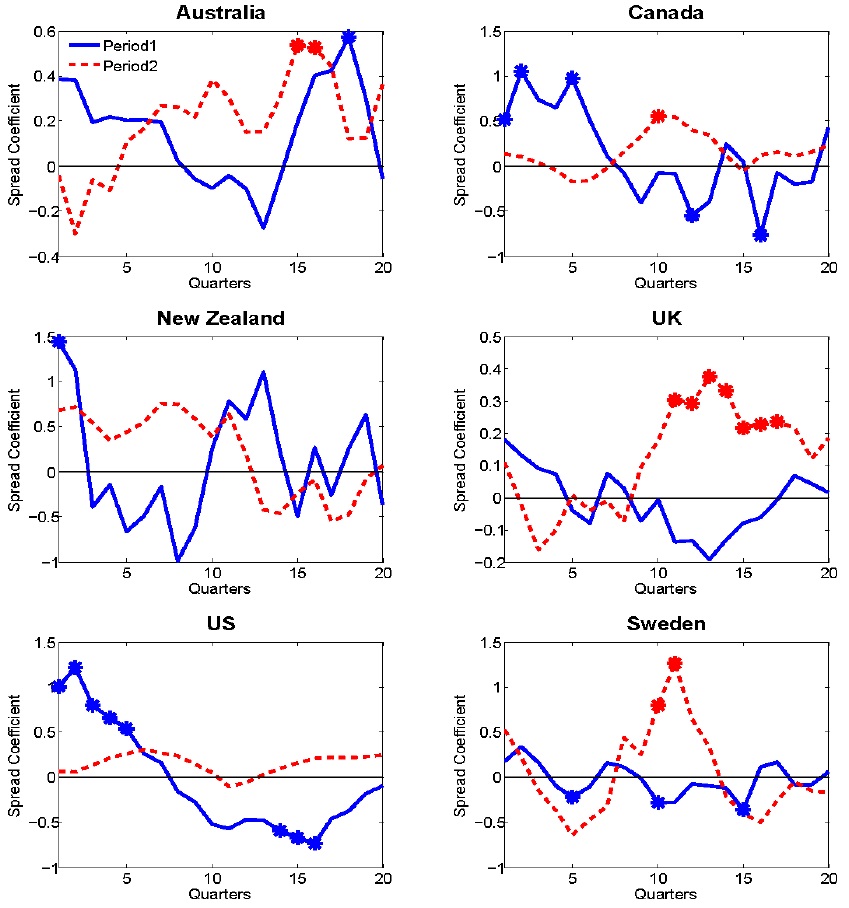
Figure 1 shows the estimates of the coefficient of yield spread in Equation (4) for inflation in the IT countries. The estimates with an asterisk indicate a significance at the 5% level, computed with Newey-est heteroskedasticity and autocorrelation consistent standard errors. Figure 1 shows that except for Sweden, the estimated
The estimated
Now, we compare the predictive power of the term spread in another dimension. Basically, the main function of IT is to anchor the level offuture inflation around the target level of the central bank, but not to (attempt to) affect future real activity, particularly in the long run. If these informational contents are fully reflected in the term structure of the interest rates, then we expect the term spreads to differentiate the informational contents for future inflation in the IT countries across the two periods, but not for other contents, such as future output growth. Thus, the forecasting power of the yield spread for output growth should be “random̶1; across the two periods in the IT countries. Figure 3 plots the estimates of the coefficient of the yield spread in the prediction equation (4) for output growth. As in Figure 2, no clear tendency of predictability exists for future output growth in the IT countries across the two periods. Whereas the United Kingdom shows the most drastic change in forecasting power for inflation, the term spread has no predictive power for output growth before adopting IT, but it does have some predictive power starting from the 11th quarter in the IT period. The predictive power for future output growth in the United States disappears in the IT regime. Before adopting IT, the yield spread in the United States positively predicted future output growth at short forecasting horizons, but it negatively predicted future output growth at long horizons. The estimated
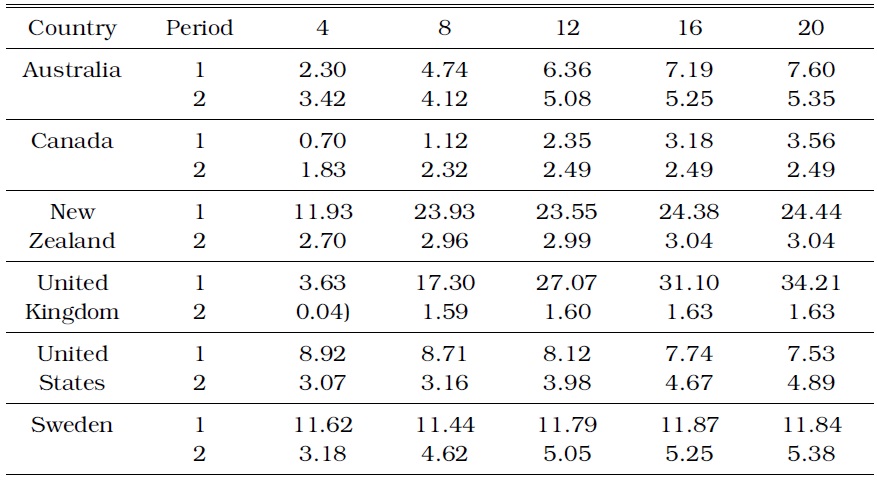
As a second metric for measuring the predictive power of the term spread, we compute the h-step error variance of inflation accounted for by the term spread shock relative to the total variance. Table 2 shows this variance ratio for the IT countries for up to 20 quarters before and after adopting IT. In the IT countries, the forecast variances of inflation accounted for by innovations to the term spread are lower in the IT regime than those in period 1, except for the first year in Australia and the first three years in Canada. Such decrease in term structure forecastability is drastic in the United Kingdom and New Zealand, which are arguably the most aggressive IT countries in the world. As shown by Stock and Watson (2003) and by many other researchers, inflation persistence should be considered when testing the forecastability of the term spread for future inflation. Indeed, inflation has been very persistent in all the countries, and it is not surprising that much of the forecast variances of inflation in our VAR analysis are explained by the shocks to inflation. However, after controlling for inflation persistence, our vari-ance decomposition analysis clearly shows that IT is likely to be responsible for the reduction of the predictive content of the term spread for inflation.
[TABLE 2] INFLATION VARIANCE (%) ACCOUNTED FOR BY TERM SPREAD IN THE IT COUNTRIES

INFLATION VARIANCE (%) ACCOUNTED FOR BY TERM SPREAD IN THE IT COUNTRIES
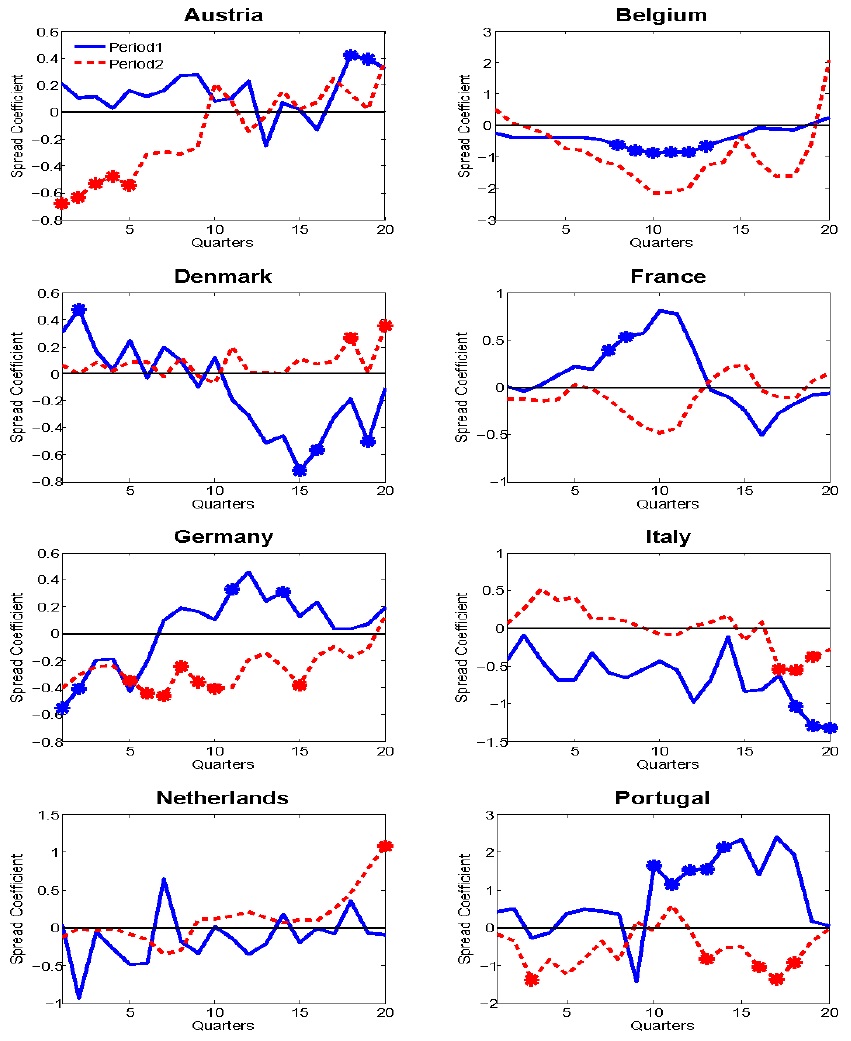
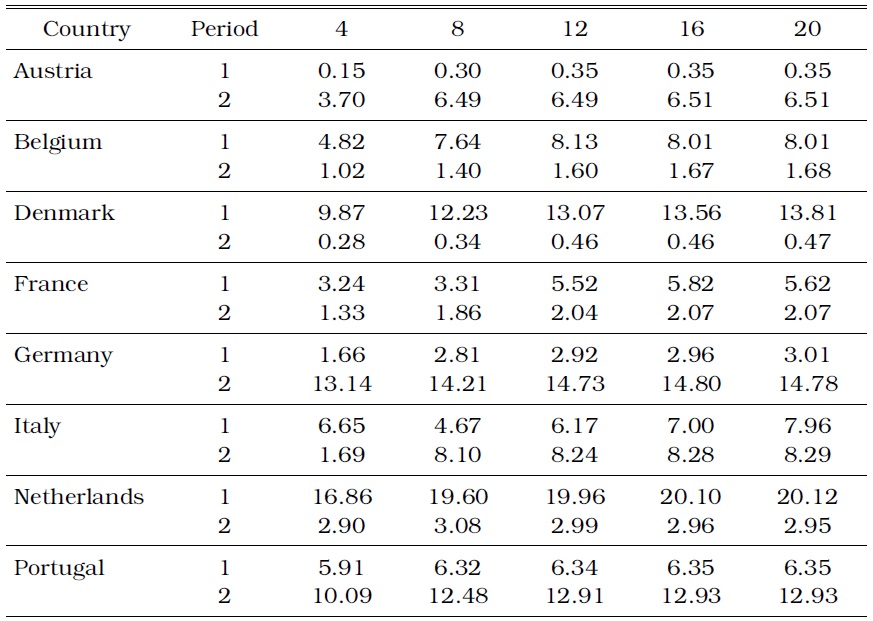
We compare the results of the IT countries with those of the Non-IT countries as we did in the previous Subsection. Table 3 shows the variance ratio for the Non-IT countries. We expect the changes in the predictability for inflation to be random in the Non-IT countries across the two periods. The error variance of inflation accounted for by the term spread shock actually increases in four (Austria, Italy, Germany, and Portugal) of the eight countries during period 2.
[TABLE 3] INFLATION VARIANCE (%) ACCOUNTED FOR BY TERM SPREAD IN THE NON-IT COUNTRIES

INFLATION VARIANCE (%) ACCOUNTED FOR BY TERM SPREAD IN THE NON-IT COUNTRIES
This observation is in contrast with the variance ratio for inflation in the IT countries, even if the statistical determination of whether or not this result exhibits the randomness of the changes in the predictability is not possible because of the small sample size.
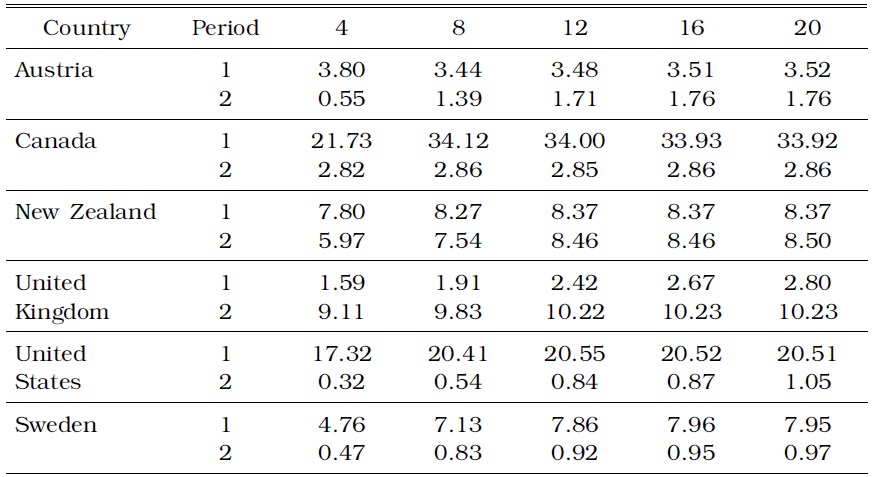
Lastly, we show the predictive contents of the term spread for inflation relative to those for output growth in the IT countries. Table 4 shows the h-step error variance of output growth accounted for by the term spread shock in comparison with the total variance. The variance ratio for output growth decreases in 4 out of 6 IT countries over the entire forecasting horizon, thereby indicating that the overall result does not strongly support the hypothesis. However, a comparison of Tables 2 and 4 shows that the variance ratio in the United Kingdom actually increases from approximately 2% prior to the IT regime to 10% during the IT regime, whereas variance ratio is similar across the two sample periods in New Zealand. This observation implies that the variance ratio for inflation relative to that for output growth decreases drastically in the United Kingdom and in New Zealand. The predictive contents of the spread for inflation drop significantly compared with those for output growth in the two countries with the strictest IT.
[TABLE 4] OUTPUT GROWTH VARIANCE (%) ACCOUNTED FOR BY TERM SPREAD IN THE IT COUNTRIES

OUTPUT GROWTH VARIANCE (%) ACCOUNTED FOR BY TERM SPREAD IN THE IT COUNTRIES
Overall, the empirical results based on the two measures of predictability are consistent with each other, and they support the hypothesis that the adoption of IT is responsible for reducing the predictive contents of the term spread for future inflation, even if the empirical evidence for the hypothesis is weak in some IT countries, such as Australia and Canada. Our results indicate that the credibility in the actual implementation of IT matters for a reduction of the forecasting contents of the term spread for inflation. Based on papers by Bernanke and Mishkin(1997) and Svensson (1999), the characteristics and implementation of IT are not homogeneous among the IT countries. Assessing the consequences of the different forms of IT in theory and practice is beyond the scope of this paper, but a reduction in the forecasting power of the term spread for inflation is clearly pronounced in the two strictest IT countries, namely, the United Kingdom and New Zealand.
We follow the majority of the literature in testing the forecasting power of the term spread by excluding the short-term interest rate in the forecasting equation. For instance, the short-term interest rate is not included in the forecasting equations in the work of Mishkin (1990b), who used the Fisher equation to deduce a forecasting equation, and Estrella (2005), who combined the Expectations hypothesis with a set of simple New Keynesian models to derive a forecasting equation. These studies are theoretically sound, but some challenges against the omission of the short-term interest rate have been made on various grounds. Kozicki (1997), for example, argued that the short-term interest rate is better measure of monetary policy than the term spread, which is subject to the fluctuation of a time-varying term premium, and shows that the marginal predictive contents of the term spread dissipate after controlling the short-term interest rate. The results for output growth are mixed. Estrella and Mishkin (1997) found that the predictability is still significant when the interest rate is included, whereas Ang
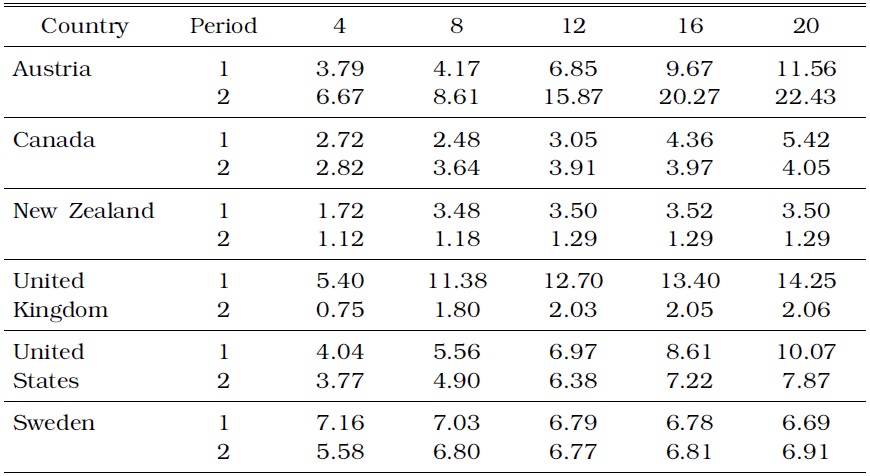
Both approaches are appealing, but we provided our results based on the forecasting equation in the absence of the short-term interest rate. When the short-term interest rate is included in our forecasting equations, the results are weaker with regard to supporting the hypothesis. Instead of replicating all the results with the interest rate, we present the variance ratio statistics for the IT countries based on VAR analysis with inflation, output growth, short-term interest rate, and term spread.9 Table 5 shows the h-step error variance of inflation accounted for by the term spread shock relative to the total variance for the IT countries over 5 years before and after adopting IT.

INFLATION VARIANCE (%) ACCOUNTED FOR BY TERM SPREAD IN THE IT COUNTRIES WHEN INCLUDING THE SHORT TERM INTEREST RATE IN PREDICTION EQUATIONS
Reduction in forecasting power of the term spread for inflation is weaker when the short-term interest rate is included in the prediction equations, but comparing Tables 5 and 2 reveals conclusions that are qualitatively similar for most of the IT countries. Canada shows no difference in the predictive power of the term spread for inflation before and after IT, whereas New Zealand, the United Kingdom, and the United States show reduction in predictive power. One exception is Sweden; when the short-term interest rate is included, the difference between the predictive powers before and after IT disappears. This observation might imply that the dynamics of the short-term rate in Sweden is much larger than in other country. Our results indicate that some of the predictive contents of the term spread are also embodied in the short-term interest rate, particularly in the first period.10 We also find that the predictive contents of the term spread for inflation for the Non-IT countries and those for output growth in the IT countries, corresponding to Tables 3 and 4, respectively, are still random.
Including the short-term interest rate in the forecasting equations weakens the support of the hypothesis that IT is responsible for the reduction in forecasting power of the term spread for inflation, but the dissipating predictive power in the IT period is still observed in the strictest IT countries, namely, the United Kingdom and New Zealand.
8We also note that no clear difference should exist in the forecasting power of the term spread for future output growth across the two periods in the Non-IT countries. We find that this observation is indeed true, but we do not show this figure corresponding to Figure 3 to save space. 9All results that consider the interest rate are available from the authors upon request. 10In finance, it is standard to extract the slope factor from the term structure as a second principal component orthogonal to the level and curvature factors [see Dai and Singleton (2000) for instance], and our results show that the term spread is closely related but not equal to the slope factor.
Numerous empirical studies investigating the forecasting power of the term spread for inflation exist in the literature. Overall, our results for individual countries agree with these studies. Nevertheless, no study systematically analyzes the relationship between IT and the predictive power of the term spread. Our main contribution is to bridge this gap in the literature and to provide empirical evidence in favor of the hypothesis that IT is responsible for a reduction of the predictive contents of the term spread for inflation. Specifically, we carefully select a group of IT countries, and a comparison was made between this IT group and a group of Non-IT countries. Moreover, we divide the sample period into the pre-IT regime and the IT regime in the IT countries, and we partition the sample period in the Non-IT countries into the two periods comparable to those in the IT countries. Subsequently, we directly test the predictability across the two periods in the IT countries, followed by a comparison of this predictability with that of the Non-IT countries. We also assess the predictive contents for inflation relative to those for output growth.
The main empirical findings of this paper can be summarized as follows. First, in the group of IT countries, we find that the predictive power of the yield spread for inflation is generally low after the adoption of IT. Second, little or no systematic tendency of predictability for output growth is found before or after the adoption of IT. Third, we also find that the predictability of the term spread for inflation from period 1 to period 2 exhibits no systematic changes in the Non-IT countries. We are unable to conduct a robust statistical test on the differences in the predictive power over the two periods and across countries due to the small sample problem, but all of the abovementioned findings weakly support our hypothesis.
A number of avenues for future research may be motivated by our study, which also reveals some caveats of this paper. First, our paper does not directly test the causality of the hypothesis. For such a test, a sound theoretical background for the hypothesis should be developed. Second, we do not make a distinction between the expectations hypothesis component and the term premium embedded in the term spread. Decoupling these components of the term spread would have different implications in its relationship with IT. Third, our results appear to indicate that the form of IT does matter for the predictive contents of the term spread. Disentangling the degree of IT is by itself difficult, and it would be even more difficult to test a general relationship between the form of IT and the predictability for inflation and output. However, this difficulty is a worthy challenge for future research.