This paper examines whether firm size determines the economies of scale and scope in the brokerage sector and, if so, how substantial they are. Quantile regression is used to perform more specific analysis. The findings of this work are expected to contribute to predicting sectoral changes and to guiding financial policies about Systemically Important Financial Institutions. This research can also serve as a useful reference for future research on competitiveness in other industries or countries.
Certain prior studies are remotely related to the concern of the present research and have estimated the cost functions of Korean securities firms (
Nevertheless, previous studies are characterized by several limitations. First, these works did not estimate the cost functions for all brokerage firms. Translog cost function can account for a U-shaped cost function and generalizes the Cobb-Douglas function. This kind of cost function, however, is inapplicable to small-sized brokerage houses with limited brokerage operations. By comparison, Cobb-Douglas specification can be used to estimate the cost functions of all securities firms based on total assets and total costs. Therefore, previous studies generalized the Cobb-Douglas function, while sacrificing the scope of analysis.1 Meanwhile, the quadratic cost function used in the current study is sufficiently general, which allowed small securities firms to be analyzed.
Second, the estimate cost functions of previous studies assumes that securities firms charge the same commission fee for the same service. In fact, brokerage firms in Korea charge considerably different commission fees even for similar services. Thus, estimating the cost functions based on the profits of brokerage services is more reasonable compared with basing it on the amount of brokerage transactions because cost function is based on cost and profit, not on cost and transaction alone.
1Kook et al. (2007) applied the spline function in the analysis. Spline function overcomes the limitations of the translog function, as specified in this paper.
II. Previous Research and Model
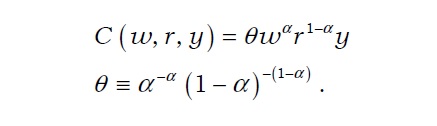
The extent of economies of scale and scope can be measured via different means. The most widely used specifications are the Cobb-Douglas, translog, and quadratic cost functions. The Cobb-Douglas function has been extensively used to estimate cost functions and to examine the economies of scale and scope (Benston 1965; Bell and Murphy 1968). Cobb-Douglas production is derived as the solution for the following minimization problem:
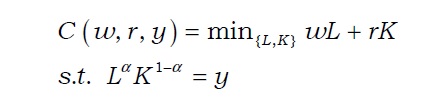
Cost function then becomes
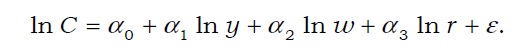
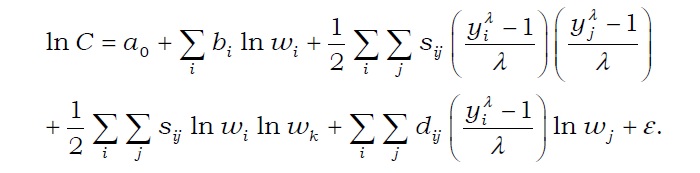
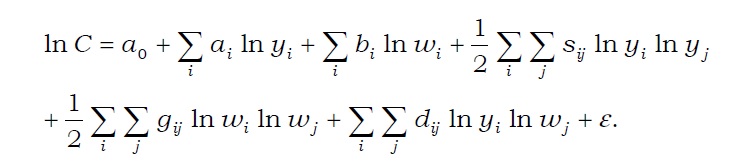
By taking log, an empirical specification can be acquired as follows:

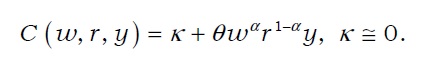
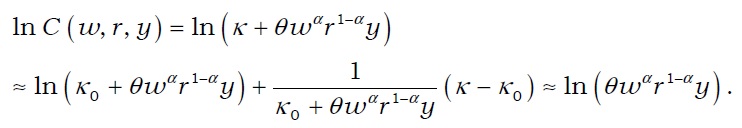
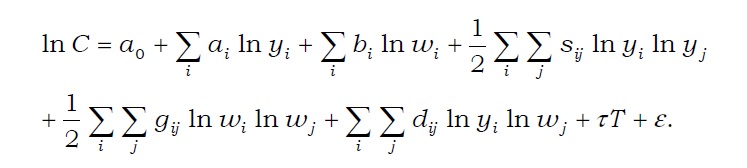
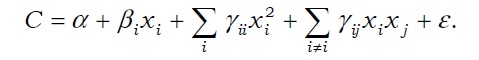
By taking log and conducting Taylor series expansion around

Subsequently, the same empirical specification is maintained with
When
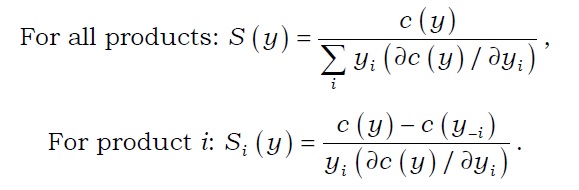
The economy of scale occurs when both S(
Meanwhile, Goldberg
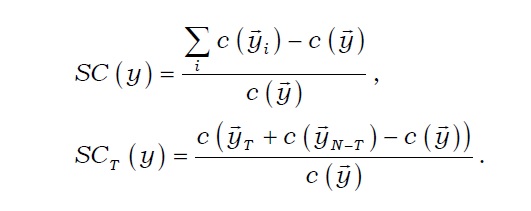
The economy of scope (
Schmiedel
Toivanen (1997) underlined that the translog cost function of Christensen
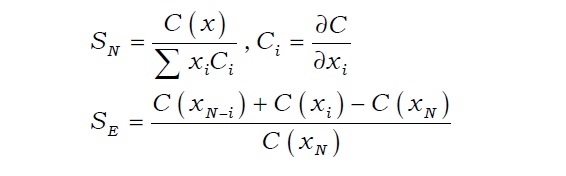
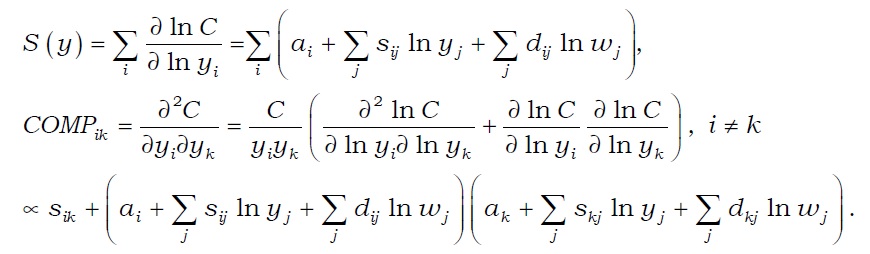
Here, the economies of scale and scope can be identified with the below equations.

In the above formula,
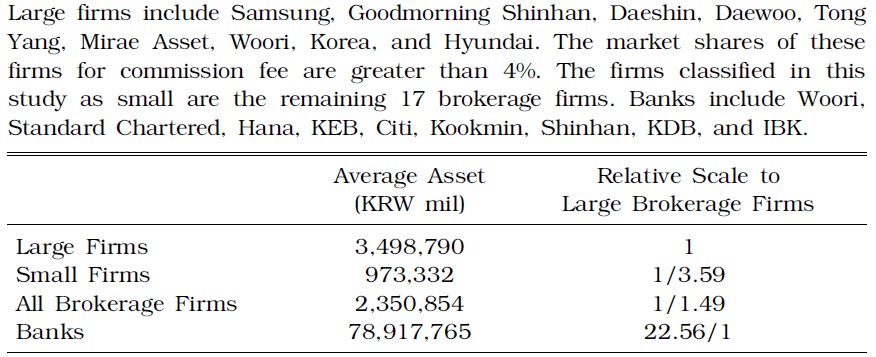
All securities firms in Korea were analyzed in this study. In particular, large firms were construed as those whose market share of commission fee is 4.0% or greater. These firms included Samsung, Goodmorning Shinhan, Daeshin, Daewoo, Tong Yang, Mirae Asset, Woori, Korea, and Hyundai. The remaining companies (17) were categorized as small firms. The analysis period of this study spanned from Q2 2000 to Q1 2007 to examine the dramatic changes that occurred in the financial market after the Asian financial crisis.
Commission revenue (
Table 1 compares the asset magnitude of large- and small-sized Korean brokerage firms. The result of the investigation specified that the average volume of the assets of large firms is about four times greater than that of small firms; the former has assets worth KRW 3.5 trillion, which is approximately 3.6 times greater than that of small firms (asset amount of KRW 0.97 trillion). Meanwhile, the average assets of domestic banks amounting to KRW 80 trillion is 34 times higher than that of all brokerage firms at KRW 2.4 trillion. This discrepancy in asset volume should be considered in analyzing the economies of scale of brokerage firms.
[TABLE 1] AVERAGE ASSET OF BROKERAGE FIRMS AND BANKS

AVERAGE ASSET OF BROKERAGE FIRMS AND BANKS
The estimates drawn from Cobb-Douglas based on cost function demonstrate that both large and small brokerage firms attain the economies of scale. See Table 2 for the results.
[TABLE 2] ESTIMATE RESULTS OF COBB-DOUGLAS FUNCTION
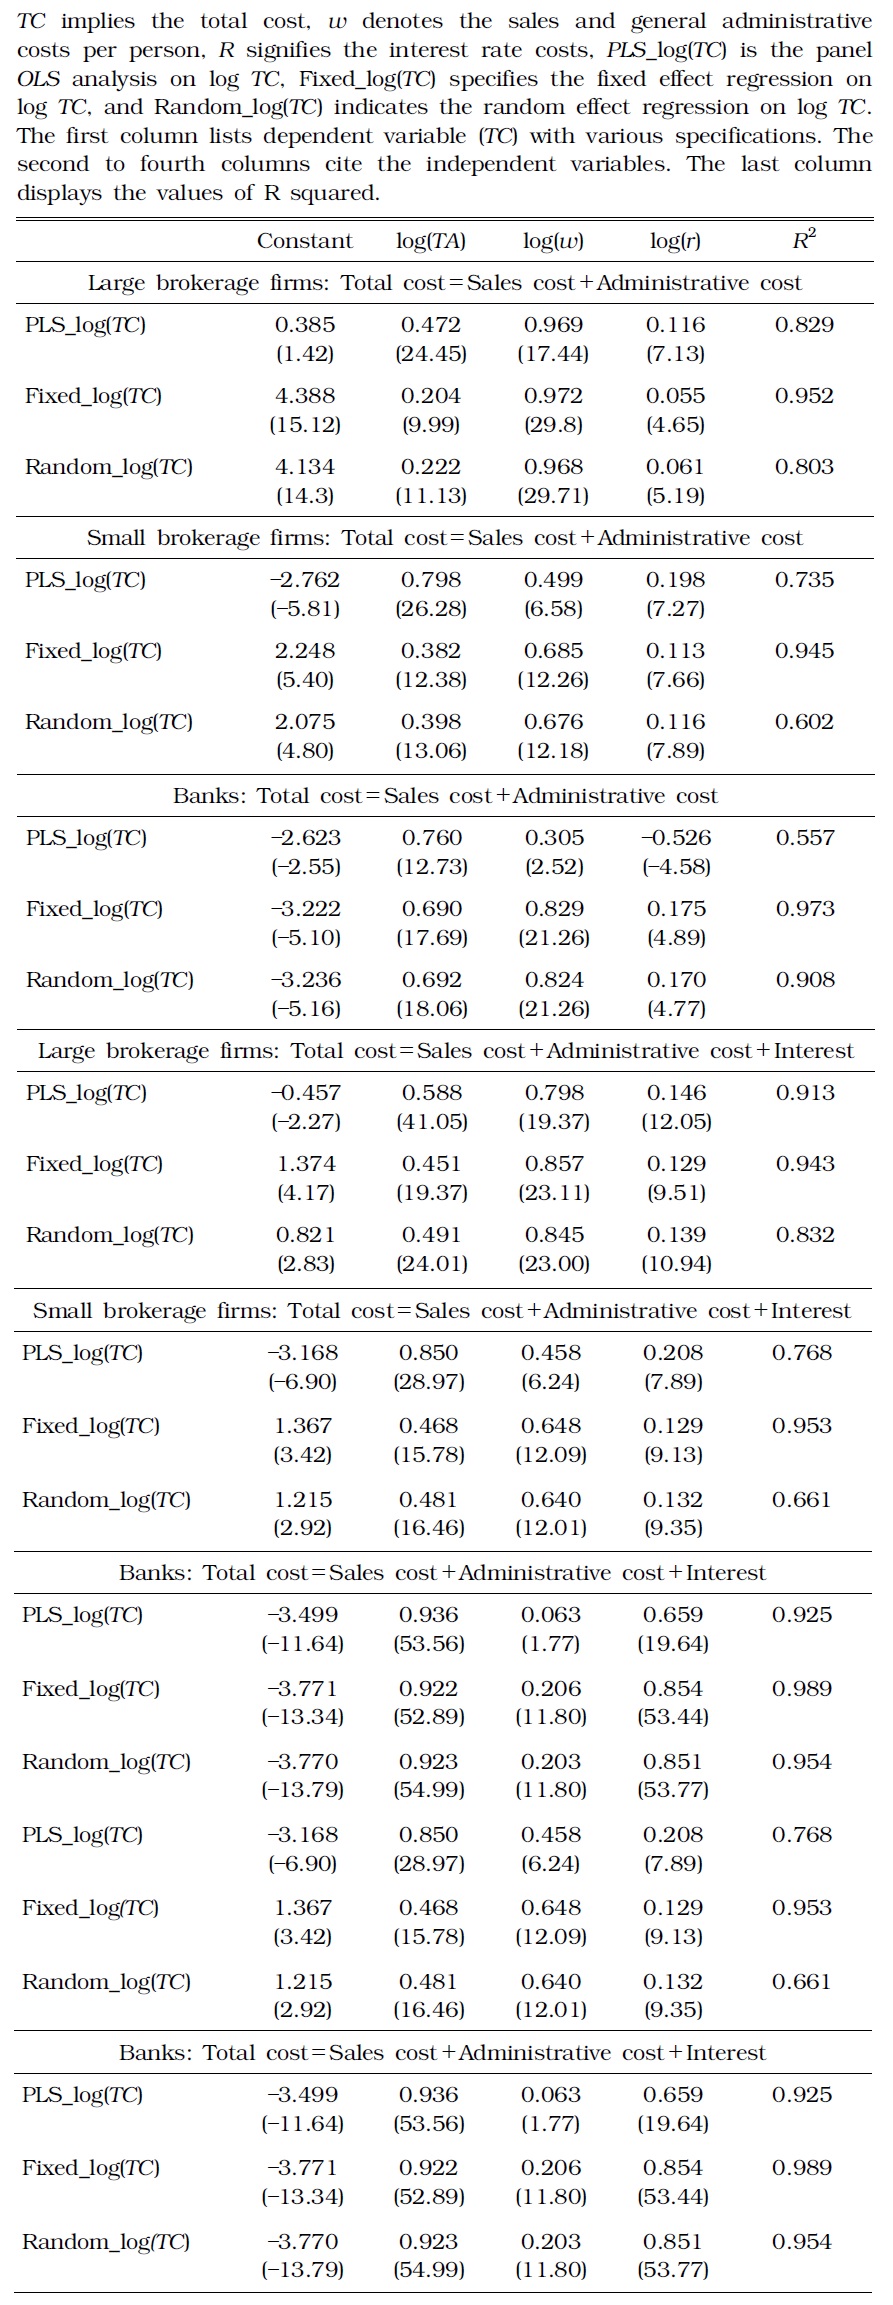
ESTIMATE RESULTS OF COBB-DOUGLAS FUNCTION
If only the operating cost was included in the cost, large-sized securities firms realized greater economies of scale. However, when interest payments were also considered, small-sized firms showed greater economies of scale. When only the operating cost was included in the total cost, the estimates of total cost elasticity to total asset was 0.222 and 0.398 for large- and small-sized firms, respectively, based on the random effect model. Here, elasticity was computed as
Thus, among large brokerage firms, the marginal cost was merely 22% of the average cost (
The asset volume of large brokerage firms, small firms, and banks significantly vary. Hence, their estimated parameters should be interpreted accordingly. In particular, the volume of average assets of large securities firms was 3.6 times larger than that of small firms, whereas banks averagely owned 23 and 81 times more assets than large and small brokerage firms, respectively. Assuming cost included only the operating cost, and the asset volume of small securities firms increased to the level equivalent to that of large firms. In this case, the diseconomies of scale were observed as
The results obtained from quantile estimate were similar, such that greater cost incurred lower ratio of marginal cost to average cost, that is, the economies of scale were achieved. See the results in Table 3.
[TABLE 3] QUANTILE ESTIMATE RESULTS OF COBB-DOUGLAS FUNCTION
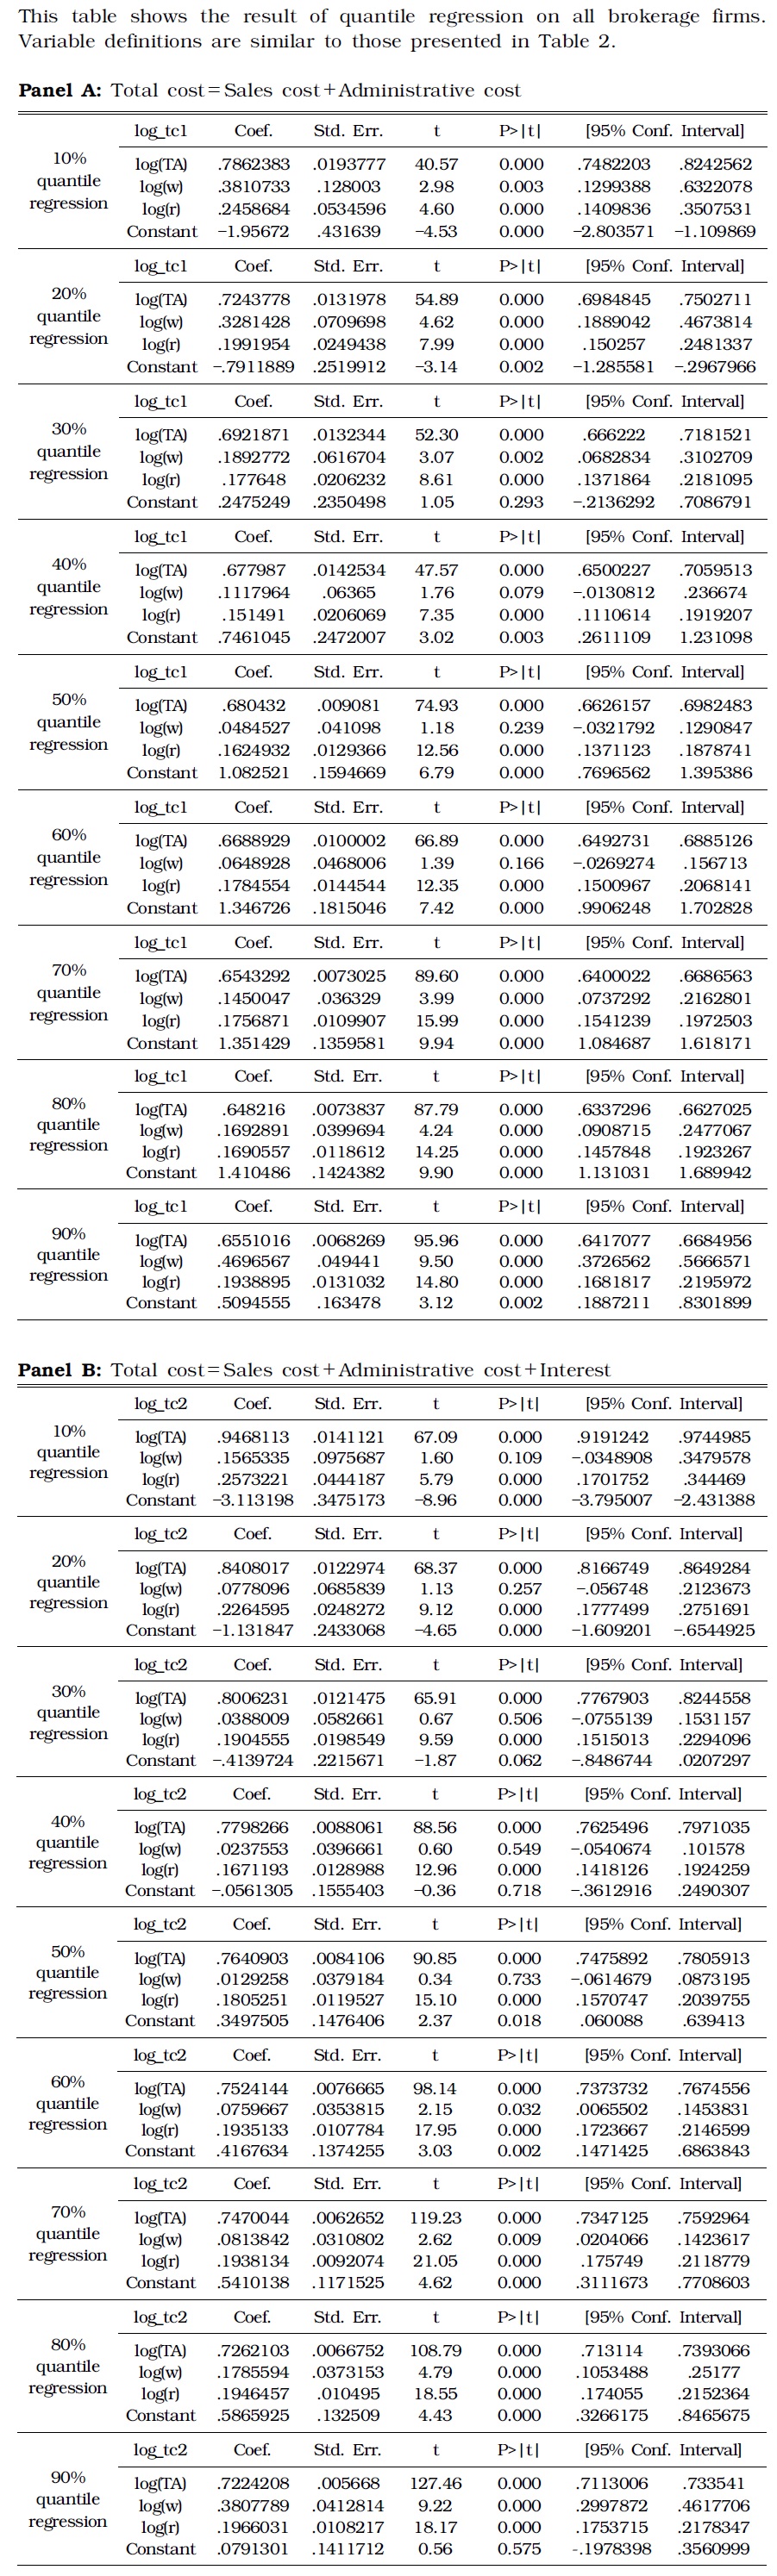
QUANTILE ESTIMATE RESULTS OF COBB-DOUGLAS FUNCTION
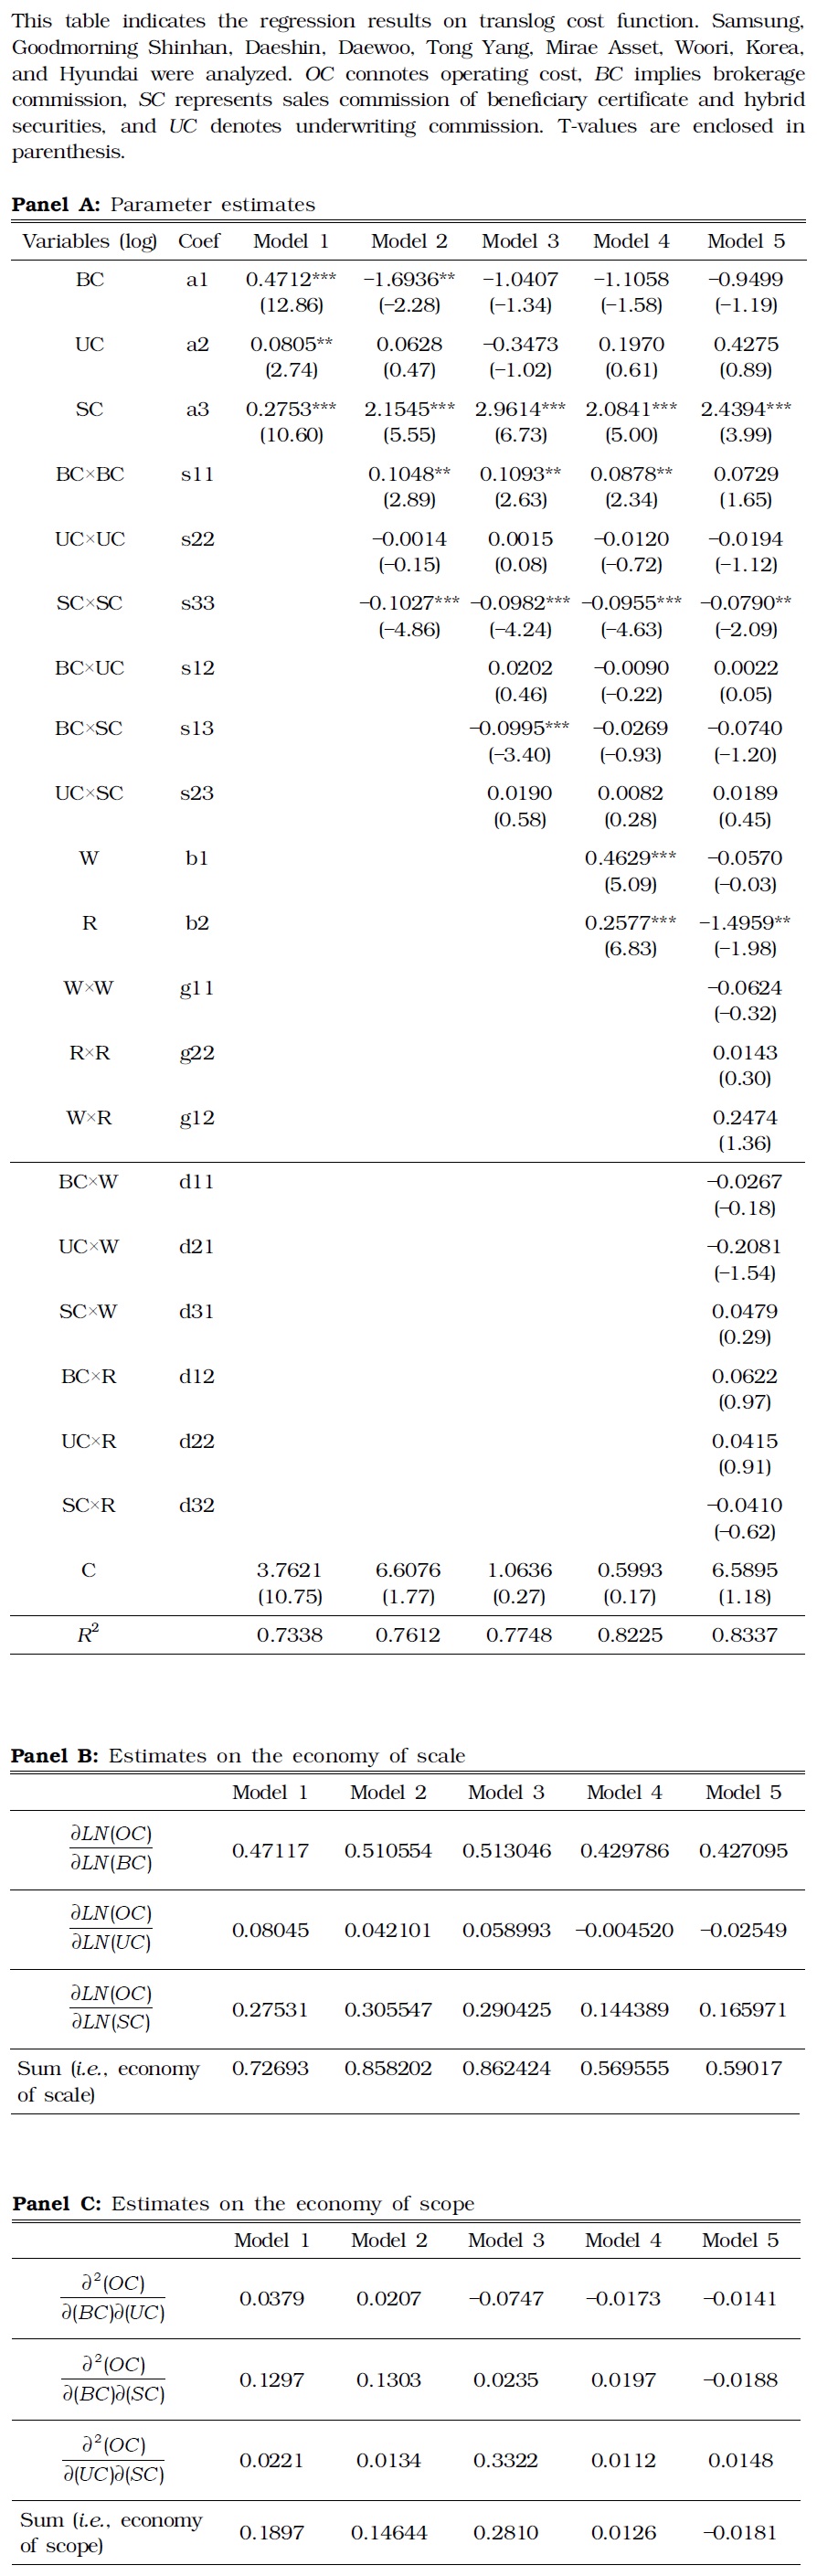
Table 4 describes the estimation results with the translog cost function. In particular, these findings signify the economy of scale. Nine large brokerage firms were analyzed in this study, in which methodological issues were observed. First, this log specification allowed this study to analyze only the firms with full suite of services. Only a few large brokerage firms offer all services without a blank in any service. Second, the fee for wealth management service is zero in many cases (
[TABLE 4] ESTIMATE RESULTS OF TRANSLOG FUNCTION
ESTIMATE RESULTS OF TRANSLOG FUNCTION
Panel B in Table 4 demonstrates the existence of the economy of scale in all specifications, and Panel C suggests that the economy of scope was observed only in some models contrary to the economy of scale. In Models 3 to 5, the economy of scale existed between underwriting and brokerage commission. In Model 5, such scale particularly existed between underwriting and sales commission for beneficiary certificates and hybrid securities. In other models and service combinations, the opposite occurred; diversification engendered the diseconomy of scope.
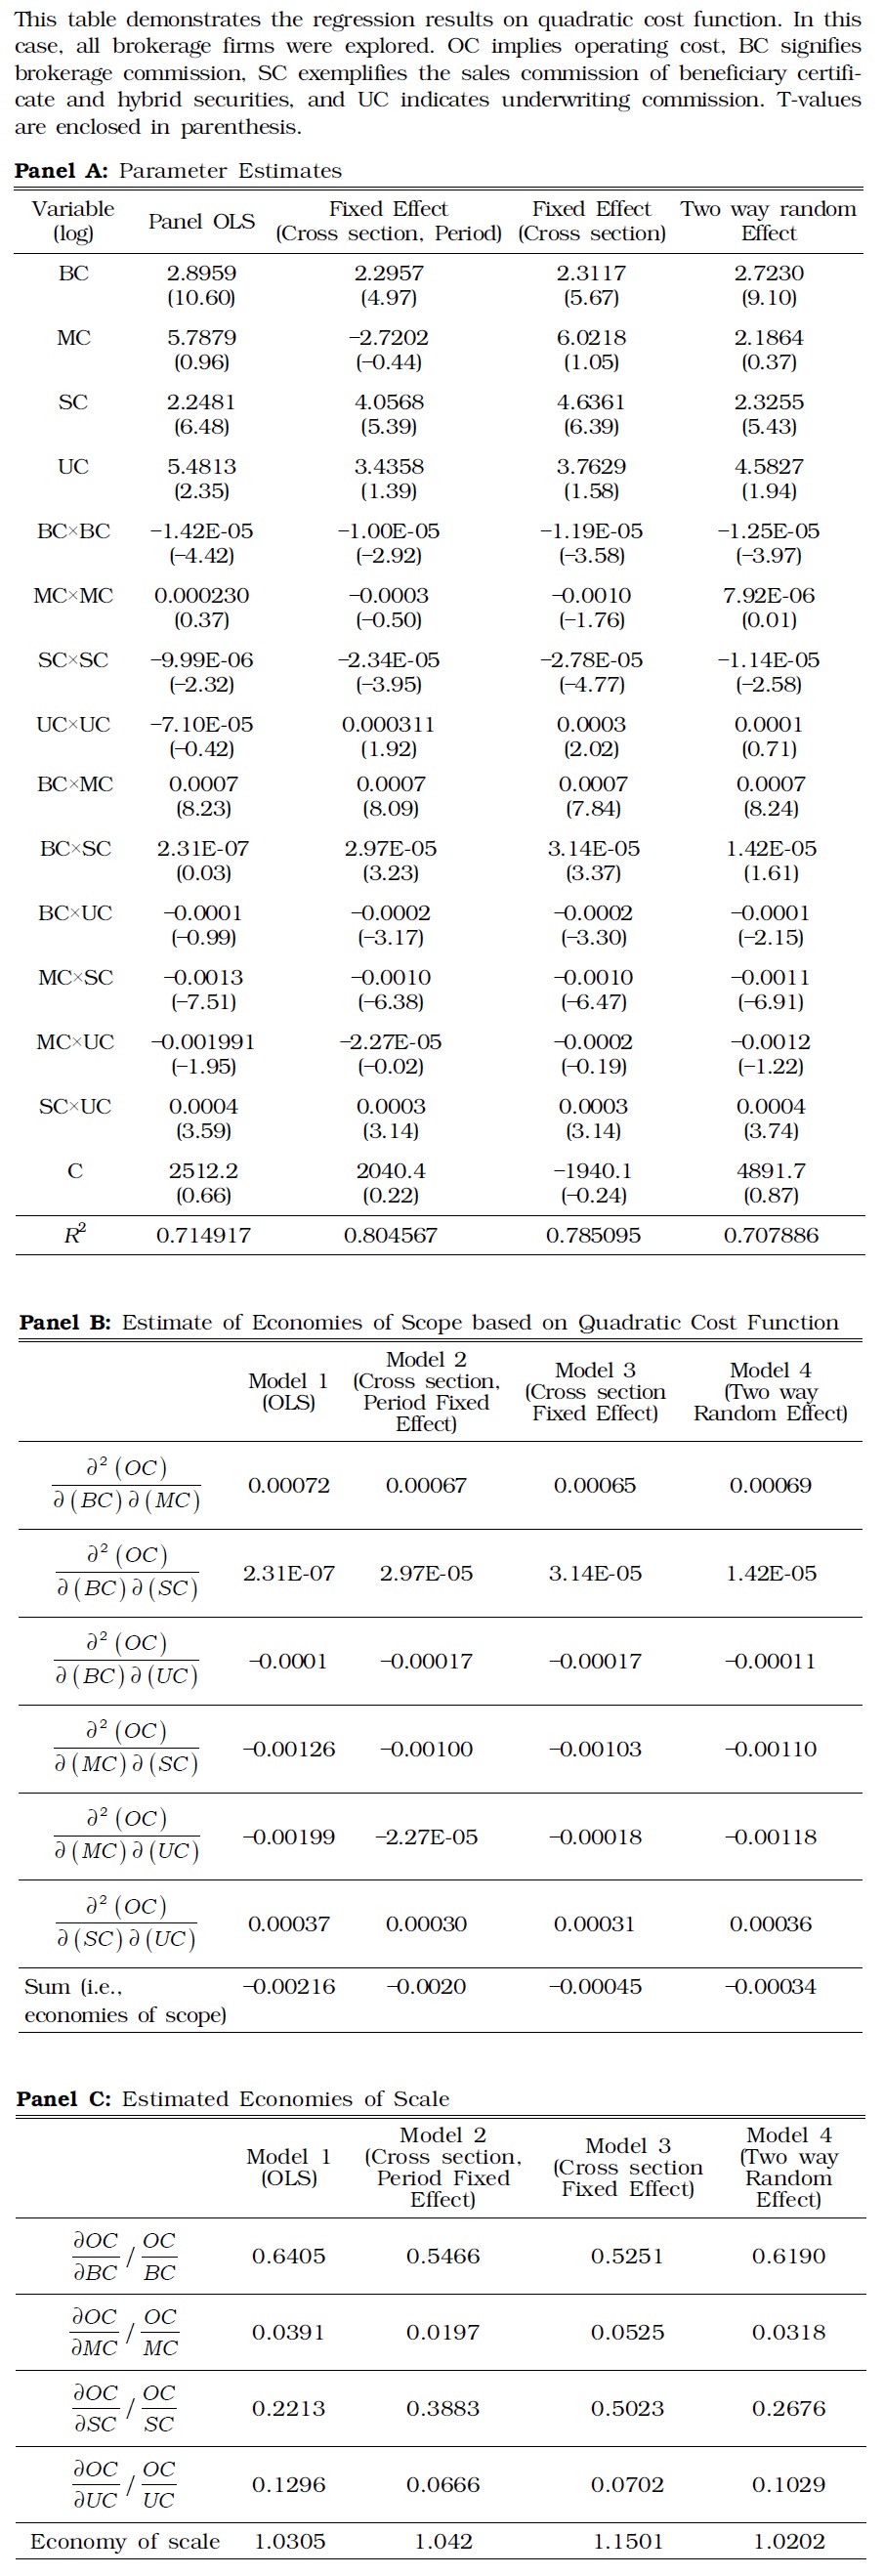
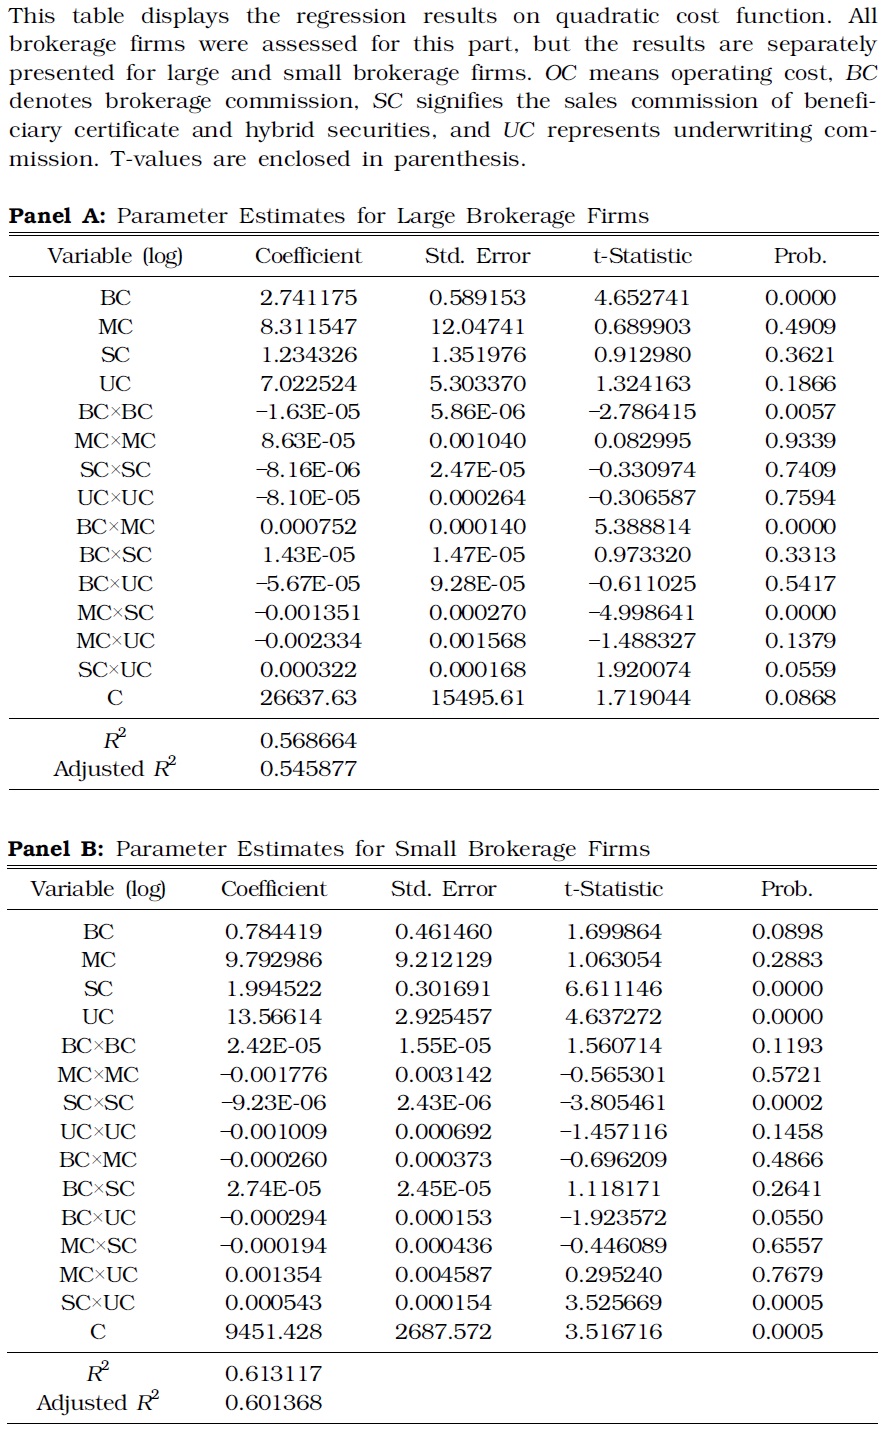
Unlike the translog function, quadratic cost function is applicable to all securities firms. Translog function can hardly model business divisions with zero production or firms without full range of operations. The estimate results from quadratic cost function are shown in Table 5. The economies of scale are most evident in Panel B of Table 5. Cost complementarity was not observed in all six cases of combining four service types; it was observed only in three cases, including the combinations of {brokerage, underwriting, and underwriting} or {wealth management, brokerage, sales of hybrid securities}. According to Panel C of Table 5, the economy of scale existed for all specifications. Table 6 separately displays the estimation results for the quadratic cost functions of small and large brokerage firms.
[TABLE 5] ESTIMATE RESULTS OF QUADRATIC COST FUNCTION

ESTIMATE RESULTS OF QUADRATIC COST FUNCTION
[TABLE 6] ESTIMATE RESULTS OF QUADRATIC COST FUNCTION FOR SMALL AND LARGE BROKERAGE FIRMS

ESTIMATE RESULTS OF QUADRATIC COST FUNCTION FOR SMALL AND LARGE BROKERAGE FIRMS
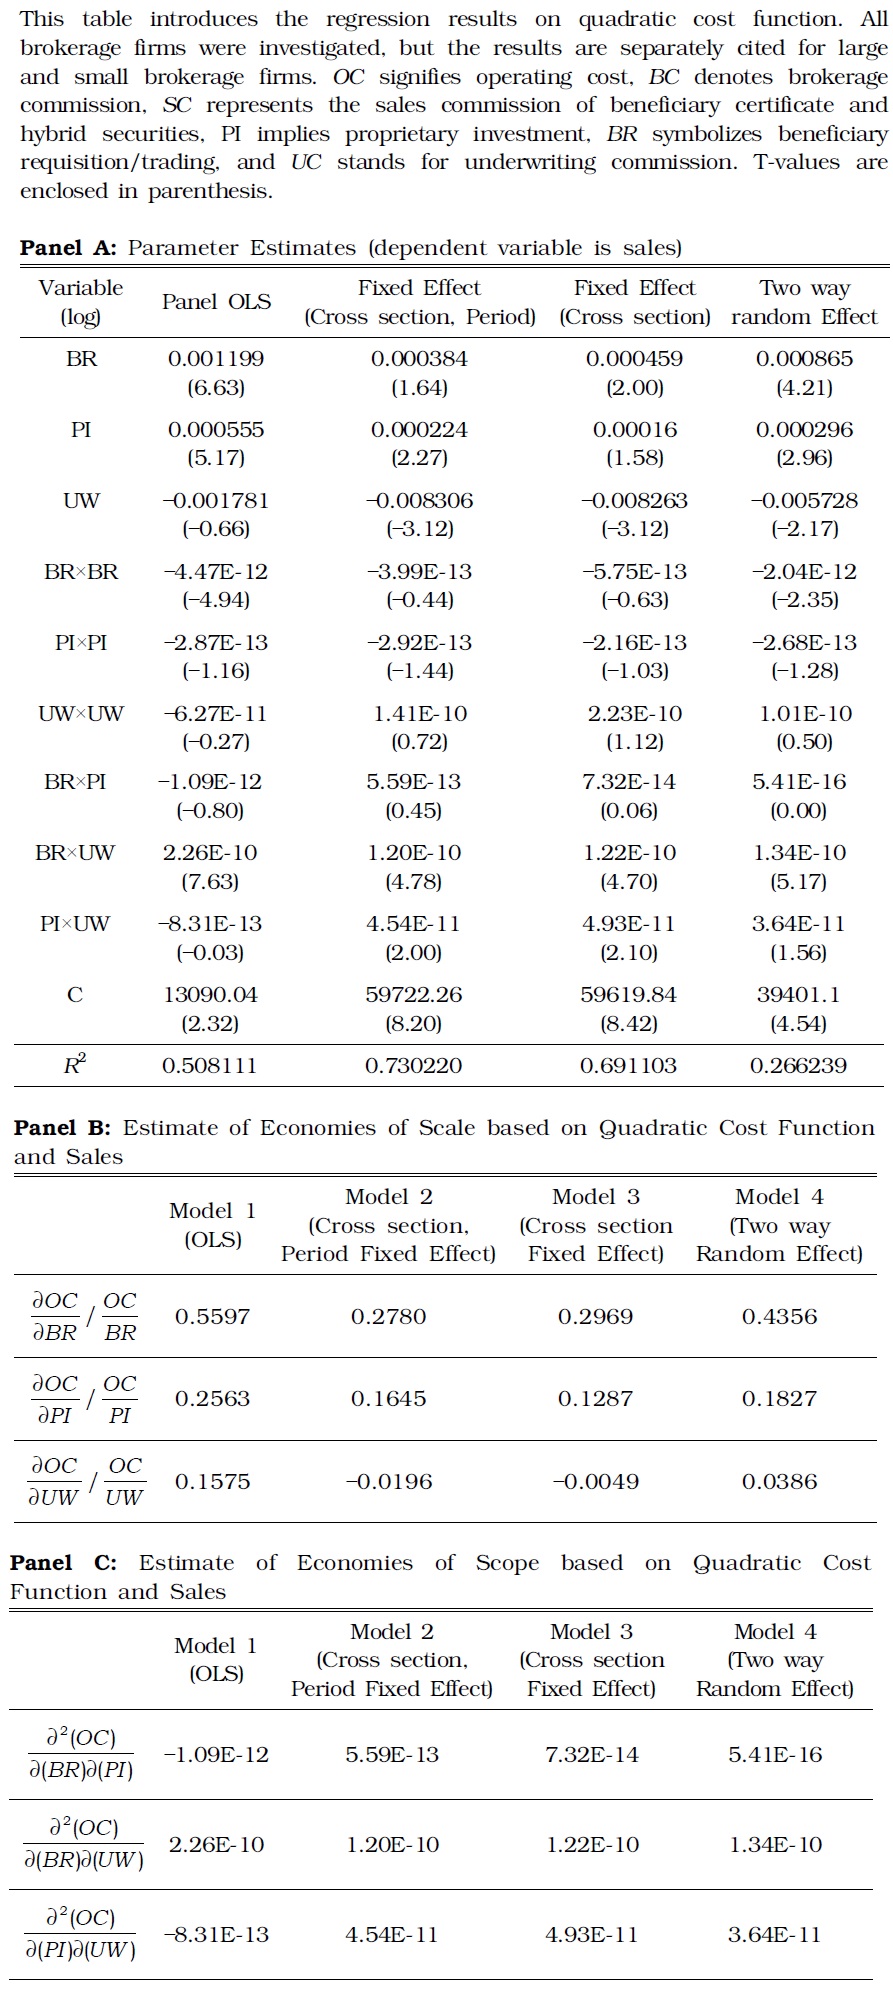
As a robustness check, this study estimated the quadratic functions using sales (Table 7). The results of this verification were qualitatively similar to Table 5 and Table 6.
[TABLE 7] ESTIMATE RESULTS OF QUADRATIC COST FUNCTION ON SALES

ESTIMATE RESULTS OF QUADRATIC COST FUNCTION ON SALES
This study estimated the cost functions of brokerage firms to examine whether they attain economies of scale and scope. Cobb-Douglas, hybrid translog, and quadratic cost functions were used, and the analysis was conducted for groups of large brokerage firms, small firms, and all firms put together. The brokerage firms considered large were those whose market share of commission fee is 4.0% or higher, including nine companies. The other 17 companies were categorized as small firms. The estimate based on the Cobb-Douglas function revealed that the economies of scale were attained in all brokerage firms regardless of their sizes. The quantile estimate induced identical results, indicating that the ratio of marginal cost to average cost gradually declined when the amount of cost increased. Moreover, the results of the analysis showed the presence of economies of scale, which were also observed in the estimates based on the translog cost function for large-sized firms. Translog function analyzes only large companies because it requires a firm to undertake all types of services to be analyzed. Quadratic cost function was applied to all securities firms, and the results indicated the economies of both scale and scope. When the firms were grouped by size, large firms attained greater economies of scale.
The major contribution of this study is that it broadly examined the relationship between the size and economies of scale and scope in securities industry. Only three marginally related papers exist, but they were published more than ten years ago despite the recent dramatic development of the financial industry. In particular, the current research examined and analyzed the recent market conditions and applied various cost functions for estimates, including the Cobb-Douglas, translog, and hybrid cost functions. Linear and quantile regressions were both applied for analysis, overcoming the limitations of prior studies.
This study presents important implications in terms of policy recommendations and practical applications. The profit of brokerage firms has recently declined sharply, while their business portfolios have grown extremely similar, losing diversity. This problem can be addressed by seeking policies that can restructure the industry. In doing so, cost functions must necessarily be estimated, and the presence of economies of scale and scope must be examined. This study also provides practical implications to understanding the current conditions and future outlook of the securities sector.
For example, the presence of economies of scale is a necessary condition for M&A. A firm with economy of scale will be better off with an M&A rather than without it. This study posits that, the Korean securities industry, particularly larger securities firms, benefit from M&A due to the economy of scale. Therefore, the government should not discourage M&A in the industry. Moreover, the economy of scope also exists. The economies of scope are the cost complementarity between brokerage, sales of convertible bonds, and hybrid securities. This variable indicates where and who should try M&A. Accordingly, if M&A does not occur in the industry, the government may need to check whether any regulatory or institutional restrictions exist against M&A.
This study has limitations such that it did not include time-series data for the pre-Asian crisis period, which was unavoidable because of the structural break that transformed the financial industry before and after the crisis. Moreover, this study did not analyze data from branch offices of foreign brokerage houses, which are small and marginal players. Further study must be conducted to estimate the cost functions of other financial institutions, including banks, insurance companies, and wealth management firms, to investigate the economies of scale and scope across the financial industry in Korea. Such analysis is expected to provide an outlook on the overall financial industry.