세계의 자동차 분야는 급속도로 발전하고 있으며, 한국은 물론 선진국의 자동차 기업들도 세계의 시장에서 서로 우의를 점유하려고 기술기발은 물론 마케팅 전략에도 혼신의 힘을 다하고 있다. 그러나 각국의 기업들은 제품의 경쟁력 우의를 위해 원가절감 및 생산성 향상에 주력하고 있다. 그러므로 생산성 향상에 영향을 미치는 주체로서 기업의 내부 구성환경 및 직원의 직무만족 등 다양한 요인들이 영향을 미치는 것으로 판단된다. 본 연구에서는 기업의 생산성 향상에 미치는 내부 구성요소가 어느 정도 서로 기여하고 있는지를 확인하고 그 요인들의 관계성을 살펴보기 위하여 자동차 중소기업의 12개 161명을 대상으로 설문조사를 실시하고 이를 토대로 분석하였다. 수집된 설문조사 자료는 데이터의 신뢰성과 타당성을 검토한 후, SPSS의 Amos를 이용한 구조방정식 분석과 함께 각 연구 가설과 연구모형을 검증하는 방법을 이용하였다. 본 연구의 결과는 생산성향상과 구성원의 직무만족에 어떠한 영향을 주는지를 규명하여 급변하는 국내외 기업 환경변화에 탄력적으로 대처하는 전략수립에 의미가 있을 것으로 사료된다.
Korean automobile industry has been rapidly developing and expanding, but at the same time, the competition in the industry and the challenge from inside and outside are getting tougher and tougher. In particular, US and Japan as well as other European established leaders in the industry are exerting their best to maintain their competitiveness by reducing costs and improving productivity. A great deal of their efforts to reduce costs focus on the cost of materials and labor expenses. Increased competitiveness comes from reduced costs. The productivity of a company, in turn, might depend on a variety of factors, which can be categorized into two kinds: tangible features and intangible ones. The former might refer to factors such as labor expenses, education/training and work characteristics and the latter include personal relationships among workers and motivational attitude toward jobs. Improvement in these areas of tangible and intangible factors will lead to improved productivity and job satisfaction. According to the statistical data about Korean manufacturing industries, both salary and productivity have been on the increase. The equilibrium theory attributes this correlation to the claim that increased productivity leads to increased salary, while the efficiency salary system and the unnatural pay increase by labor union might result in the opposite direction; increased salary lead to increased productivity(kim. 2009) Also, the employees' job satisfaction is one of the most influential factors for productivity and it refers to their affective and emotional attitude toward their jobs. (Heo. 1998) Tifin & McCormick defines job satisfaction as a process of gained or experienced need satisfaction coming from their jobs. It varies and depends on an individual's system of values, since it is by large a personal feature(Joseph Tiffin. 1974) The elements affecting job satisfaction might include coworkers, supervisors, salary, policies, promotion and customers.(Friedlander 1963) Job satisfaction depends on two sets of variables: internal and external elements. Internal factors can be further categorized into internal satisfaction and internal reward. The former refers to satisfaction with the job itself and reward for an individual's work performance. The internal reward means experiencing a sense of accomplishment and self-realization and it also includes a sense of challenge, acknowledgement, responsibility, and career development. The external elements, in turn, refer to promotion and the level of salary. Many researches have been performed to identify how these elements affect productivity.
The present research is based on a survey conducted to 161 employees who work in small or medium size companies in the automobile industry, which has been one of the leading and driving industries in Korean economy. We aim to identify how productivity and job satisfaction are influenced by a set of factors including work characteristics, achievement-orientation, work environment(peer relationship, hierarchical relationship and supervision), and reward systems(salary, promotion and education/training). The survey questions were answered by both managerial staff and production workers. The reliability analysis of the collected data was tested via Cronbach's alpha index. The effect analysis among the groups was carried out by structural equation models. SPSS' Amos was the software for the test of the hypotheses under analysis.
2.1 Theoretical considerations on business performance
A crucial parameter expressing business performance is growth of productivity. The most important factors affecting improved productivity include employees' job satisfaction and personal relationship among them - both peer and hierarchical relationship. The reward factors include training, education and salary.
Geweke(1982, 1984), using linear feedback system, analyzed the relationship between productivity and salary. Milliea(1998, 1999) adopted Geweke's linear feedback and conducted a similar research. This linear feedback method separates linear dependence between the two time series factors into bi-directional and enables us to examine contemporaneous association as well as the effect of one on another.(Geweke. 1982) Friendlander classified factors of job satisfaction into 3 categories: social/technical environment, fundamental job aspect and stability through development(Friedlander. 1963), whereas Vroom claims that the factors are supervision, work group, job contents, salary, opportunities for promotion and work hours.(Vroom. 1964) Locke, on the other hand, lists 9 factors: job itself, salary, promotion, supervision, stability, benefits, job conditions, coworkers and management policies.(Locke. 1973) Adlerfer classifies the factors into 5 categories: salary, fringe benefits, respect from superiors, respect from coworkers and growth.(Adlerfer. 1967) Education/training varies from different industries; it shows very big time series difference. The importance of training/education is much bigger in the industry that involves rapid and big change in technology. The difference in training among the subcategories of the manufacturing industry is also remarkable in every sense. Black, S. and Lynch, I.(1996) compared the productivity of U. S. manufacturing industry at two distinct times and identified the significant relationship between education/training and productivity. They also showed that education/training at one point will have a positive effect on the productivity at another point after a certain period of time. It is essential that each company investigate into the relationship between productivity and job satisfaction on one hand and organization-internal elements such as work characteristics, employees' achievement directional, job environment(peer relationship, hierarchical relationship and supervision), reward factors(salary, promotion and education/training) on the other hand. The identified relationship will help the businesses establish their strategies to improve their competitiveness in the rapidly changing and developing industry in the world.
As mentioned above, the present research aims to present helpful and practical suggestions to help automobile manufacturers keep developing from the survey intended to identify how job satisfaction and productivity improvement are influenced by a variety of factors including accomplishment-orientation, work characteristics, job environment(communication, hierarchical relationship, peer relationship, supervision and training/education), reward factors(salary and promotion). To that purpose, we have set up 8 hypotheses for test as follows.
2.3 Empirical analysis and hypotheses testing
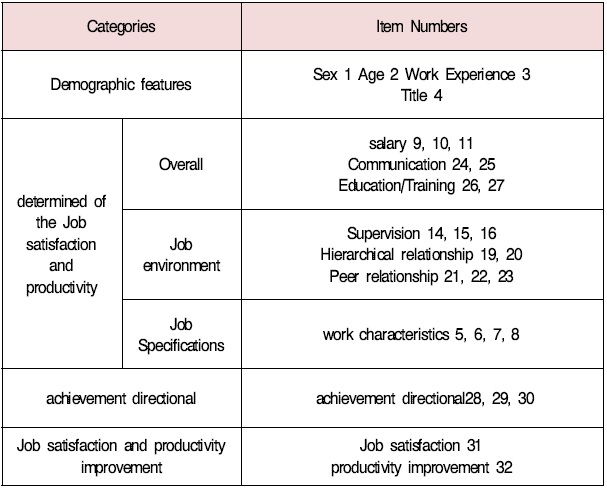
The current paper reports the results of the survey conducted to analyze the factors affecting job satisfaction and productivity improvement. Table 1 summarizes the organization of the survey. To test the research hypotheses and models, we evaluated the reliability and validity of the collected data and analyzed structural equation models using Amos of SPSS.

Survey questions
2.3.1 Reliability and validity of themeasured variables
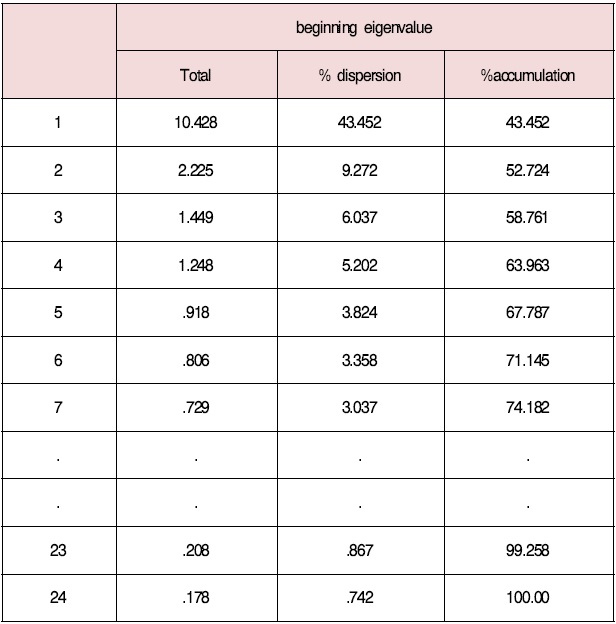
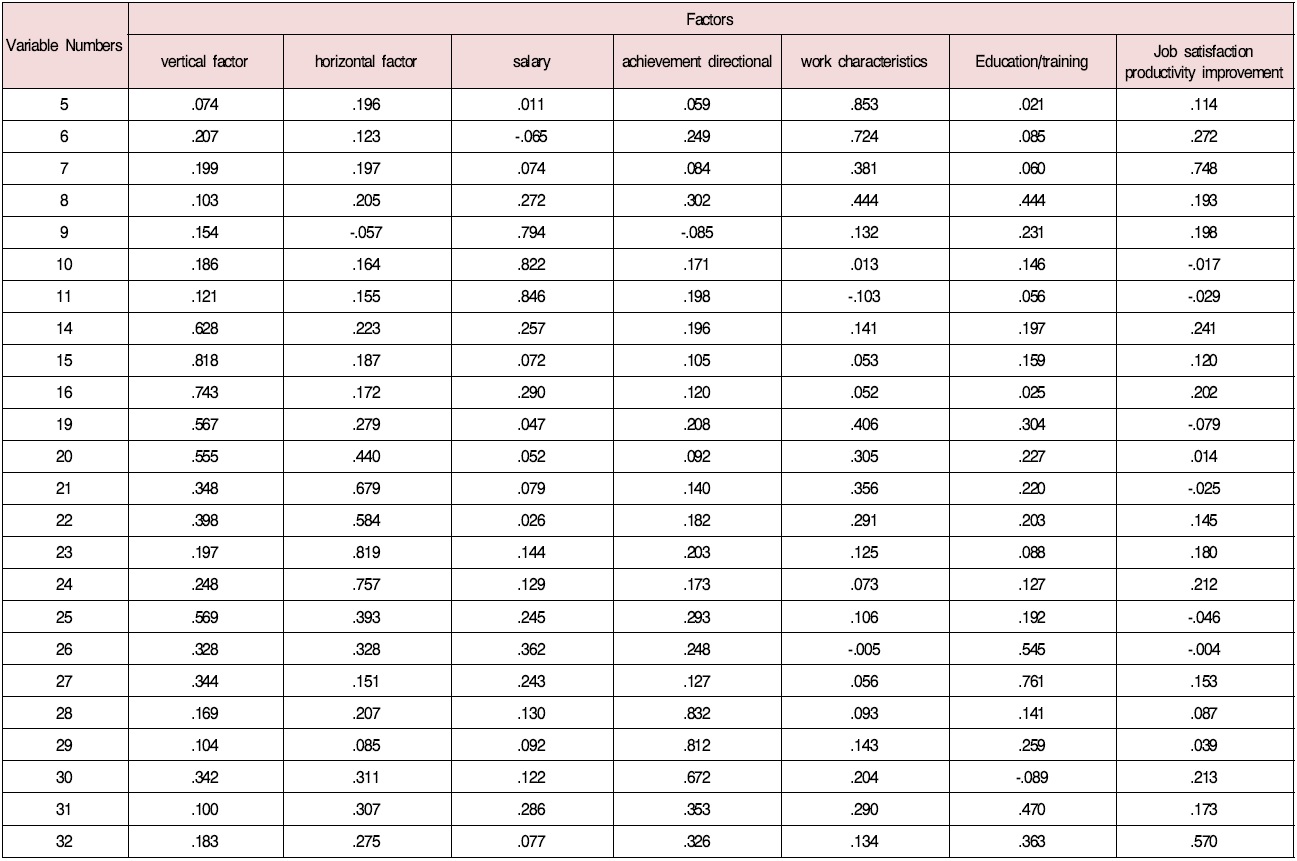
We have performed a factor analysis displayed in Table 2 in order to group the common properties of the determinant factors of vertical factor, education/training, horizontal factor, achievement directional and 24 variables relating job characteristics. The analysis shows that only 7 factors whose total dispersion is up to 75 % are selected. Table 3 also illustrates the grouping of the factors varimax method into 7 groups. The 7 groups are named as follows: Vertical Factor, Horizontal Factor, Salary, Achievement Directional, Work Characteristic, Education/training and Job Satisfaction/Productivity Improvement in that order. These 7 groups were set up as the variables of the structural equation model.
We use the Varimax method in order to eliminate the problem of multicollinearity that might result from the independence of the factors by regressing those variables.(Noh. 2002) The result of the factor analysis of the validity of the seven Group factors with 24 questions, it shows that all the items under measurement are within their factors
We have regressed factors and performed a factor analysis for the total of 24 items and found that all the items of measurement are involved in the original set of factors and that 74.18% of total dispersion are accounted for. Thus, it might be safe to conclude that the result of the factor analysis well meets the requirements for the validity of convergence and differentiation of variables.
[Table 2] Total dispersion against variables

Total dispersion against variables
To test the reliability of the grouped variables we have measured Cronbach's alpha indexes of the variables Table 4 exhibits the results and figures of each item under measurement. There might be various methods to analyze the reliability of items. If we use a scale of many items, we usually calculate the split-half reliability for each item and the Cronbach's alpha that represents their average.<Table 4> show that all the values range from 0.7 to 0.8, which accounts for their good reliability.
[Table 3] Constituent matrix of variables

Constituent matrix of variables
[Table 4] Cronbach's alpha ofvariables
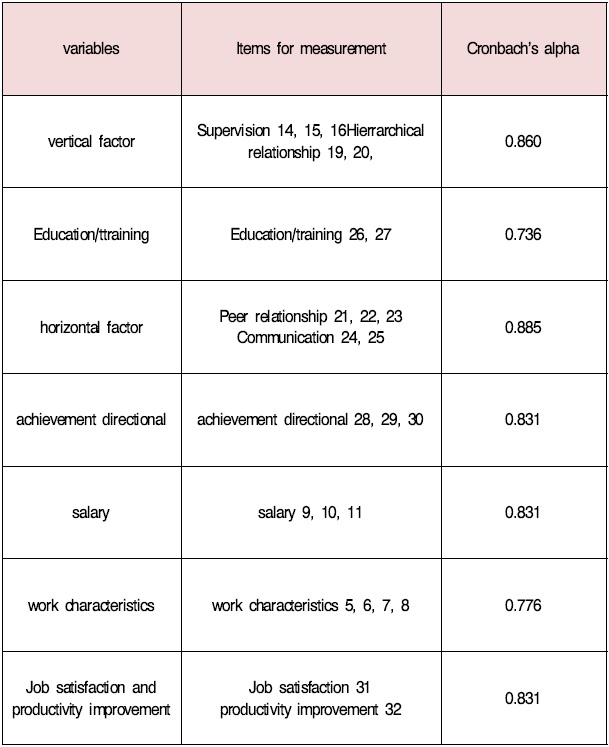
Cronbach's alpha ofvariables
2.3.2 Analysis of the model and test of hypotheses
2.3.2.1 Analysis of the model
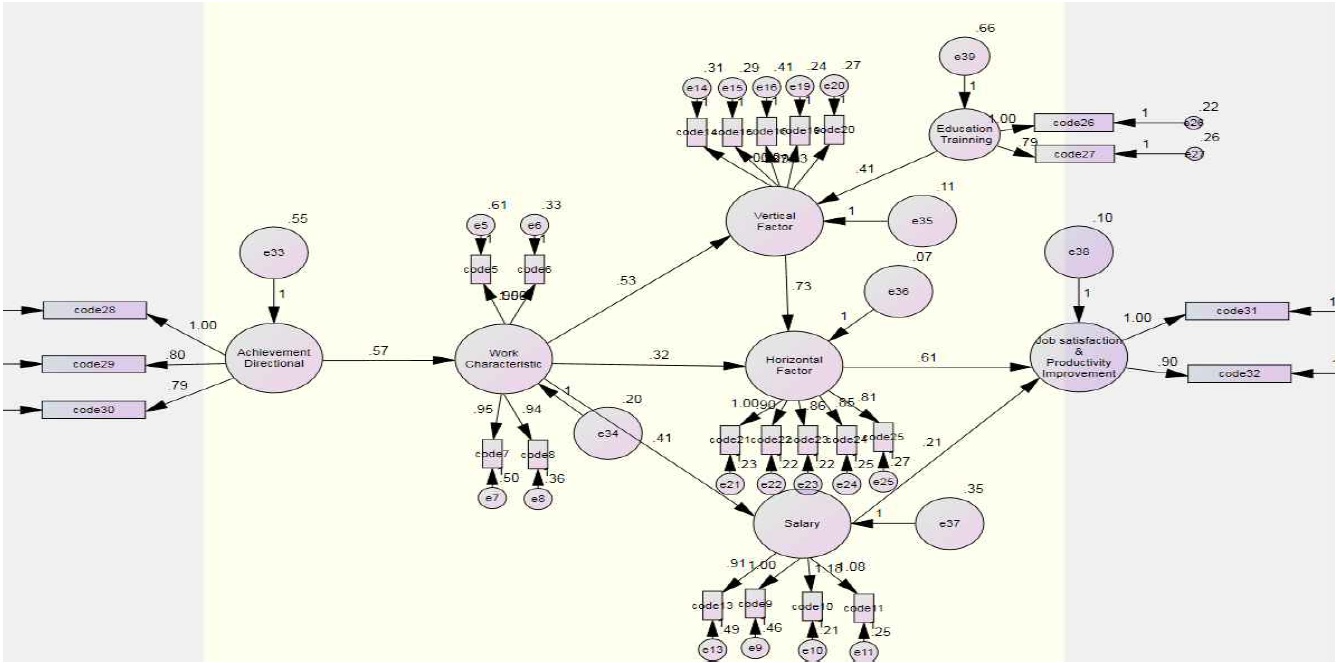
We have performed an analysis of the structural equation model using the variance-covariance matrix maximum likelihood method in order to test the set of research hypotheses and the research model. The overall suitability of the established model can be tested by calculating a set of goodness of fit tests. As illustrated in Table 5, GFI(Goodness of Fit Index) represents how well a given model explains the variance and covariance. In general, a given model is considered very good if the figure is greater than 0.9. Thus, the current model can be counted as 'good', since its GFI is 0.891.
Code numbers of the table5 are Survey question number(table 1) We have examined a set of models and decided on the structural equation model displayed in Figure 1. The path coefficient of exogeneous variables and endogeneous ones is summarized in table 5. These variables are shown to exert reciprocal influence to one another.
[Table 5] Path coefficient of the structural equation model
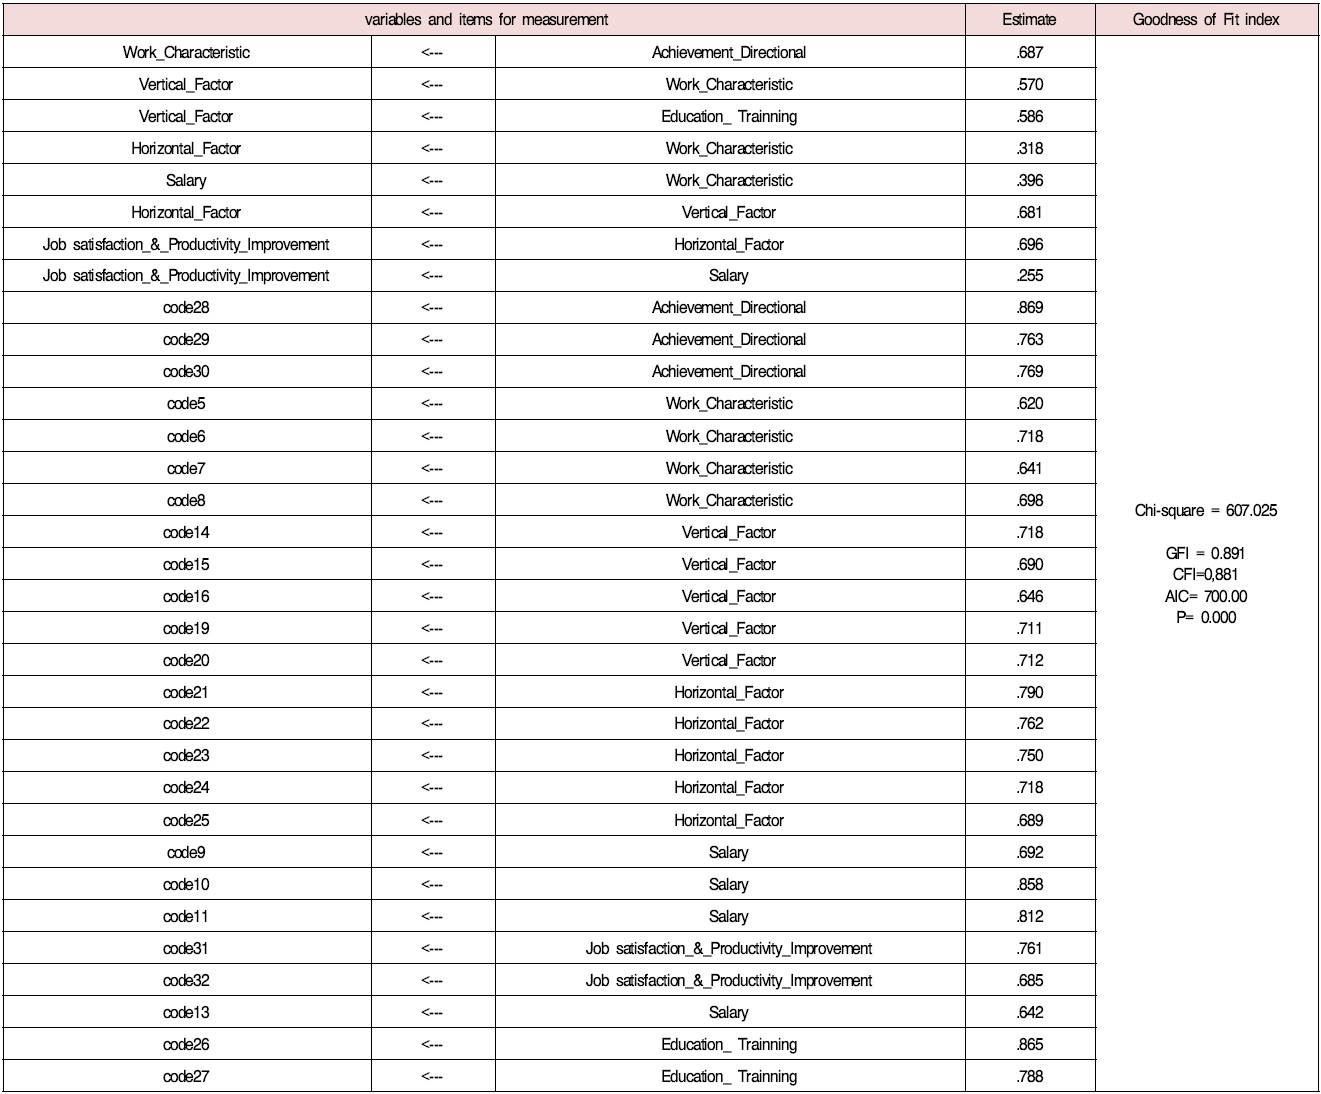
Path coefficient of the structural equation model
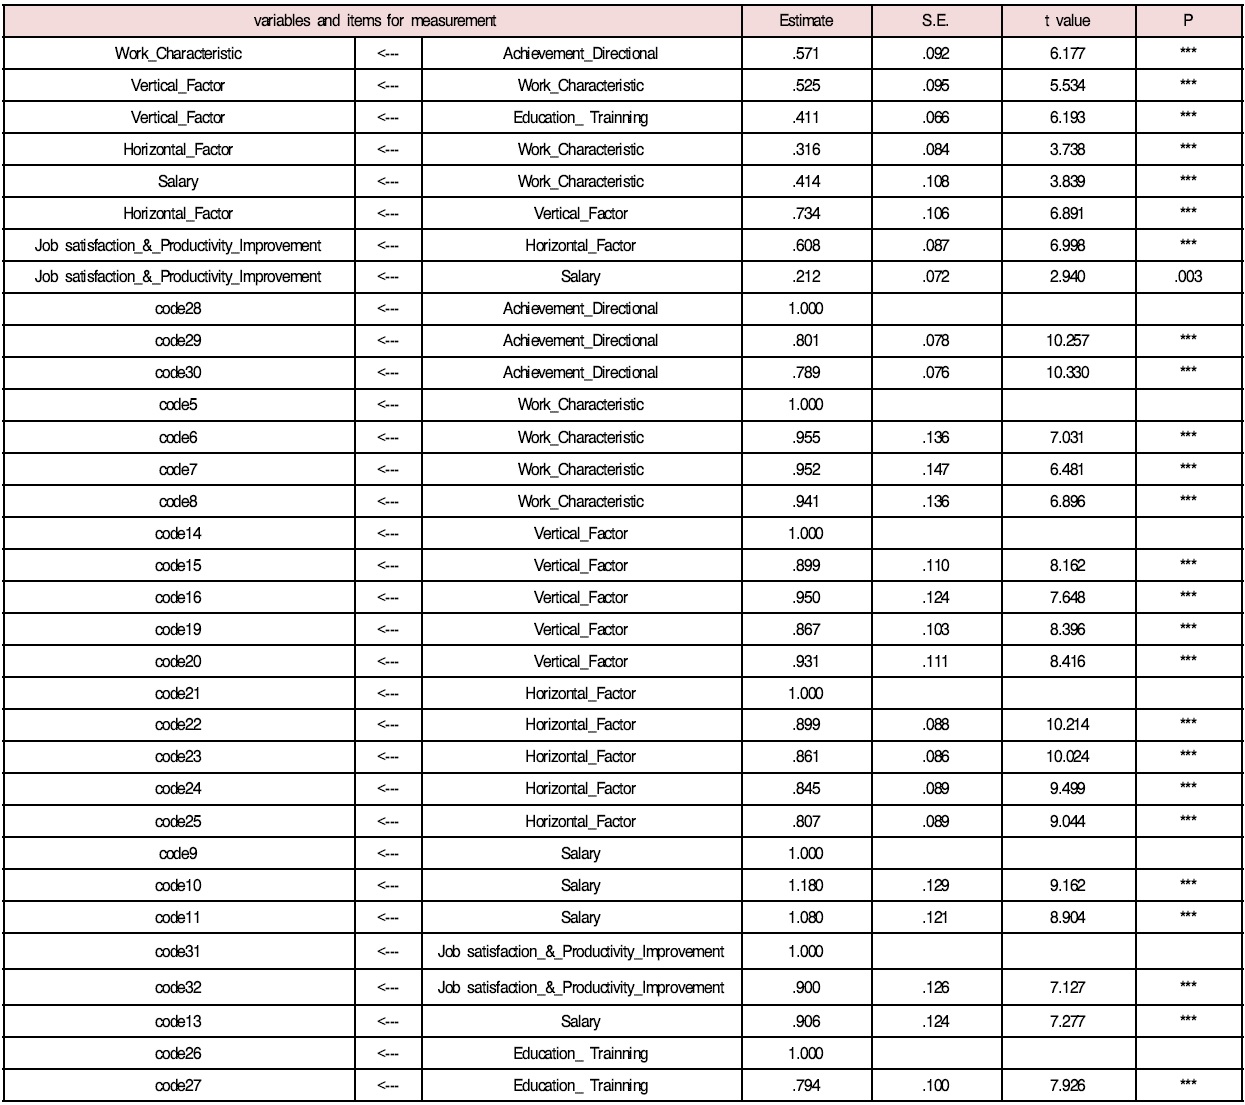
[Table 6] Regression Weight of the Structural Equation Model

Regression Weight of the Structural Equation Model
2.3.2.2 Test of hypotheses
To test hypotheses we appeal to the standard path coefficient and t-values using Amos of SPSS. The main results of the analysis are summarized in Table 6 and below.
First, a alternative hypothesis can be adopted for Hypothesis 1, since t≥1.96, which shows that an individual's achievement directional affects his or her work characteristics.
Second, a alternative hypothesis can be adopted for Hypothesis 2, since t≥1.96, which means that an individual's work characteristic affects his or her salary.
Third, a alternative hypothesis can be adopted for Hypothesis 3, since t≥1.96, which shows that education/training influences the vertical factor.
Fourth, a alternative hypothesis can be adopted for Hypothesis 4, since t≥1.96, which shows that an individual's work characteristic also influences the horizontal factor.
Fifth, a alternative hypothesis can be adopted for Hypothesis 5, since t≥1.96, which shows that the horizontal factor will affect job satisfaction and productivity improvement.
Sixth, a alternative hypothesis can be adopted for Hypothesis 6, since t≥1.96, which shows that reward factors(promotion and salary) affect productivity improvement.
Seventh, a alternative hypothesis can be adopted for Hypothesis 7, since t≥1.96, which shows that an individual's work characteristic influences the vertical factor.
Finally, a alternative hypothesis can be adopted for Hypothesis 8, since t≥1.96, which shows that the vertical factor influences the horizontal factor.
The business environment across the world has been changing rapidly. Any company that intends to maintain its competitive advantages in the ever changing market should focus on improving productivity and employees' job satisfaction. Small businesses should also improve productivity, reduce costs and improve quality of their products. Every member of an organization including management must be well prepared for the change of elements of internal environment to increase competitiveness. It should also be remembered that job satisfaction does not depend solely on internal factors and that a combination of many factors are closely correlated with job satisfaction.
The current paper shows that improvement of productivity and employees' satisfaction are closely related with a variety of variables such as work characteristics, vertical and horizontal relationships among the members of a company, education/training and reward including salary.
Therefore, businesses must be aware of where they are in the market, identify what they lack and try to deal with their weaknesses to secure competitive edges. It should be worthwhile to apply the current analysis to large companies.