One of the features of modern research in recent years has been the spectacular development of scientific discoveries and growth of knowledge, say Gupta et al. (2002). This has caused an unprecedented accumulation of information and has become a major concern for scientists and researchers (Meera & Sangam, 2010). Hence, there is a need to study the growth of scientific knowledge and its dynamics in every field of activity.
The word ‘growth’ represents an increase in actual size, implying a change of state. In science and technology, growth may imply an increase in number of institutions, scientists, or publications, etc. Ravichandra Rao (1998) says that a change in the size of literature over a specific period of time is termed as ‘growth of literature.’ One of the features of modern research in the twenty-first century has been the unprecedented and spectacular development in scientific inventions, discoveries, and the growth of knowledge. This has caused an unexpected accumulation of information (Gupta et al., 2002). Hence, there is a need to study this growth of knowledge and its dynamics. Price (1966 & 1975) was one of the pioneering researchers who studied the growth of science and found that the exponential model holds well with high accuracy in the majority of growth data of publications. The fitting of growth models, distributions, and curves to the data on exponentially growing literature and identifying the best fitting one to explain the growth of literature is an important aspect of growth study. The present study is aimed to study the growth of neurology literature published in the Science Direct database.
The understanding of the process of growth of knowledge in research specialties and its modeling has challenged bibliometricians and sociologists for a long time, say Gupta et al. (1997). Gilberts’ (1978) work reveals the existing literature on the indicators of growth of knowledge in scientific specialties and lists many ways of measuring it. The analysis of Gupta et al. (1999) suggests that the growth of Indian physics literature follows a logistic model, while the growth of world physics literature is explained by the combination of logistic and power models.
Seetharam and Ravichandra Rao (1999) in their work compare trends in the growth of Food Science and Technology (FST) literature produced by CFTRI scientists, by food scientists in India, and by food scientists of the world, covering a period between 1950 and 1990. Further, the authors identify the best fitting growth models for actual and cumulative growth of data through various growth models. Different approaches are introduced by Gupta and Karisiddappa (2000) in their paper for studying the growth of scientific knowledge as reflected through publications and authors. The selected growth models are applied to the cumulative growth of publications and authors in theoretical population genetics from 1907-1980. It is concluded that the power model is observed to be the only model among the models studied which best explains the cumulative growth of publication and author counts in theoretical population genetics.
Karki et al. (2000) investigate Indian Organic Chemistry research activity during 1971-1989 using Chemical Abstracts. The authors conclude that the growth trends for India and world for organic chemistry follow the same patterns and the output in the three sub-fields is not going to saturate in the near future. Gupta et al. (2002) apply selected growth models to the growth of publications in six sub-disciplines of social sciences, namely economics, history, political science, psychology, and sociology in the world. The results show that the power model (α>0, γ>1) followed by logistic models are best describing the cumulative growth of publications in all sub-disciplines. Both power and logistic models are applicable: the power model (as reflected in trend values of α1) and logistic model (as reflected in trend values of α2) in the case of cumulative growth of publications in history, political sciences, and psychology.
Tsay (2008) explores the characteristics of hydrogen energy literature from 1965-2005 based on the database of Science Citation Index Expanded (SCIE). The study reveals that the cumulative literature on hydrogen energy may be fitted relatively well by an exponential fit. Szydlowski and Krawiec (2009) present a description of knowledge more realistic than simple exponential growth. The study also reveals that the data on symbolic logic exhibit an exponential trend with some periodic oscillation. Ramakrishna (2009) examines the growth of references over the past fifteen years (1994-2008). The results show that the linear growth model provides better fits to the observed data, whereas the exponential model provided the poorest fit.
Sangam et al. (2010) study the growth and dynamics of Indian and Chinese publications in the field of liquid crystals research (1997-2006) by applying growth models as suggested by Egghe and Ravichandra Rao (1992). The authors conclude that these power and growth models are likely to be fully applicable in the growth of Indian, and linear, power, and growth models applicable in the growth of Chinese liquid crystals literature. Bouabid (2011) proposes a model which is proved to be suitable to represent observed citation distribution over time and to interestingly identify with accuracy when the major loss of citations happens. The model fits the observed data from Science Citation Index (SCI) according to R2 which is greater than 98.9 %. Zhao and Guan (2012) assess the dynamic associations between scientific activity and technological output. The authors use the simultaneous equations model to analyze the reciprocal dependence between science and technology. The result shows that there is no significant connection between R&D expenditures and actual practices of research in terms of publications.
The specific objectives of the study are
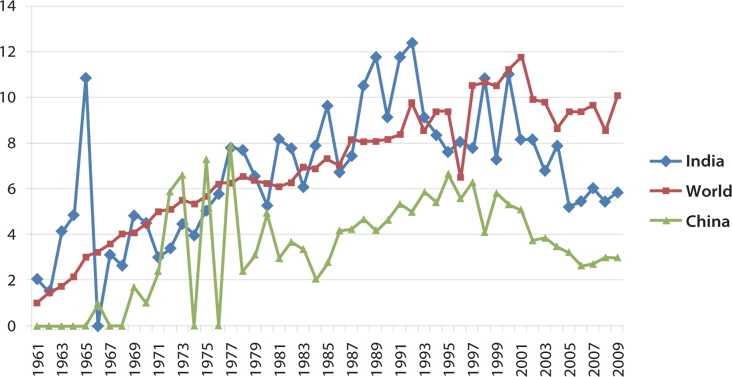
1. to study the growth of neurology literature (RGR) and also compare the growth rate as reflected in the Science Direct database among the world, China, and India.
2. to examine the Doubling Time (Dt.) of the neurology literature.
3. to analyze the fit of neurology literature for cumulative numbers of publications in terms of different models.
The dataset was collected from the Science Direct database for the period 1961-2010. A total of 291,702 records were received for fifty years. Science Direct is one of the most comprehensive database covering all subjects. Most of the research output on neurology is covered under the Science Direct Database. Hence, the same database is selected as a source for the present study. The keyword ‘neurology’ has been used for extracting the number of records available in the said database. The retrieved records were examined, classified, and analyzed keeping the objectives in view. Further, the data is analyzed using MS Excel spreadsheet and SPSS software (15th version). Relative Growth Rate (RGR) and Doubling Time (Dt.) of neurology literature have been calculated, supplementing with different growth patterns to check whether the neurology literature is fit for exponential, linear, or logistic models.
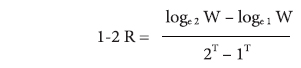
The Relative Growth Rate (RGR) is the increase in number of articles / pages per unit of time. This definition is derived from the definition of relative growth rates in the study of growth analysis of individual plants and is effectively applied in the field of botany (Hunt, 1978 & 1982; Poorter & Garnier, 1996; Hoffmann & Poorter, 2002). The mean Relative Growth Rate (RGR) over the specific period of interval can be calculated from the following equation:

Whereas
1-2 R = mean relative growth rate over the specific period of interval
loge 1 W = log of initial number of articles
loge 2 W = log of final number of articles after a specific period of interval
2T − 1T = the unit difference between the initial time and the final time
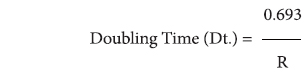
There exists a direct equivalence between the relative growth rate and the doubling time (Bradford, 1934). If the number of articles / pages of a subject double during a given period then the difference between the logarithms of numbers at the beginning and end of this period must be logarithms of number 2. If natural logarithm is used this difference has a value of 0.693. Thus, the corresponding doubling time for each specific period of interval and for both articles and pages can be calculated by the formula;

5.1. Year Wise Distribution of Literature (1961-2010)
Table 1 depicts the year wise distribution of papers in neurology literature. The world output in neurology literature is 286,001 (98.05 %) records and that of China is 3,730 (1.28 %), followed by India with 1,971 (0.68 %) records. A total of 291,702 records were extracted from the database for the period 1961-2010. It is observed that there is a steady growth of publications for world (except 1997) and China. A fluctuating trend was observed for India during the study period. An average of 5,720 papers were published per year at the global level, followed by China’s average at 74 and India’s average at 39. The maximum world contribution is observed during 2009 (20,656 publications) and those of China and India were published during 2010 (769 and 219, respectively). China took 24 years to achieve double digit numbers of publications, whereas India took twelve years to achieve the same. However, China took only 20 years to achieve three-digit numbers of publications but India took 33 years to achieve the same. The Relative Growth Rate (RGR) and Doubling Time (Dt.) of China, India, and world is calculated and presented in successive tables.
[Table 1] Year-Wise Distribution of Literature (1961-2010)
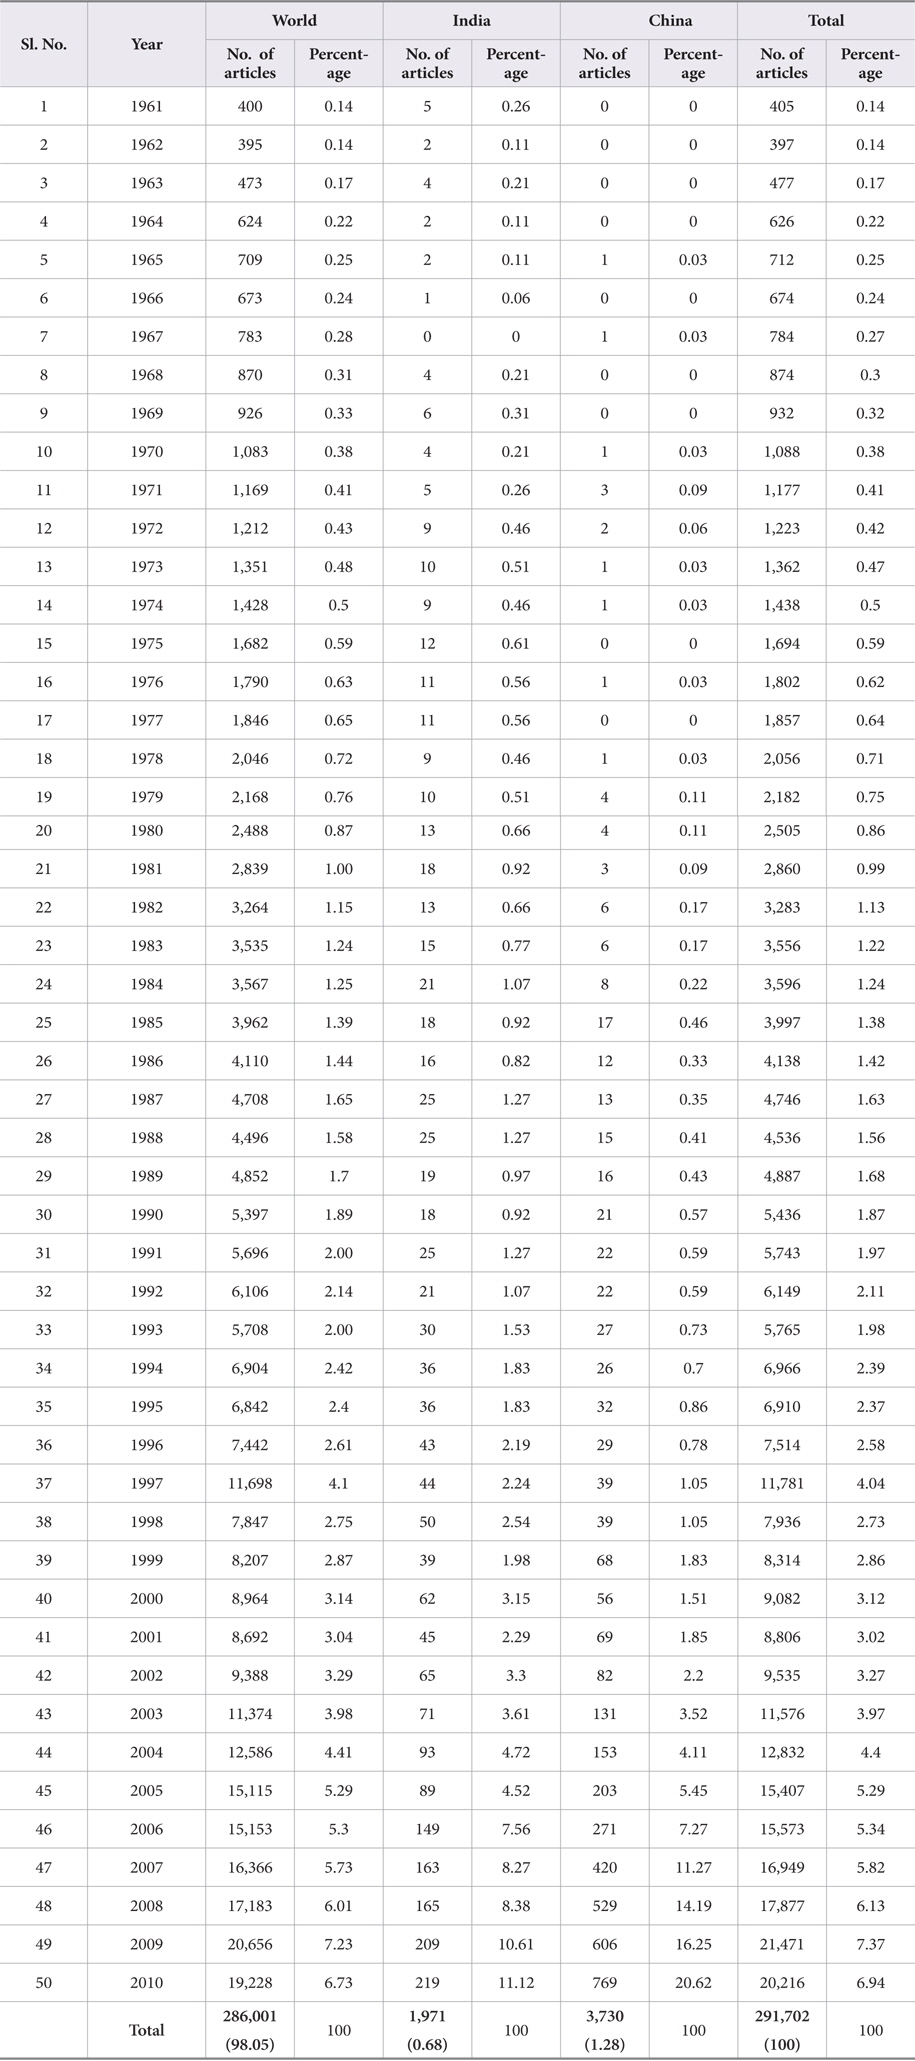
Year-Wise Distribution of Literature (1961-2010)
[Table 2.] Descriptive Statistics of Neurology Literature
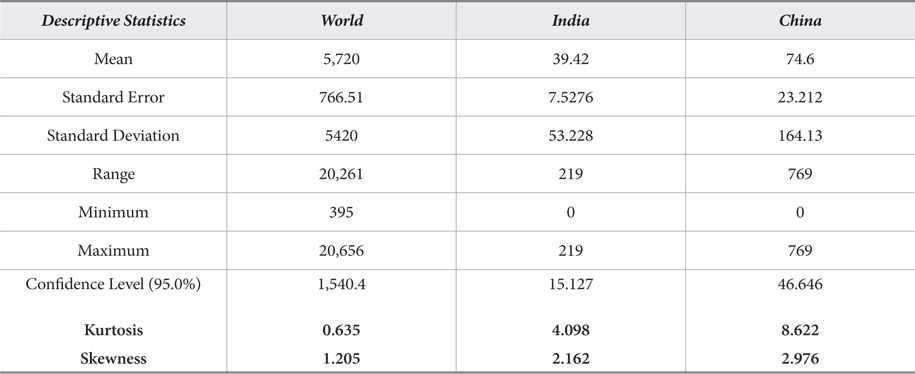
Descriptive Statistics of Neurology Literature
5.2. Relative Growth Rate (RGR) and Doubling Time (Dt.) (India)
The Relative Growth Rate (RGR) and Doubling Time (Dt.) of publications in India have been presented in Table 3. It indicates that the value of Relative Growth Rate (RGR) of publications decreased from 0.337 in the year 1962 to 0.119 in 2010. Simultaneously, the values of Doubling Time (Dt.) increased from 2.056 in 1962 to 5.823 in 2010. It is evident from the study that research in the field of neurology in India has increased over a period of time.
[Table 3] Relative Growth Rate (RGR) and Doubling Time (Dt.) (India)
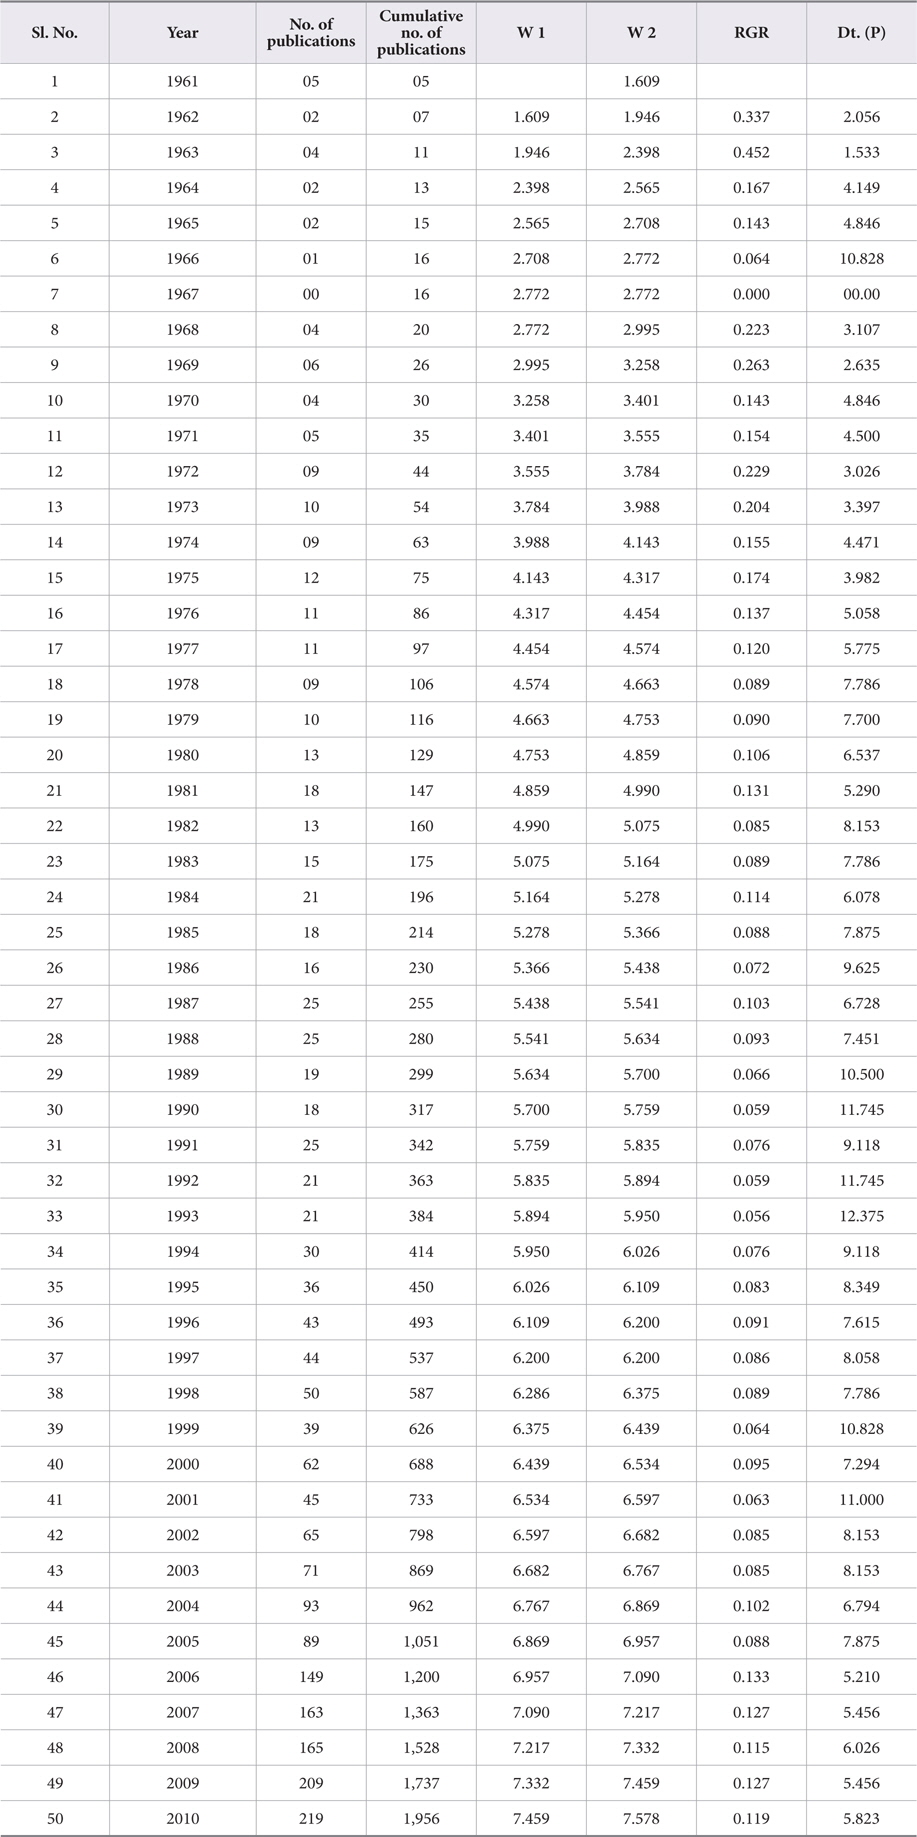
Relative Growth Rate (RGR) and Doubling Time (Dt.) (India)
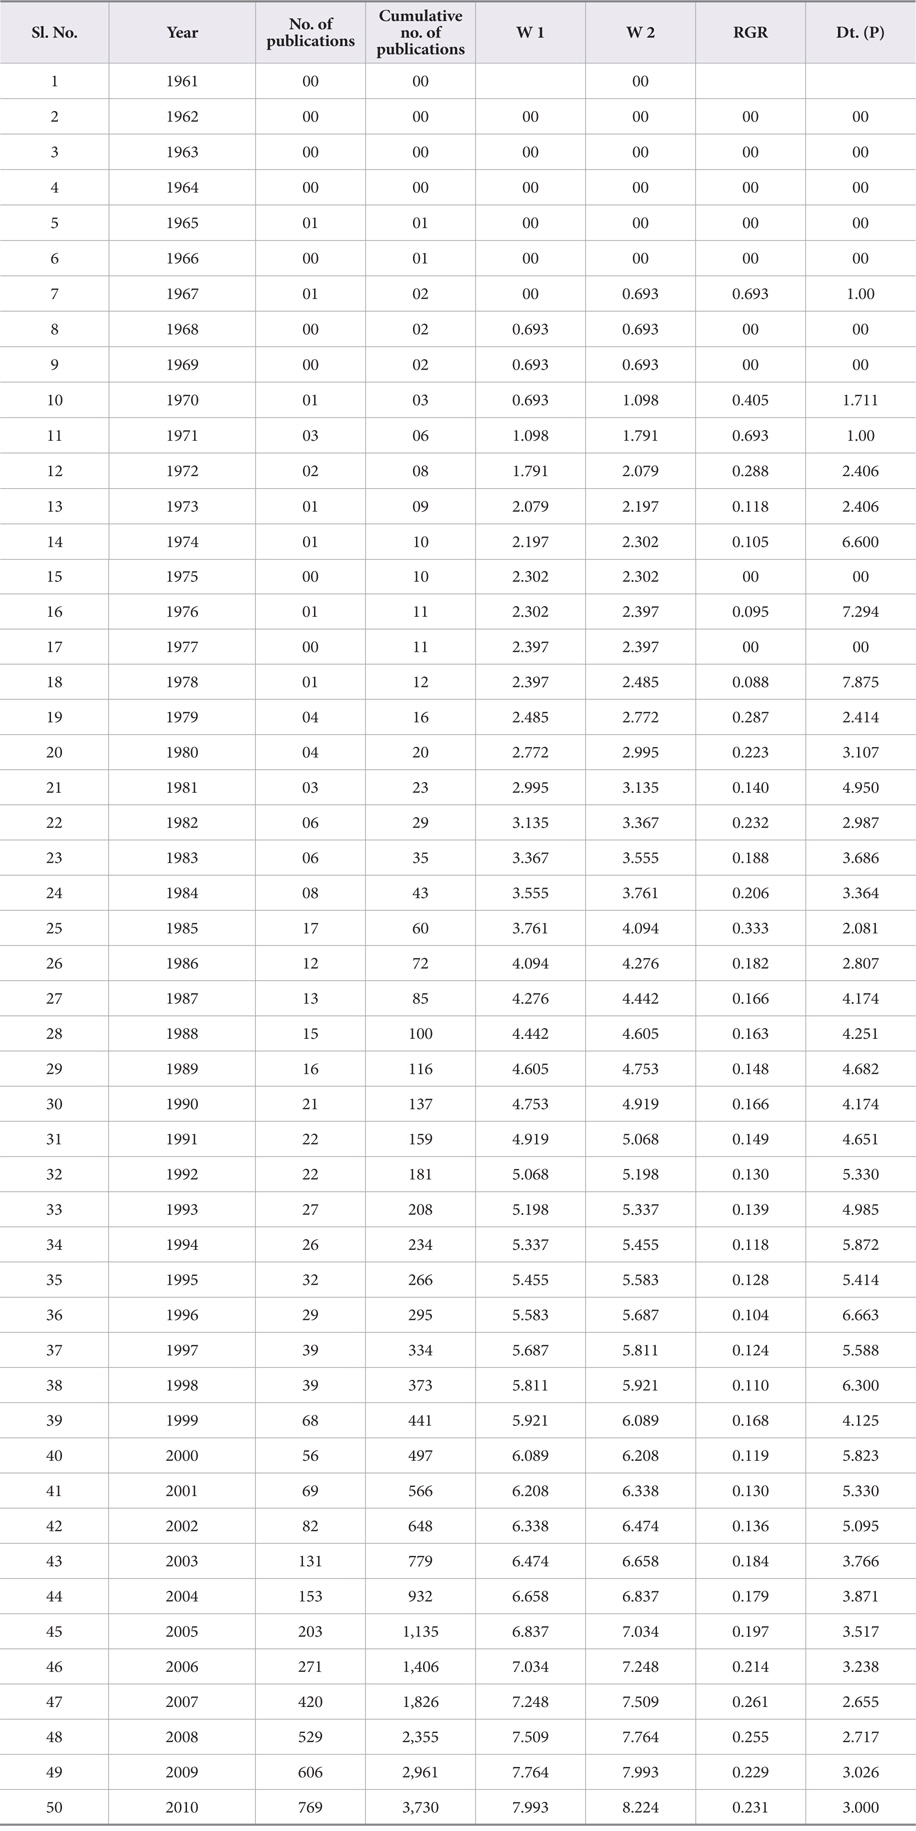
5.3. Relative Growth Rate (RGR) and Doubling Time (Dt.) (China)
The Relative Growth Rate (RGR) and Doubling Time (Dt.) of publications in China have been presented in Table 4. The study reveals that the value of RGR of publications decreased from 0.693 in 1967 to 0.231 in the year 2010. However, the values of Doubling Time (Dt.) increased from 1.00 in 1967 to 3.00 in 2010. It is also observed from the study that research in the field of neurology in China has increased over a period of time.
[Table 4] Relative Growth Rate (RGR) and Doubling Time (Dt.) (China)

Relative Growth Rate (RGR) and Doubling Time (Dt.) (China)
6. GROWTH MODELS OF NEUROLOGY LITERATURE
The authors briefly introduce three growth models, viz. the Linear Growth Model, the Exponential Growth Model, and the Logistic Growth Model, which are generally used in the literature for analyzing the growth of literature in different subjects.
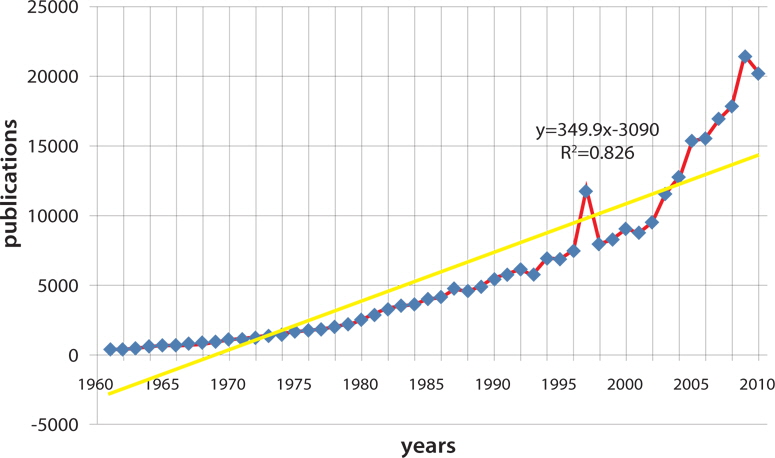
The Linear Growth Model describes growth to be constant or similar from year to year. Thus, a graphic representation of the yearly data accumulated would be a straight line.
The growth of publications in the field of neurology literature follows the Linear Growth Model.
To find out the growth pattern in the field of neurology literature, publications over the last fifty years (1961-2010) were considered as a sample for the analysis in order to fit the data to test whether the growth of literature in neurology follows the Linear Growth pattern or not. The expected numbers of publications (y) or (p) were computed using the following formula:
Y= a+bx
Where a and b are constants
X is the unit of time
The results of a Chi-Square test of goodness of fit indicated that the calculated Chi-Square value (X2 = 10,094.5) is much higher than the critical Chi-Square value of 31.41 for 49 degrees of freedom (
[Table 5.] Fit into Linear Growth of Neurology Literature
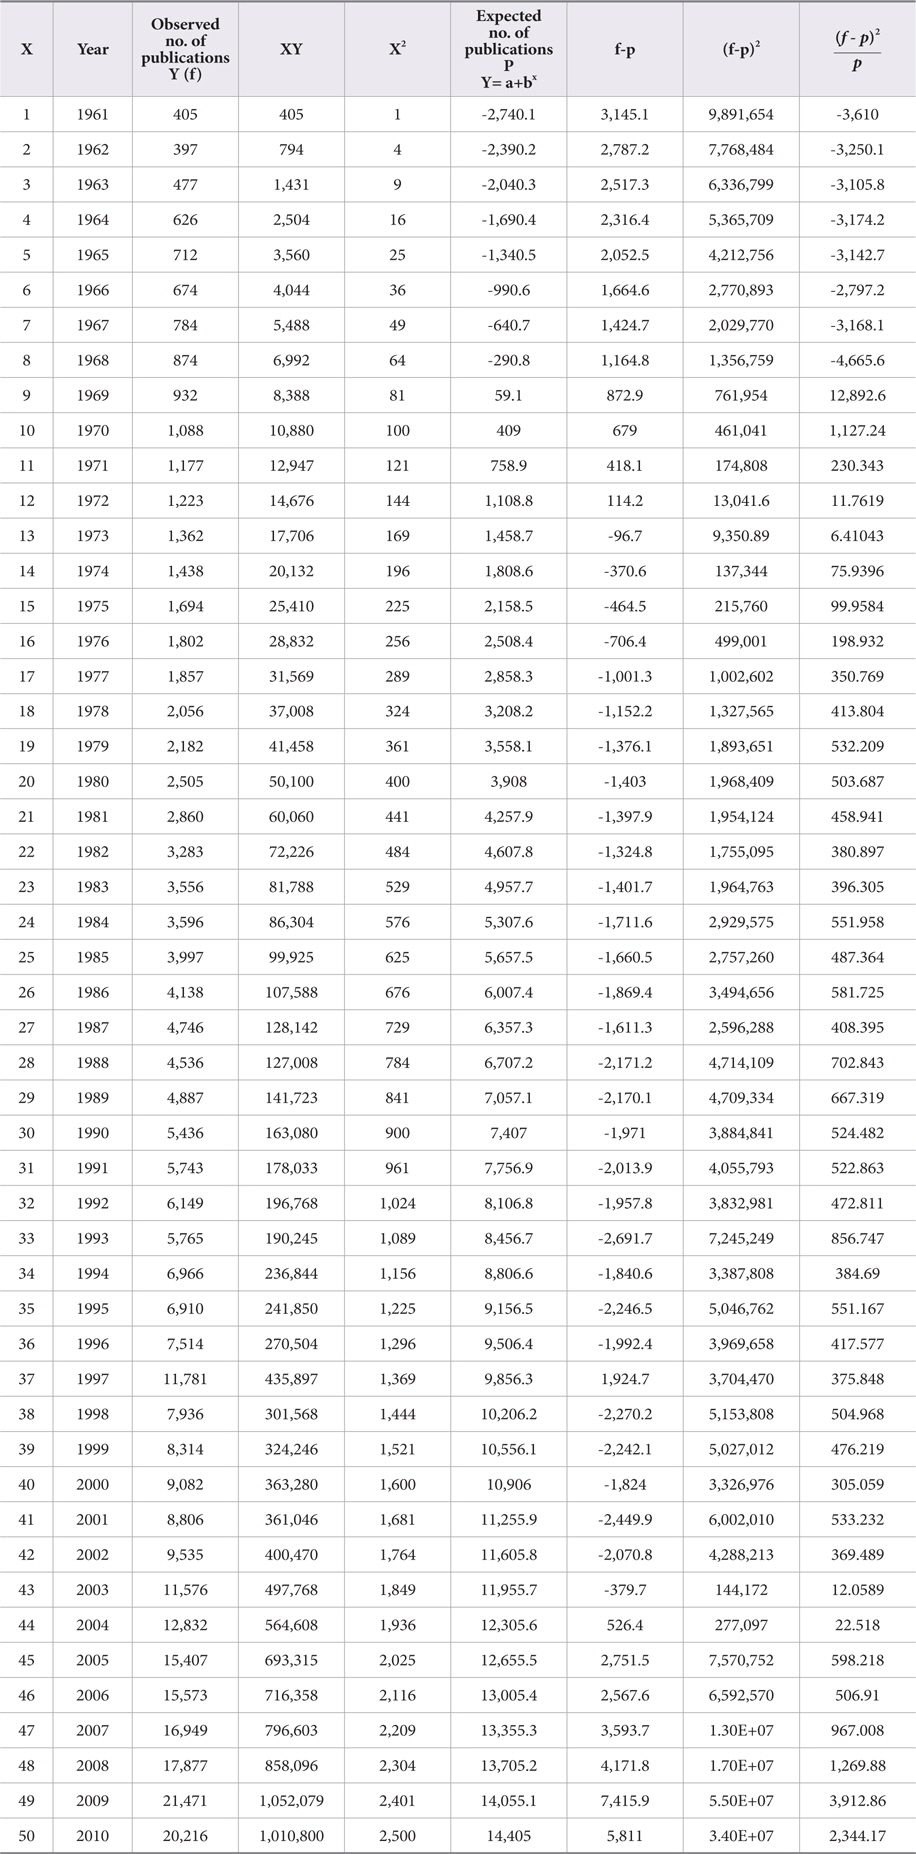
Fit into Linear Growth of Neurology Literature
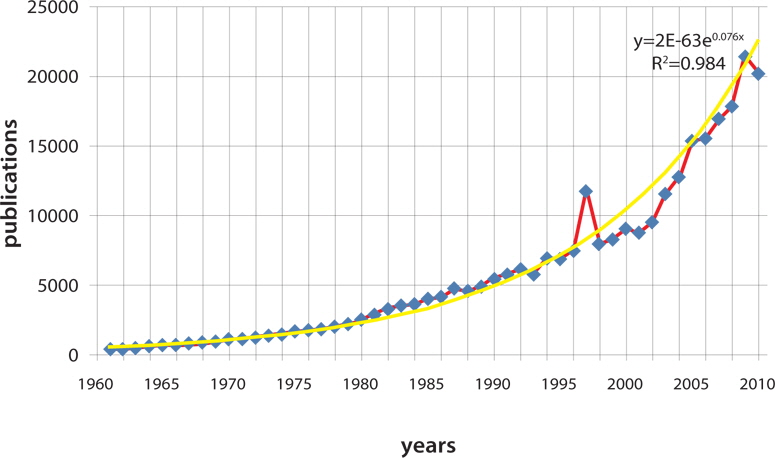
The Exponential Growth Model describes an unlimited exponential growth. This model not only provides a rate of growth (the exponential parameter) but also the rate at which the size of the literature doubles, and its doubling time. The exponential growth has been linked to compound interest.
The growth of publications in the field of neurology literature better fit the Exponential Growth Model.
In order to fit the data to test whether the growth of literature in neurology follows the exponential growth pattern or not, the expected number of publications (y) were computed using the following formula:
Y= K+abx
Where a and b are constants
K= is the asymptote or the upper limit
X is the unit of time
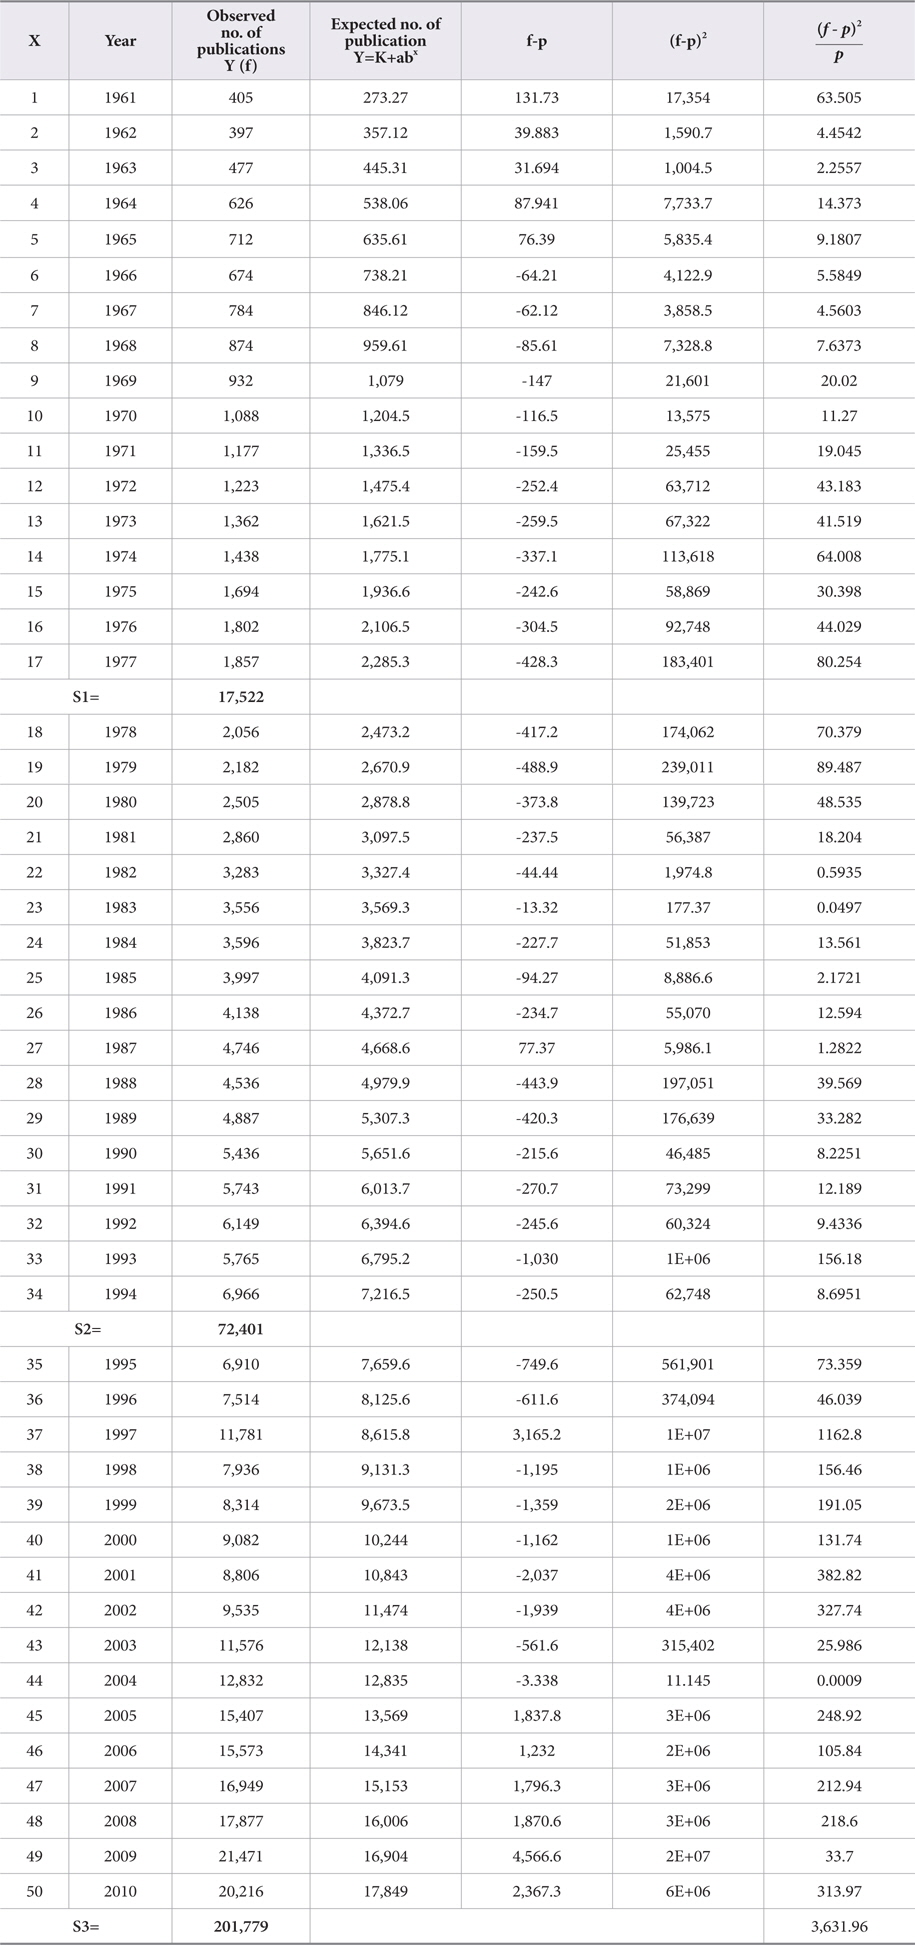
The results of a Chi-Square test of goodness of fit indicated that the calculated Chi-Square value is (X2 = 3,631.96), higher than the critical Chi-Square value of 31.41 for 49 degrees of freedom (
However, the application of the Exponential Growth Model in terms of R2 (0.984) is shown in Fig. 3. The fit statistics indicate that it nearly follows the Exponential Growth Model in the data sets. A graphical presentation of observed and estimated data values obtained is also shown in Fig. 3.
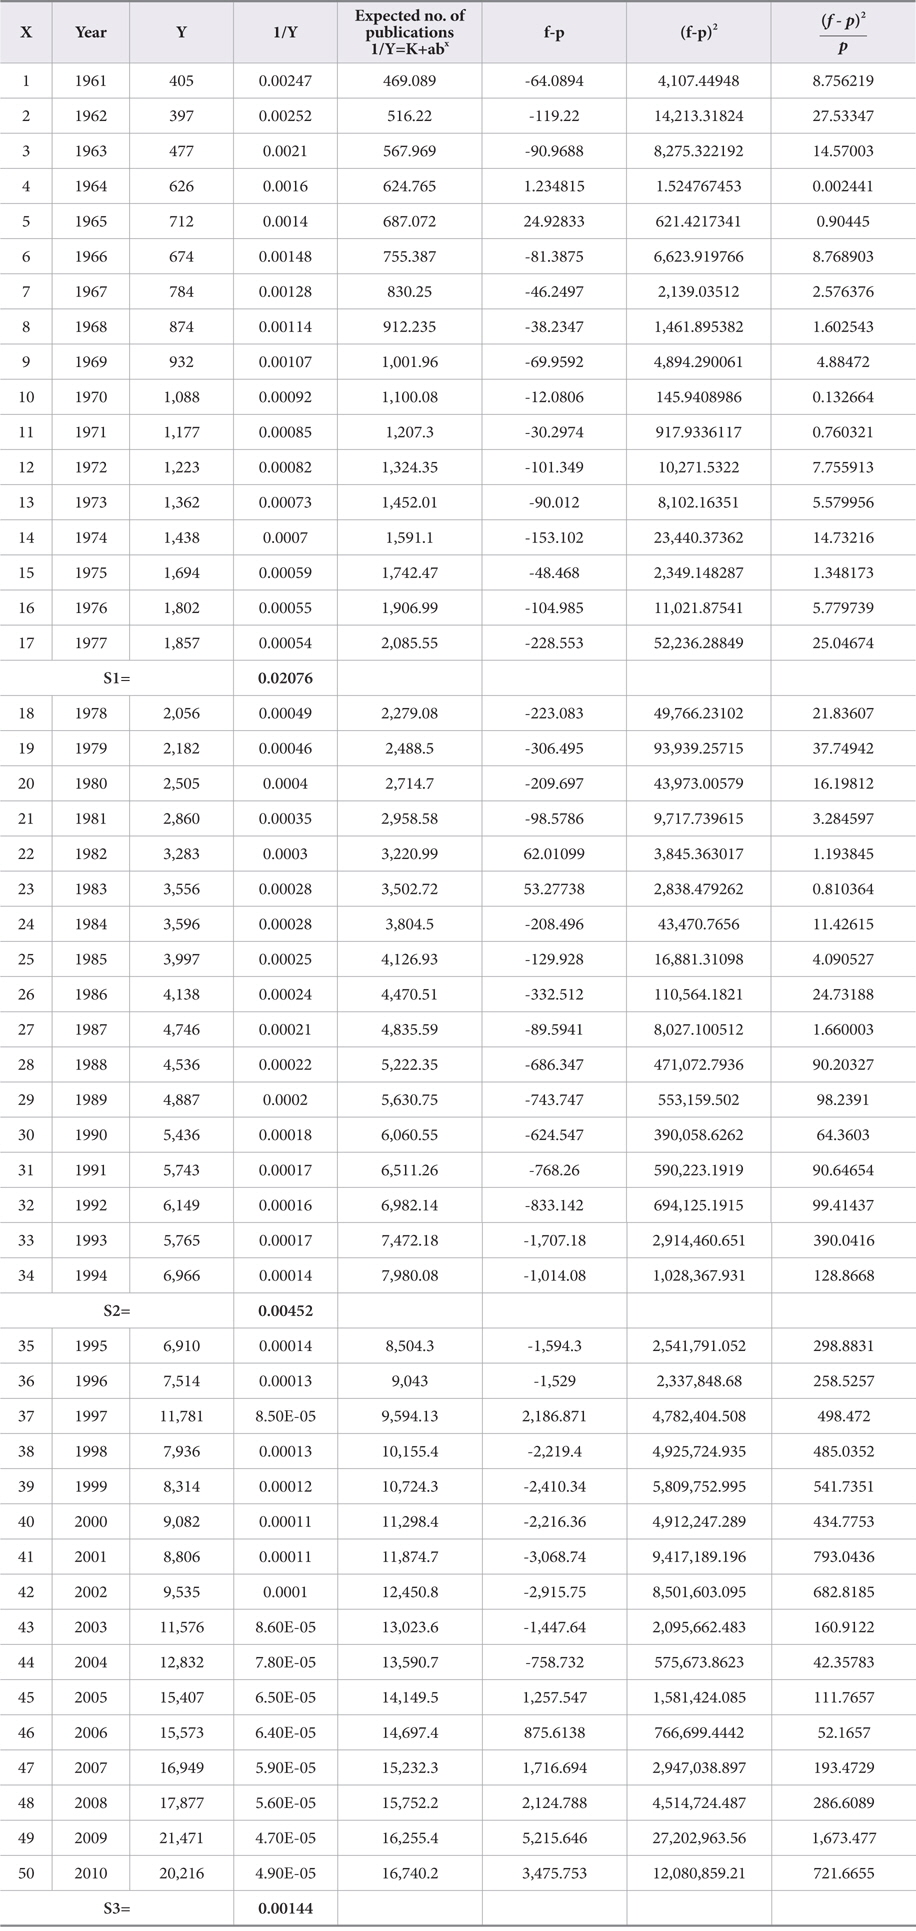
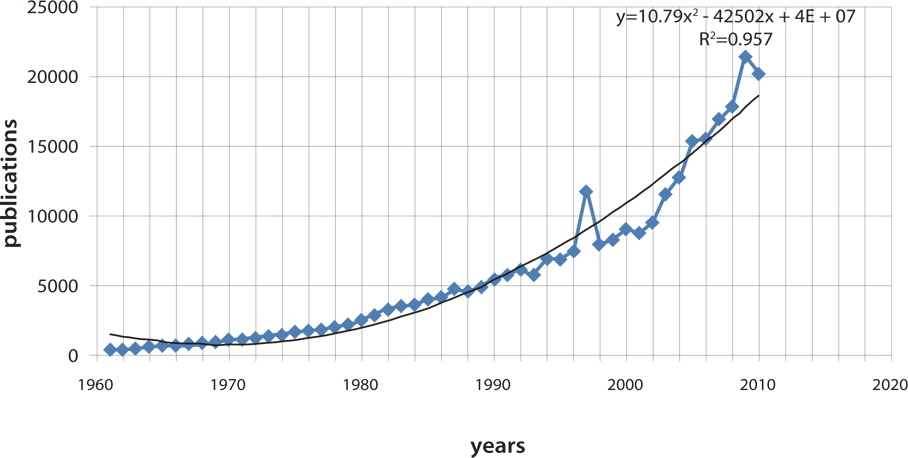
The growth of publications in the field of neurology literature follows the Logistic Growth Model.
In order to fit the data to test whether the growth of literature in neurology follows the logistic growth pattern or not, the expected number of publications (y) were computed using the following formula:
1/Y= K+abx
Where a and b are constants
K= is the asymptote or the upper limit
X is the unit of time
[Table 6.] Fit into Exponential Growth of Neurology Literature

Fit into Exponential Growth of Neurology Literature
The results of the Chi-Square test of goodness of fit show that the calculated Chi-Square value is (X2 = 5,821.7), much higher than the critical Chi-Square value of 31.41 for 49 degrees of freedom (
The Logistic Growth model was also applied for China and India. In both cases the calculated Chi-Square value (X2 = 199.669504 for India, X2 = −89,291.47204 for China) is much greater than the critical Chi-Square value of 31.41 for 49 degrees of freedom (
The bibliometric technique is considered as the most powerful technique for conducting such quantitative studies in this direction. An attempt was made in the present study to measure the trends in various aspects of published literature in the field of neurology literature.
The study is based on 291,702 research papers published between 1961-2010 as reflected in Science Direct, which is one of the most comprehensive databases covering all subjects. The data were collected, tabulated, and analyzed. The study reveals some factual factorial data through bibliometric analysis. Research articles have been analyzed for finding the year wise trend, Relative Growth Rate, Doubling Time, and examining the different types of growth rate models. The outcome of the present study shows that there is a steady growth of publications for world (except 1997) and China, and a fluctuating trend was observed for India during the study period. Averages of 5,720 papers were published per year at the global level, followed by China’s average which is 74 and India’s average at 39. The maximum world contribution is observed during 2009 (20,656 publications) and those of China and India were published during 2010. China took 24 years to achieve double digit numbers of publications, whereas India took twelve years to achieve the same. The research in the field of neurology in India and China has increased over a period of time. The growth of literature in neurology does not follow either the Linear Growth Model or Logistic Growth Model. However, it nearly follows the Exponential Growth Model. The study concludes that there has been a consistent trend towards increased growth of literature in the field of neurology.
[Table 7.] Fit into Logistic Growth of Model of Neurology Literature

Fit into Logistic Growth of Model of Neurology Literature
[Table 8.] Growth Models of Neurology Literature (R2 value)
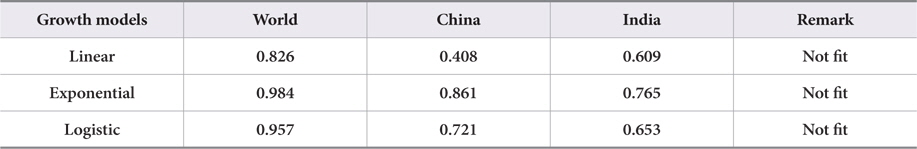
Growth Models of Neurology Literature (R2 value)