An automatic switch developed from fuzzy inference engine is a method that compares the result from 3 clustering methods based on their performance and selects the best performing algorithm to produce visualization result to the users. It is applied in the bibliographic big data retrieval system [1] that accepts user keywords to search for the relationship among bibliographic big data consisting of journal/conference papers.
Existing switching method includes a switch between classifiers [2] that suggests when to combine classifiers and how classifier selection effects the result. But the switch is not able to predict whether a combination of classifier can achieve a better result than individual classifier. A fuzzy inference system is used to assess the performance of a conventional power plant [3] that has a highly flexible algorithm as it can handle fuzzy data, crisp data, and data complexity. But it also uses singular clustering method as it performs better when compared to artificial neural network (ANN)-fuzzy C-mean (FCM) combination as it is able to explore performance patterns and select the better ones. Another fuzzy inference system that speeds up processes is global services of mobile communications churn management by using FCM and adaptive neuro fuzzy inference system [4] but the system only utilizes singular clustering method, and the complexity of the algorithm is high when the input volume is high. In the bibliographic big data retrieval system, to ensure the input volume can produce a result in less than 5 minutes [1], the dataset is generated upon each search command by the user to eliminate unrelated data, keeping the dataset small.
Previously, the bibliographic big data retrieval system only produces the visualization of the combination of both clustering algorithm, regardless whether it produces the best result or not. An automatic switch between ensembles of clustering methods is proposed as a part of a the system by utilizing a fuzzy inference engine as a decision support tool to select the fastest performing clustering algorithm between self-adapted FCM clustering [5], Newman-Girvan clustering algorithm [6], and the combination of both clustering methods [1]. The automatic switch accepts three inputs, which are the number of clusters, number of vertices in each cluster and the time required to complete the clustering process and produces the output in percentage for each clustering result. The clustering algorithms that has the smallest number of clusters and vertices and perform in the fastest time will get highest percentage, and is selected for visualization to the user.
Even though the best way to solve clustering problems is through a mixture of clustering algorithms, a hybrid clustering approach [2-4] requires higher computational complexity yet does not always produce the best result. Therefore the fuzzy inference engine targets to act as an automatic switch that compares the performance of each clustering algorithm where the clustering with the best performance will be selected for visualization to users. It aims to realize the best clustering performance with the reduction of computational complexity from
The automatic switch is developed using jFuzzyLogic [7, 8], a fuzzy logic controller written in Java and the experiments are carried out in Eclipse IDE 4.2.2 [9] using Dell Latitude E5430 laptop with Intel Core i5-3210M at 2.50 GHz. The switch accepts 3 input variables for each clustering result and the values of the input variables from the clustering result are fuzzified according to the membership function, and then evaluated by 27 fuzzy inference rules. The evaluation result is defuzzified to get a crisp percentage output. The percentage output result of the fuzzy inference engine will determine which clustering method will be shown to the users in interactive visualization.
The dataset preparation from the result of three clustering methods are presented in Section 2. The application of fuzzy inference engine as an automatic switch between 3 clustering algorithms using jFuzzyLogic is presented in Section 3. Section 4 discusses the automatic switch experiment on clustering result and Section 5 describes the user feedback evaluation of the system.
2. Clustering Result of the Self-Adapted FCM, Newman-Girvan Algorithm, and the Combination
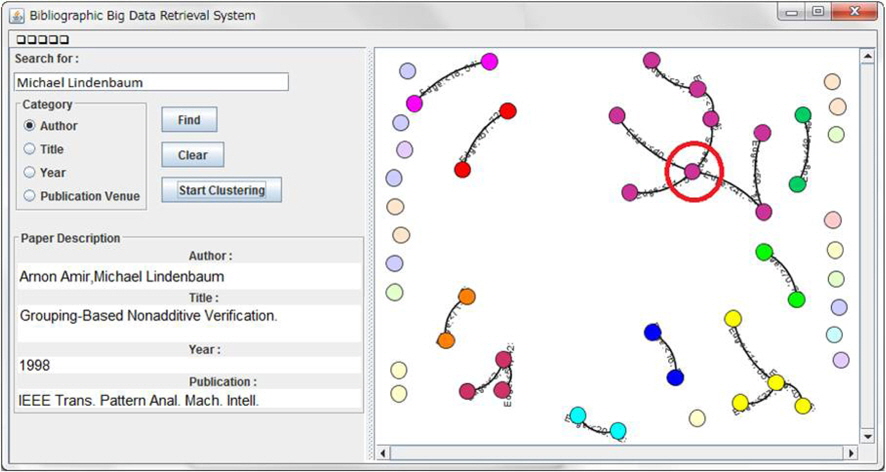
The bibliographic big data retrieval system is developed to produce visualization of ensemble clustering result to the users. The systems user interface design is shown in Figure 1. A user will enter a keyword in the search box, select a category between paper author, title, year and publication venue, and click the ‘Find’ button. The system will search for related information in the MySQL database, and display the unclustered result on the right panel. Next, the user clicks the ‘Start Clustering’ button and the clustering process will be executed and by utilizing the automatic switch, the clustering with the best performance will be displayed to the user. To give users more information on each paper, when the user clicks on each vertex, the information of the paper will be displayed in the ‘Paper Description’ panel on the bottom left of the user interface.
In Figure 1, the keyword entered by the user is ‘Michael Lindenbaum’ for category ‘Author.’ The result consists of 86 papers that is written by the author. Out of 86 papers, there are 32 connections among the papers. When the node is clicked as shown in the red circle the information regarding the node is displayed in the ‘Paper Description’ box. Based on the visualization, it can be seen that the node has 4 connections with other nodes. It shows that this paper is one of the author’s important paper or key paper as it has many other papers that cites it.
To find relationship among bibliographic big data, the system uses a hybrid of clustering ensembles to improve clustering performance and to overcome the issue of weakness and strength of individual clustering algorithm. There are three types of clustering algorithms used in the system and results from the 3 clustering algorithms from the system is used as input for the automatic switch.
There is no absolute best criterion which would be independent of the final aim of the clustering [10]. To find the best performing clustering algorithm, several criteria have been determined that fulfills the objective of the target application. In the bibliographic big data retrieval system, to help users find the information they are looking for, the clustering result must be able to converge several important target papers that fulfills the users’ search criteria. The time taken to produce the result should be less than 5 minutes [1]. Therefore, three criteria that can determine the desirable clustering performance are the time required to complete the clustering in seconds, number of related clusters found, and the total number of vertices found in the clusters.
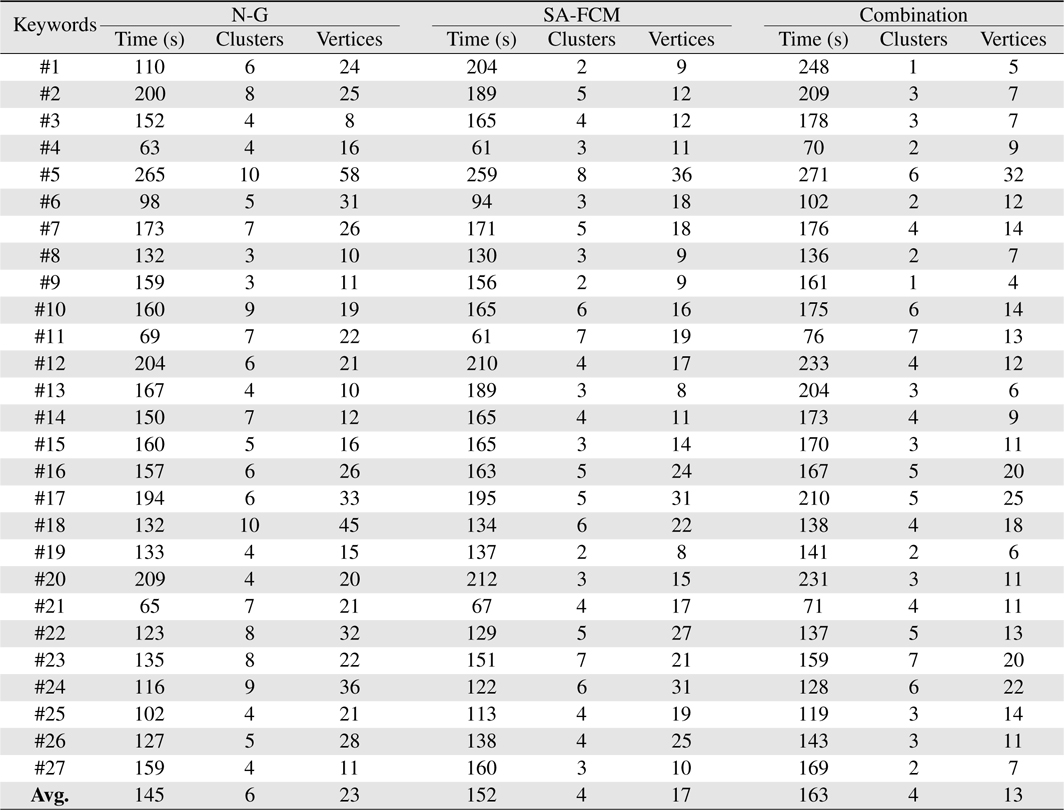
Table 1 shows the result for all three clustering algorithms that contains the 3 information used as input variables for the automatic switch.
[Table 1.] Clustering result from bibliographic big data retrieval system
Clustering result from bibliographic big data retrieval system
3. Automatic Switch between 3 Clustering Algorithms based on Fuzzy Inference
A fuzzy inference engine [11-13] is developed using jFuzzy-Logic, a fuzzy logic controller written in Java [7, 8]. jFuzzy-Logic is chosen to be the fuzzy language controller in the bibliographic big data retrieval system. jFuzzyLogic follows the standard for fuzzy control language and it provides an application programming interface and an Eclipse [9] plugin that simplifies the writing and testing of the FCL codes. The output generated by the fuzzy inference engine can easily be integrated into the bibliographic big data retrieval system as both are written in Java language.
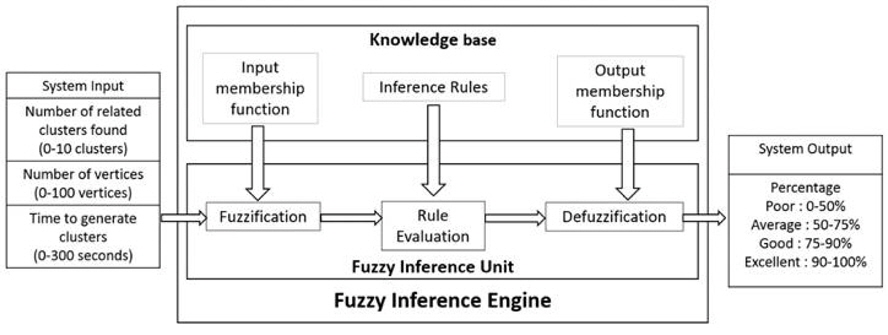
Figure 2 describes the layout of the engine as an automatic switch. System inputs consists of three input variables, the number of related clusters (1-10 clusters), the total number of vertices in the related clusters (1-100 vertices), and the time required to get the result of the clustering process (1-300 seconds). The input variables are first fuzzified according to the input membership functions, then they will be evaluated by the fuzzy inference rules. Next, they will be defuzzify according to the output membership function that resulted in percentage (0%-100%) as the fuzzy inference output.
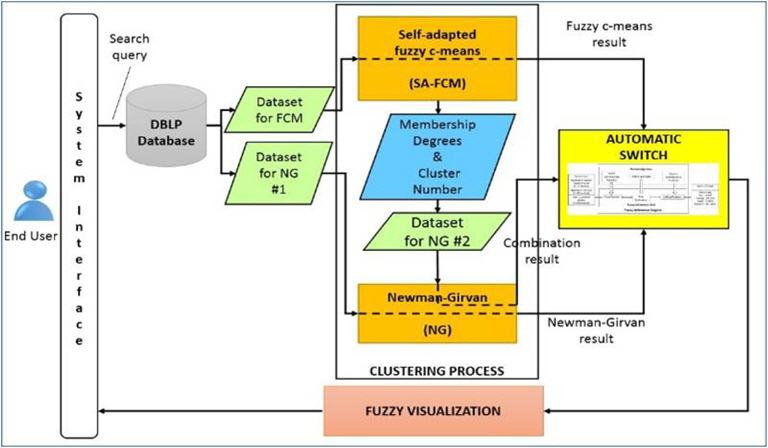
The system architecture of the bibliographic big data retrieval system is shown in Figure 3, where the automatic switch is situated between the clustering processes and the fuzzy visualization process. It shows that the automatic switch plays an important role to decide which clustering algorithms should be used in the interactive visualization to the user.
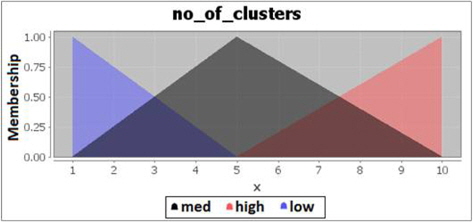
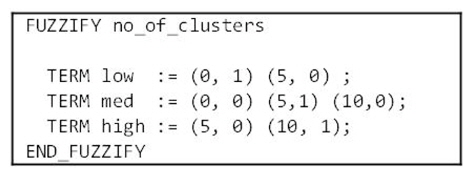
The fuzzification of the number of clusters is divided into 3 categories. Number of clusters is considered low if the amount is between 1-5 clusters, medium if it is between 1-10 clusters and high if 5-10 clusters are found. The fuzzification code for the fuzzy control language is described in Figure 4.
The membership degrees graph of the number of clusters is shown in Figure 5.
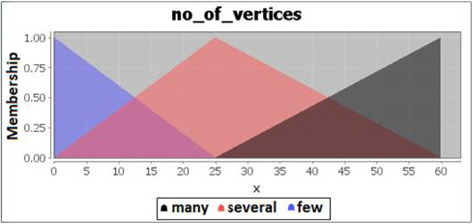
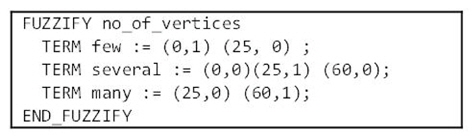
The fuzzification of the total number of vertices is also divided into 3 categories. The number of vertices found is considered few if the amount is between 1-25 vertices, several if the amount is between 1-60 vertices, and many if the amount is between 25-60 vertices. The fuzzification code for number of vertices is shown in Figure 6 and the membership degrees graph for vertices is shown is Figure 7.
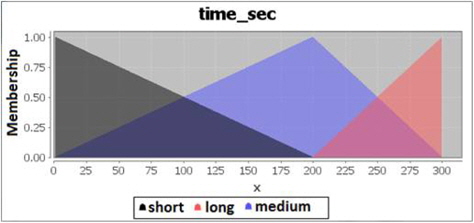
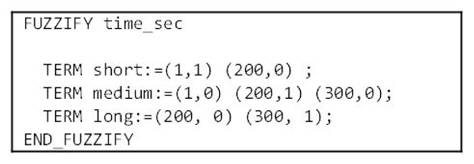
For time required to complete the clustering process, there are also 3 categories to represent them. Time is considered short if it takes between 1 to 200 seconds to complete the process, medium if it is between 1-300 seconds, and it is considered long if it takes between 200-300 seconds to complete the clustering process. The fuzzification code for time is shown in Figure 8 and the membership graph is shown in Figure 9.
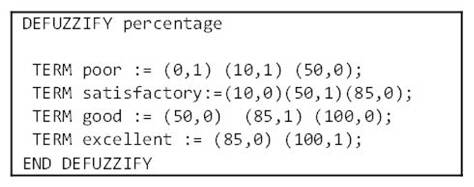
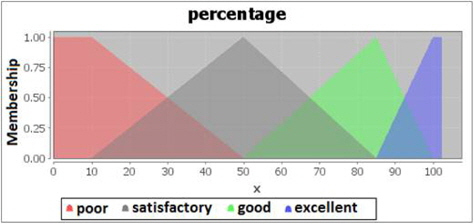
The defuzzification process are performed to get a non-fuzzy value that best represents the possibility distribution of an inferred fuzzy control action. The defuzzified output will be in percentage, where the clustering result with the highest percentage will be selected for visualization to the end user. There are four categories for the percentage output, ranging from poor, average, good to excellent. Poor percentage ranges from 0%-50%, average percentage ranges from 10%-85%, good percentage ranges from 50%-100% and excellent percentage ranges from 85%-100%. The defuzzification code for percentage control is shown in Figure 10 and the membership degree graph for percentage is shown in Figure 11.
The defuzzification strategy used in the proposed method is the center of gravity or centroid method. The strategy is the most common and physically appealing of all the defuzzification methods[14, 15] It is given by the algebraic expression where

There is no systematic procedure for choosing a good defuzzification strategy and it depends on the properties of the application. Therefore, the center of gravity strategy is chosen due to its computational simplicity where it does not require complex computation that may lead to more time. Since the end result which is the visualization of bibliographic data search result needs to be produced in less than 5 minutes, this is an important criteria to keep the calculation process time as short as possible.
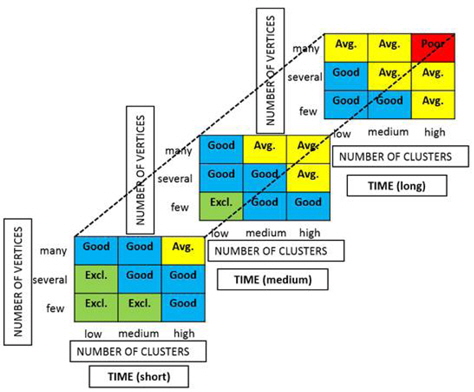
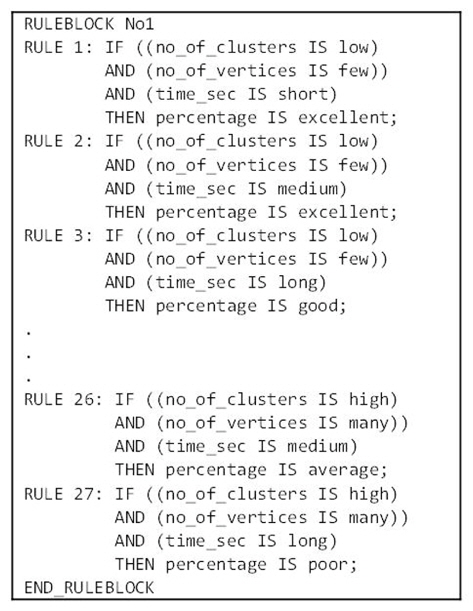
A fuzzy associative matrix is developed to cover every possible outcome from the clustering result. Figure 12 shows the fuzzy associative matrix for the clustering results with three inputs, number of clusters, number of vertices and time. Inside each box is written a label of the automatic switch output. In the automatic switch, there are 27 possible rules corresponding to the 27 boxes in the matrix.
Figure 13 describes the rule block that consists 27 inference rules for the automatic switch in fuzzy language control codes.
4. Experiment of Automatic Switching on Clustering Results
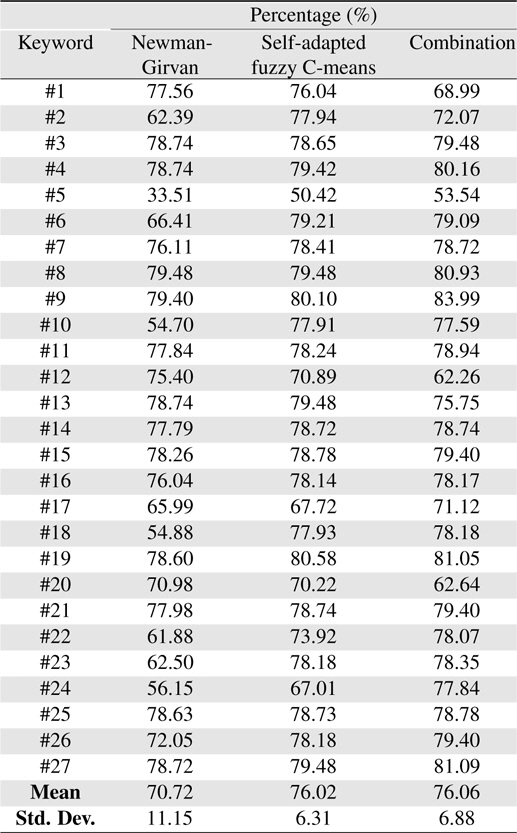
The percentage result from the automatic switch is shown in Table 2. Out of the three clustering result, the combination of both clustering algorithms has the highest mean percentage of 76.06%, as opposed to 76.02% for self-adapted FCM algorithm and 70.72% for Newman-Girvan algorithm. It shows that on average, the combination always perform better than the individual clustering algorithms. This can be seen from the average number of clusters and vertices produced by each clustering algorithm as shown on Table 1, where the combination always generates the least number of clusters and vertices as opposed to the individual clustering algorithms, in under 5 minutes.
[Table 2.] Automatic switch result ? percentage output

Automatic switch result ? percentage output
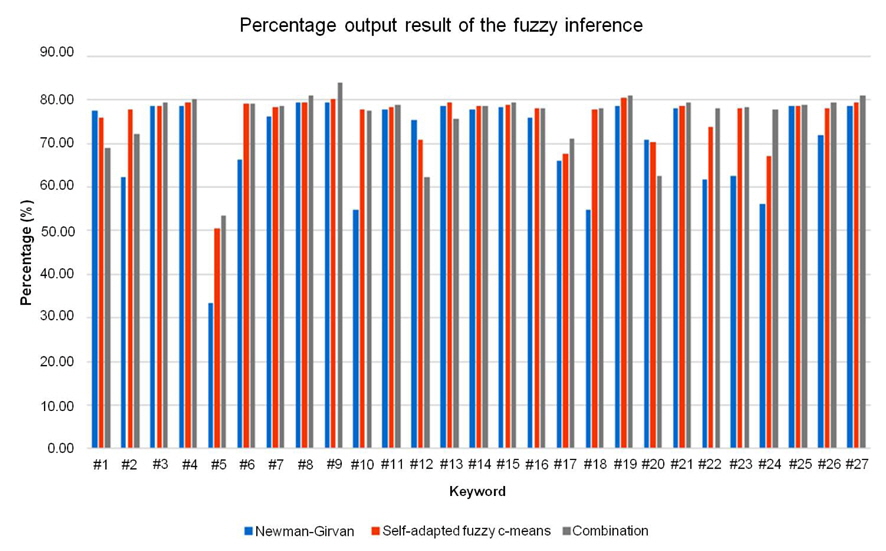
The self-adapted FCM has the smallest standard deviation of 6.31% which means that its performance does not vary greatly as opposed to the Newman-Girvan and the combination algorithm. This is because the self-adapted FCM is more flexible than the crisp Newman-Girvan algorithm due to its fuzzy properties. Newman-Girvan algorithm has the highest standard deviation of 11.151%. The average percentage for Newman-Girvan is 70.72%, but it performs poorly for keyword #5 with 33.51%. For this keyword, Newman-Girvan takes 265 seconds to find 58 vertices and 10 clusters. Based on the fuzzy inference rules of the automatic switch, a low percentage is given to the Newman-Girvan algorithm as it does not favor the users of the system who requires more time to examine each of the 58 vertices for their desired papers. The combination sits in the middle with a standard deviation of 6.88%. The performance of the combination varies greater than the self-adapted FCM because it combines both clustering algorithms therefore also inherits their less than efficient performance.
Based on the bar chart for percentage shown in Figure 14, the combination algorithm performance shown in grey line performs better in most search cases. It received the highest percentage in 20 out of 27 search cases with the highest percentage of 83.99% for keyword #9. For keyword #9, the combination algorithm successfully gathered 4 target papers in one cluster in 161 seconds. The few number of papers, and the short time to produce the result gives the combination algorithm the highest percentage as compared to the other 2 clustering algorithms. The combination algorithm do not get the highest percentage in 7 cases (keywords #1, #2, #6, #10, #12, #13, and #20) as the keywords return a larger search result compared to the other keywords thus more time are required to perform the clustering process on them. According to the fuzzy inference rules, if the time taken to produce the clustering result is long (200-300 seconds), the percentage is will not be in ‘Excellent’ category. Therefore, the application of the automatic switch will be able to compare the performance and select the best performing algorithm each time a search is performed.
The Newman-Girvan algorithm’s computable complexity is O(n) and the self-adapted FCM algorithm has a computable complexity of
5. User-Based Evaluation for the Bibliographic Big Data Retrieval System
To evaluate the system’s usability, user-based evaluation method is used where the system is tested by selecting 18 participants to perform a set of pre-determined tasks on the system prototype. A feedback questionnaire is given to the participants after the tasks have been performed on the system prototype and the participants have to fill in the questionnaire based on their opinion of the system. This method is used as it is the most realistic estimate of usability [16].
A 16-question feedback questionnaires focusing on bibliographic visualization tool objectives is designed to evaluate the usability of the system. There are 4 categories covered in the questionnaire, which are the content organization, navigation, graphical user interface, and effectiveness and performance of the system.
Questions for evaluating the system’s usability are:
1) Content organization
– Displays complete bibliographic entry – Displays chronology of paper on request – Displays influence of article on other articles – Displays publication information by fields of knowledge – Displays strength of relationship between articles – Shows relationship between research areas
2) Navigation
– Provides exploration of activities of a particular author – Filters information by user’s request – Offers comfortable navigation methods – Provides wide range of options to explore different part of bibliographic data
3) Effectiveness and performance
– Effectively express relationships contained in bibliographic data – Search result is visualized in 5 minutes or less – Provides easy understanding of relationship between researchers – Provides user with good control over the information to be displayed
4) Graphical user interface
– Good graphical design – Attractive presentation
Five options are given to the participants for each question. The participants will choose one option from 1=Highly Dissatisfied, 2=Dissatisfied, 3=Neutral, 4=Satisfied, to 5=Highly Satisfied. The feedback result is analyzed using WEBUSE [17], a website usability evaluation tool. The answer options and their corresponding merits are shown in Table 3.
[Table 3.] Answer option for feedback questionnaire and corresponding merits

Answer option for feedback questionnaire and corresponding merits
Usability point for a category, x, is defined in

where
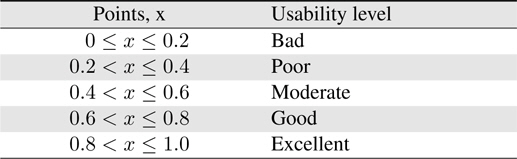
Table 4 shows the usability levels and the corresponding usability points.
[Table 4.] Usability points and corresponding usability levels

Usability points and corresponding usability levels
A total number of 18 participants have volunteered to test the prototype of the bibliographic big data retrieval system where 44.4% are males and 55.6% are female participants. 22.2% of the participants are undergraduate students and 77.8% are postgraduate students with 38.9% have between 6 and 10 years of computer experience, and 61.1% have more than 10 years of computer experience. Only 16.7% of the participants have used another bibliographic visualization tool before taking part in this survey.
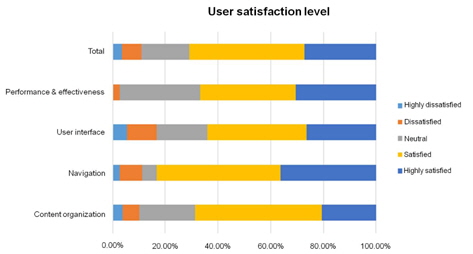
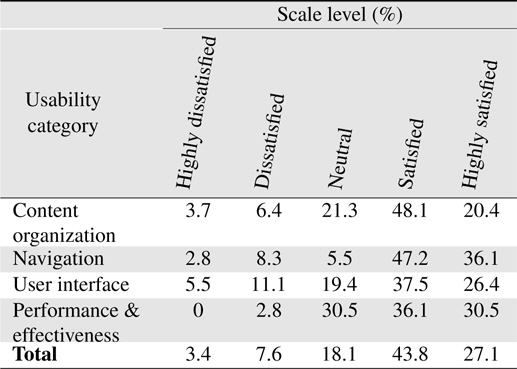
Table 5 shows a summary of user satisfaction level in 4 categories of usability from content organization, navigation, user interface design, and performance and effectiveness. From the satisfaction scale level, users are most satisfied in the navigation aspect of the system with 36.1% of participants highly satisfied with the navigation styles that the system offers. The bar chart for the user satisfaction level is shown in Figure 15. It shows that the user satisfaction level mainly falls in the ‘Satisfied’ category as indicated in yellow.
[Table 5.] System evaluation result by participants
System evaluation result by participants
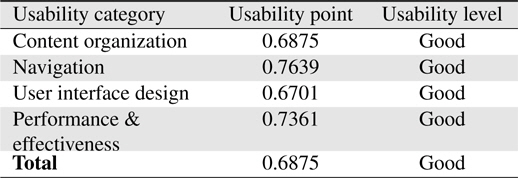
Table 6 shows a summary of usability point and usability level based on each category. From the overall usability level, it can be concluded that the system is accepted as “Good” based on the usability scale. System’s navigation and performance receives a high point of 0.7639 and 0.7361 respectively. It shows that the users are satisfied with the system’s navigation and performance but improvements are necessary to increase the usability level from ‘Good’ to ‘Excellent.’ The system’s content organization and user interface design receives usability points less than 0.7 therefore even though the user is somewhat satisfied with these aspects of the system, more improvements are needed to be done to increase users’ satisfactions on the usability of the system as a whole.
[Table 6.] Usability level and usability points for each category

Usability level and usability points for each category
Some comments given by participants to improve the content organization is that the system should not only give the best clustering performance but also shows the number of citation of evey authors or papers selected by users. It is an important information that gives extra weight to every author and paper nodes that they wish to explore.
Other comments state that the system should offer the users an option to control the importance of their search, whether they want only highly related information to be shown or to include a bigger search result that shows all related results, whether they are highly related or somewhat related to the input information.
Obtaining multiple levels of useful information from large amounts of data requires scalable algorithms to produce timely results [18]. Current algorithms are inefficient in terms of big data analysis. the bigger the data gets the less efficient each algorithm will perform, and leads to higher computational complexity.
To increase the performance of clustering algorithms to process big data, efficient tools and technologies are essential to process such data. Currently the dataset used in the bibliographic big data retrieval system is stored in MySQL 5.6, an open source relational database management system. The issue with current database while it is suitable for research purposes, to ensure faster and more efficient service, a database specifically designed for big data is preferable.
The three criteria that determine the desirable clustering performance in the bibliographic big data retrieval system are the time required to complete the clustering in seconds, number of related clusters found, and the total number of vertices found in the clusters. The automatic switch accepts these three criteria as its input and the experiment is carried out in Eclipse IDE 4.2.2, connected to MySQL 5.6 database that stores the bibliographic big data, using Dell Latitude E5430 laptop with Intel (R) Core (TM) i5-3210M at 2.50 GHz. The experimental result demonstrates that the combination of both clustering algorithms is selected as the best performing algorithm in 20 out of 27 cases with the highest percentage of 83.99%, completed the process in 161 seconds. The self-adapted FCM is selected as the best performing clustering algorithm in 4 search cases with the highest percentage at 80.58%, completed in 137 seconds and Newman-Girvan algorithm is selected in 3 search cases with the highest percentage at 79.46% in 132 seconds. By applying the automatic switch in the bibliographic big data retrieval system, the best performing algorithm can be determined in every search case executed by the users. The computable complexity of the self-adapted FCM and the combination algorithm is O(n3), while Newman-Girvan is O(n). For every search cases that Newman-Girvan is selected as the best performing algorithm, the computational complexity of the clustering process is reduced as it will only produce the visualization result of Newman-Girvan clustering result to the users. The self-adapted fuzzy c-means and the Newman-Girvan algorithm are selected to be combined because their features complement each other and they are suitable for bibliographic big data retrieval application[1]. The combination algorithms performance is compared to the two singular clustering algorithms using the automatic switch to ensure that the best performing algorithm is chosen for each search case. Other types of clustering methods can also be considered to be applied to the automatic switch, with little modification to fulfill the purpose of the application target. The feedback survey shows the overall level of system usability is good and acceptable to users. Users are satisfied with the navigation, effectiveness, and performance of the system but some improvements needs to be done to increase the system’s usability especially in terms of content organization and user interface design.
The automatic switch is incorporated into the bibliographic big data retrieval system that focuses on visualization of fuzzy relationship using hybrid approach combining the salf-adapted FCM and Newman-Girvan algorithm. The system is currently being developed and improved. Future works includes:
1) emphasizing the visualization of fuzzy relationship to differentiate from crisp clustering relationship to effectively display the fuzzy visualization result to the users; and 2) planning to be released to the public through the Internet.