Graphene has been attracting a great deal of attention because of its unique and advantageous properties such as high electrical [1,2] and thermal conductivity [3], good mechanical strength [4,5], large specific surface area [6], and extreme carrier mobility [7]. The excellent electronic properties of graphene have driven extensive studies on its application in field effect transistors [8], memory devices [9], transparent conductive films [10], and so on. Furthermore, this novel nano-carbon material can also be used in composites [11-13], energy storage media [6,14,15], gas sensors [16], and bio sensors [17] owing to its superb structural, optical, and mechanical properties.
Graphene has been synthesized using various methods, such as mechanical exfoliation [18], epitaxial growth on SiC substrate [19], chemical vapor deposition (CVD) [20-22], and chemical oxidation/reduction [23-26]. Mechanical exfoliation and epitaxial growth of graphene have the advantage of synthesizing high quality graphene, but large scale production of the graphene using these methods is quite a challenge. Although CVD makes it possible to synthesize large-sized and high quality graphene sheets on inexpensive substrates such as Cu [20] and Ni [21,22], the application of CVD-grown graphene to bulk-composite materials is not straightforward. On the other hand, the method of chemical exfoliation makes it possible to produce graphene in large quantity. Though graphene prepared by reducing graphene oxide (GO) in general has oxygen functional groups, such as hydroxyl (-OH) and carboxyl (-COOH) groups, and atomic structure defects [23,24], this method is getting popular due to its suitability for the mass production of large-sized graphene using a low cost process [26,27].
For the present study, we prepared GO and reduced graphene oxide (rGO) via solution based chemical treatments; we then systematically studied the structural properties of graphite, GO, and rGO including interlayer distance, crystallinity, and elemental concentration. GO was prepared by modified Hummers’ method using an oxidation agent such as potassium permanganate, sulfuric acid, or sodium nitrate. Then, in order to find an optimum reducing agent in terms of high crystallinity and low oxygen concentration in rGO, rGO was prepared using various reducing agents including hydrazine hydrate (N2H4·H2O), ammonia borane (NH3BH3), and urea ((NH2)2CO).
GO was prepared from graphite flakes by the modified Hummers’ method using sulfuric acid (H2SO4), sodium nitrate (NaNO3), and potassium permanganate (KMnO4) [28]. Two gram of graphite was mixed with 100 mL of 98% H2SO4 and 1 g of NaNO3; this was followed by stirring for 30 min at room temperature. Mixture was kept below 20℃ in an icebath; 8 g of KMnO4 was slowly added to the mixture. The mixture was heated at 45℃ for 2 h with stirring. 150 mL of deionized water was slowly added to the mixture in the ice-bath to prevent any rapid increase of temperature. After 2 h, 300 mL of deionized water and 20 mL of H2O2 were added to remove metallic ions and to stop the oxidation process, causing the color of the solution to change from brown to yellow. After 24 h, the resultant suspension was filtered and washed over a cellulose acetate (CA) membrane with a 0.45 μm pore size. GO cake was then dried in an oven at 50℃ for 24 h.
0.4 g of GO powder was dispersed in 400 mL of deionized water (0.1 g/mL) and exfoliated by bath-type sonication for 2 h with a sonication power of 100 W. Then, the GO-dispersed solution was reduced using various reducing agents, as follows: (1) 10 mL of hydrazine hydrate (N2H2·H2O) at 95℃ for 24 h; (2) 1 g of ammonia borane (NH3BH3) at 80℃ for 24 h; and (3) 1.5 g of urea (CO(NH2)2) at 95℃ for 24 h. Since the melting point of ammonia borane (104℃) is lower than those of hydrazine hydrate (114℃) and urea (133℃), the reduction using ammonia borane was carried out at a lower temperature. The final suspension was filtered and washed over a CA membrane with a 0.2 μm pore size. Finally, rGO cake was dried in the oven at 50℃ for 24 h.
Powder X-ray diffraction (XRD) patterns were acquired using a Smart Lab (Rigaku, Tokyo, Japan) with Cu-Kα radiation. The operating voltage and current were 45 kV and 200 mA, respectively. The Raman spectra were recorded in the range of 1000 to 2000 cm−1 on a LabRAM HR (Horiba, Kyoto, Japan) using a 514 nm argon laser. The XRD and Raman samples were prepared by dispersing graphite, GO, and rGO powders in distilled water to form a homogeneous suspension. The suspension was dropped onto a SiO2/Si substrate for analysis. The microstructure was investigated using transmission electron microscopy (TEM) (Tecnai F20, FEI) equipped with an electron energy loss spectroscopy (EELS) module (Quantum 963, Gatan, Pleasanton, CA, USA). For the preparation of the TEM samples, we dispersed graphite powder, GO, and rGO powders in ethanol. Then, the solution was dropped onto a 300-mesh lacey-carbon coated Cu-grid (Ted pella, Redding, CA, USA) for observation. Selected area diffraction (SAD) and EELS were performed with TEM investigation. EELS spectra were obtained with an energy dispersion of 0.25 eV/channel, a convergence angle (α) of 10 mrad, and a collection angle (β) of 12.3 mrad.
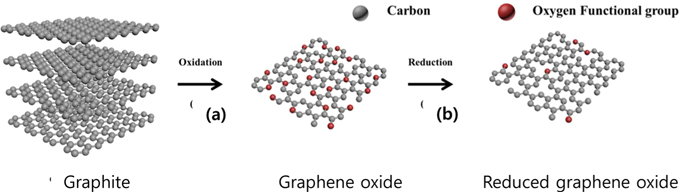
Overall experiment processes are shown in Fig. 1. The pristine graphite was oxidized using H2SO4, NaNO3, and KMnO4. It is well known that a graphite layer can be functionalized with hydroxyl (-OH) and carboxyl (-COOH) functional groups (Fig. 1a) through oxidation [23,29]. These oxygen containing functional groups increase the interlayer distance of graphite [30]. In a hexagonal structure, the interlayers of graphite (c-axis) are bound by van der Waals force, which is a binding energy weaker than that of a covalent bond. Therefore, the graphite layers can be easily exfoliated. However, the graphene loses its intrinsic properties such as high electrical and thermal conductivity when oxidized; oxidation is caused by oxygen functional groups and defects. A reduction process is thus needed to remove the oxygen functional groups and to recover the superior properties using a reducing agent (Fig. 1b) [29]. Various reducing agents were tested and compared in the present study with a viewpoint of improving the crystallinity and minimizing the oxygen content after the reduction process.
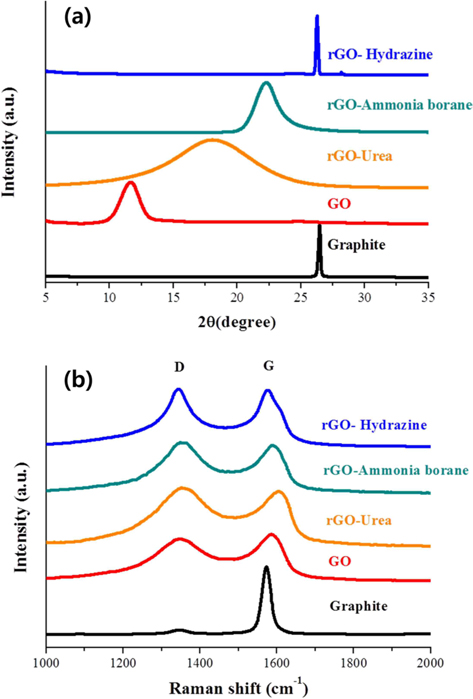
Powder XRD was used to investigate the variation of interlayer distance with the chemical treatments. Fig. 2a shows the XRD patterns of the graphite, GO, and rGOs. The reduction process was carried out using three different reducing agents: hydrazine hydrate, ammonia borane, and urea. The 2θ peak of graphite powder appeared at 26.44°, indicating that the d-spacing was 3.37 Å. After chemical oxidation and exfoliation, however, a strong peak appeared at 2θ = 11.64°, corresponding to an interlayer spacing of about 7.597 Å, which is much larger than the interlayer spacing of graphite powder (3.37 Å). This increased layer distance is attributed to the fully oxidized state and intercalation of oxygen functional groups/water molecules between the graphene layers [29,31]. On the other hand, the peak of rGO showed up-shifts to higher angles of 2θ = 18.04°, 22.26°, and 26.25° when the reduction was carried out using urea, ammonia borane, and hydrazine hydrate, respectively. The corresponding interlayer distances are 4.90, 3.99, and 3.39 Å, respectively. This indicates that the reduction process eliminates the oxygen functional groups/intercalated molecules, resulting in the decreased interlayer distance. Also found in these XRD patterns is that the degree of reduction is strongly dependent on the kind of reducing agent used. Hydrazine was found to be very useful for the reduction of GO. The full width at half maximum and the location of the rGO peak obtained using hydrazine were very similar to those of the graphite peak. In contrast, the locations of peaks observed for the ammonia borane- and urea-based rGOs were still down-shifted compared with that of graphite, although we tried to optimize the experimental conditions for reduction. Besides this, the rGO prepared using urea shows quite a broad peak, indicating non-uniform d-spacing.
The dependence of the reducing agent was also found in the Raman spectra. Raman spectroscopy is one of the most common analysis techniques used to characterize the structure and quality of nano-carbon materials [32-34]. The Raman spectra obtained from graphite, GO, and rGOs on SiO2/Si substrate are presented in Fig. 2b. The Raman spectrum of pristine graphite displays two peaks at 1346 cm−1 and 1573 cm−1. The first peak is called the D-band and is associated with disordered structures; the second peak is called the G-band and is related to the E2g vibration mode of the sp2 carbon domains. The intensity ratio of the D-band to the G-band peaks (ID/IG) has been used to evaluate the quality of graphene [33]. The oxidation of graphite was found to markedly increase the intensity of the D-band and to broaden the G-band peak. The ID/IG ratio of GO is calculated and found to be 0.9, which is much higher than that of graphite (0.06), indicating that the oxidation process caused the formation of severely disordered structure in the graphene layers. Furthermore, the reduction process was found to further increase the intensity ratio. The ID/IG ratios of rGO prepared using urea, ammonia borane, and hydrazine hydrate are 1.06, 1.06, and 1.02, respectively. Therefore, the ID/IG ratios of the rGOs are much larger than that of pristine graphite. This means that although the graphene sheets undergo annealing during the reduction process [35], the oxidation and reduction processes for the preparation of rGO cause the formation of a disordered structure. It has been reported that the G-band is shifted to a higher frequency (blue shift) during the oxidation of graphite and, then, the reduction shifts the G-band back to its original position in graphite [35]. We have also observed that the G-band was shifted to a higher frequency (blue-shift) by the oxidation process. However, among our reduction experiments using three different reducing agents, only hydrazine-based rGO showed a back-shift of the G-band peak. It is therefore believed that the degree of graphitization in rGO is strongly dependent on the kind of reducing agent.
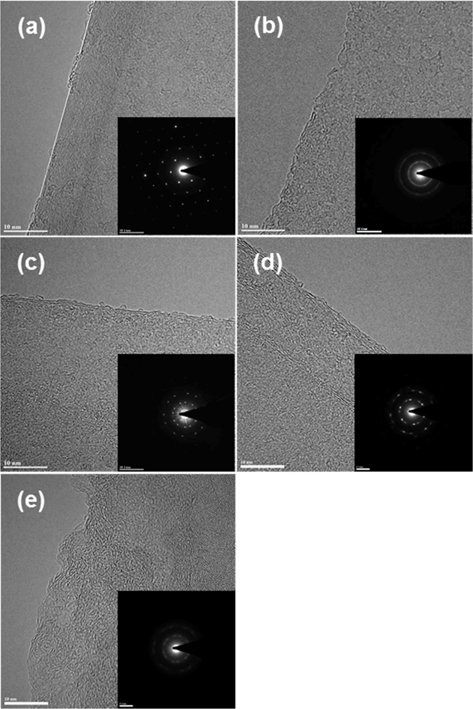
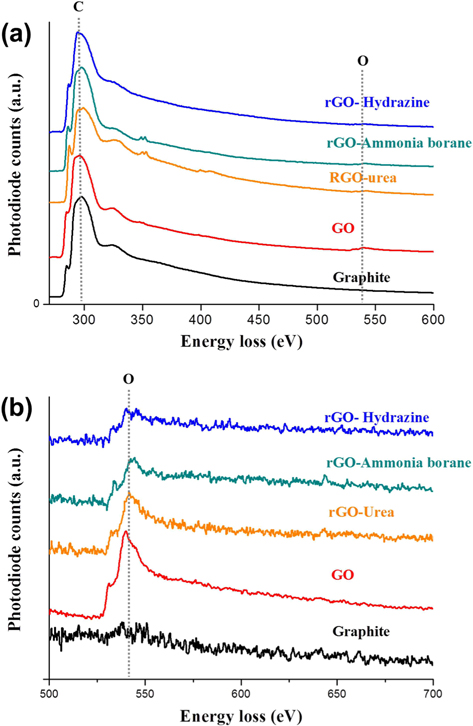
Fig. 3 provides TEM bright-field images and diffraction patterns of graphite, GO, and rGOs. SAD patterns were taken along the [001] zone axis. The pristine graphite, consisting of ~20 layers with a d-spacing of 0.34 nm, clearly shows a hexagonal diffraction pattern. In contrast, the diffraction pattern of GO was quite different from that of graphite. GO was found to contain amorphous layers with random orientations, and thus the diffraction pattern was shown to be in the shape of a circle. In addition, the edge of the graphene sheet was damaged and oxygen functional groups were added by chemical oxidation, which caused the crystallinity of GO to be much lower than that of graphite. The crystallinity of the rGO sheets was increased by the reduction process. Especially, the rGO prepared using hydrazine hydrate showed a clear diffraction spot without an amorphous pattern. Meanwhile, compared with GO, the rGO prepared using urea showed a slight change of the crystallinity. These TEM results are in good agreement with the XRD patterns shown in Fig. 2a. We believe that the crystallinity of the graphene sheet is dependent on the number of the oxygen functional groups attached to the graphene layer. For this reason, investigation and quantification of the carbon and oxygen amounts were carried out using EELS. Fig. 4a shows the overall EELS spectra obtained from graphite, GO, and rGOs; all spectra show both carbon and oxygen peaks. Fig. 4b and Table 1 show the enlarged spectra of the oxygen EELS peaks and the K edge EELS quantification results for carbon and oxygen amounts, respectively. The oxygen peak did not appear in the EELS spectrum of graphite. The EELS spectrum of GO, however, clearly shows an oxygen peak at 540 eV. The amount of oxygen in GO was found to be 10.88 at%. As expected, the intensity of the oxygen peak decreased after the reduction process. The rGOs prepared using hydrazine hydrate, ammonia borane, and urea have oxygen contents of 3.99, 5.28, and 7.19 at%, respectively. Comparing the EELS data with the SAD patterns, the crystallinity of the graphene layer is found to be dependent on the content of oxygen that was attached and removed by oxidation and reduction processes, respectively.
[Table 1.] Carbon and oxygen K edge EELS quantification results for graphite, GO and rGOs
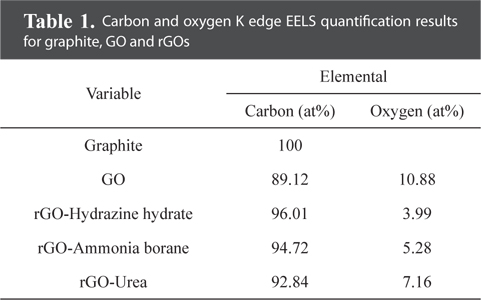
Carbon and oxygen K edge EELS quantification results for graphite, GO and rGOs
GO was prepared using the modified Hummers’ method; then, rGO was fabricated using various reducing agents including hydrazine hydrate, ammonia borane, and urea. Through the oxidation, the d-spacing of GO increased markedly; this was followed by a reduction process that decreased the d-spacing. The Raman intensity ratio, ID/IG, increased with oxidation and reduction, leading to the formation of a disordered structure. Transmission electron microscope images, SAD patterns, and EELS showed that the crystallinity and oxygen concentration varied with the oxidation and reduction processes. In addition, the structural properties of rGO were found to be dependent on the kind of reducing agent. Among the agents used, the hydrazine showed the best results in terms of crystallinity and oxygen content of rGO.


![Transmission electron microscopy bright field (BF) images and selected area diffraction patterns (BF image scale: 10 nm, zone axis z = [001]). (a) Graphite, (b) graphene oxide, (c) reduced graphene oxides (rGO) with hydrazine hydrate, (d) rGO with ammonia borane, (e) rGO with urea.](http://oak.go.kr/repository/journal/17207/HGTSB6_2015_v16n4_255_f003.jpg)