Recent studies performed with Brazil nut oil revealed the presence of phospholipids in its composition.4 Phospholipids are mostly glycerophospholipid compounds containing a phosphate ester in glycerol at the sn-3 position, being classified according by their polar head group constitution.5 The main classes of phospholipids are: phosphatidylcholine (PC), phosphatidylethanolamine (PE), phosphatidylserine (PS), phosphatidylinositol (PI), lysophosphatidylcholine (LPC), lysophosphatidylinosital (LPI) and phosphatidic acids (PA).6 Like a dietary supplements, these substances have proven beneficial physiological effects, for example, PI plays a crucial role in cellular signal transduction6 and PA has been associated with survival, proliferation, and reproduction of cell.7 Beyond the cited biological activities, phospholipids are also known for their chemical properties, which are important in maintaining the integrity of the cell membranes.8
As concerns the fractionation of phospholipids, has been employed various methods, such as thin layer chromatography (TLC), column chromatography and solid phase extraction (SPE).9 Regarding the analysis of phospholipids, various techniques have been used, such as high performance liquid chromatography (HPLC), gas chromatography (GC) and mass spectrometry (MS).10 MS offers an attractive alternative to phospholipid analysis due to high sensitivity, specificity and simplicity of analysis from the complex biological matrix.8 Recently, the use of MS to the analysis of phospholipids has become more frequent,10 highlighting the use of electrospray ionization (ESI), which have facilitated the elucidation of the lipid structures through the increasing of the sensitivity for these substances.11
In the present work a selective solid phase extraction (SPE) procedure for phospholipid enrichment was employed for Brazil nut, being the identification of the main constituents performed by fragmentation pattern analysis through the direct infusion using electrospray ionization ion-trap tandem mass spectrometry (ESI-ITMS2) and electrospray ionization quadrupole time-of-flight mass spectrometry (ESI-QTOF-MS).
Methanol, acetone and hexane were purchase from Tedia (Faireld, OH, USA). The deionized water used in all of the analyses was obtained by a Milli-Q system, (Millipore, Bedford, MA, USA) (R = 18 MΩ cm).
>
Plant material and sample preparation
The Brazil nuts were purchased in Manaus Moderna market, Manaus, Amazonas state, Brazil. The proposed method12 for extracting of compounds of intermediate polarity in Brazil nut was modified as described: The brown skin was removed from the kernel. The kernel was triturated (model TE-102, Tecnal) and then defatted with hexane (1:5 w/v, 5 min, three times) at ambient temperature (22℃). The defatted samples were extracted with 70% acetone (10 g sample per 100 mL of solvent) over a vigorous stir in a shaker apparatus (model SL 223, Solab) for 30 min at 50℃. The resulting was centrifuged at 4000 g (5810 R, Eppendorf) for 15 min, being the supernatants collected. The residue was re-extracted twice under the same conditions. The supernatants were combined and concentrated on a rotary evaporator. The residual water was subjected to solid phase extraction (SPE).
>
Solid-phase preparation and extraction of phospholipids compounds
The method for manual preparation of SPE described previously in the literature13 was modified as described. A penicillin-type syringe (1 mL) was manually packed with 100 mg of octadecyl silica (C18). The cartridge was first eluted with methanol (3 mL) and then conditioned with deionized water (5% methanol) (3 mL). The aqueous sample was passed through the column. After the clean-up step through the elution with water (3 mL), the retained material was recovered with methanol (1 mL) and dried under a nitrogen gas stream.
The sample obtained was diluted until 10 ppm in methanol and analyzed by direct infusion into an ESI source of an LCQ Fleet ion trap spectrometer (Thermo Scientific), operating in negative mode at the range of
ESI-QTOF-MS measurements were carried out in a Waters Synapt HDMS instrument. A sample of the phospholipids was solubilized in H2O/MeCN 50:50 with 0.1% (v/v) formic acid at a concentration of 1 mg/mL and further diluted 100-fold in the same solvent. Resulting solutions were directly infused into the instruments ESI source at a flow rate of 15 µL/min. Typical acquisition conditions were capillary voltage 3 kV, sampling cone voltage 20 V, source temperature 100℃, desolvation temperature 200℃, cone gas flow 30 L/h, desolvation gas flow 900 L/h, trap and transfer collision energies at 6 and 4 eV, respectively. ESI (-) mass spectra (full scans) were acquired in reflectron W- mode at a scan rate of 1 Hz. Prior each analysis, the instrument was mass calibrated with phosphoric acid oligomers (H3PO4 0.05% v/v in H2O/ MeCN 50:50) ranging from
A recent study performed with Brazil nut oil4 described PI, PA, PC and PE as the major classes of phospholipids, which have occurred at 31%, 24%, 24%, and 21% proportions respectively. This previous work still presents the free fatty acids C18:1 (oleic acid; 39.3%), C18:2 (linoleic acid; 36.1%), C16:0 (palmitic acid; 13.0%) and C18:0 (stearic acid; 11.0%) as the major constituents in the oil, however the composition of the fatty acids moiety of phospholipids are not in accordance with the free fatty acids identified. As example, linoleic acid (C18:2), the second more abundant fatty acid in the oil, appears only in 6%, 8%, and 11% of PC, PE, and PI, respectively. Besides, it has not been detected in the PA composition. Considering such apparent disagreement, the composition of fatty acids moiety of phospholipids from Brazil nut oil was reassessed using a modified method for extraction of substances with low to intermediate polarity based on SPE procedures, targeting a better sample clean up, followed by spectrometric investigation in ESI-IT-MS2 system.
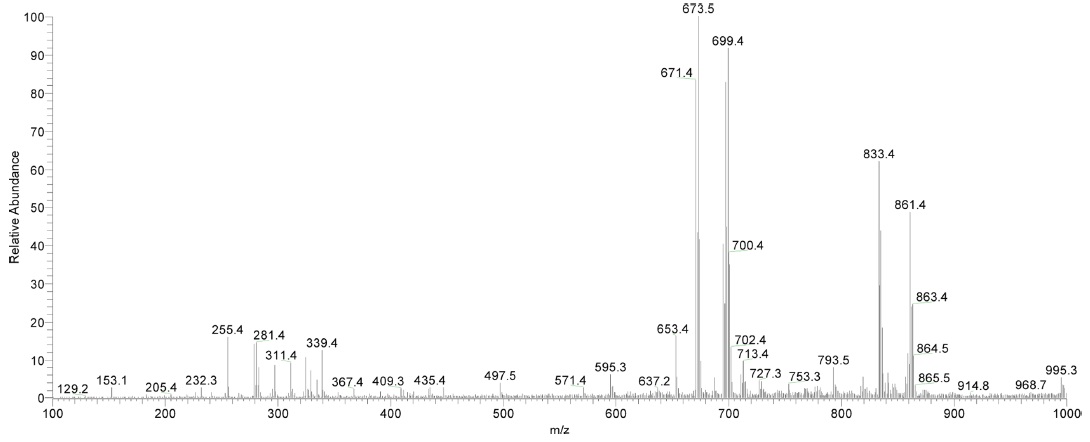
The total ion spectrum (Figure 1) obtained from the material recovered from the SPE cartridges displayed mainly high weight ions, with emphasis at m/z 671, 673, 697, 699, 833, 835, 861 and 863 (Table 1). The less intensity signals observed for free fatty acid ions and the higher intensity for phospholipids ions highlighted the efficiency of the SPE clean-up procedure.
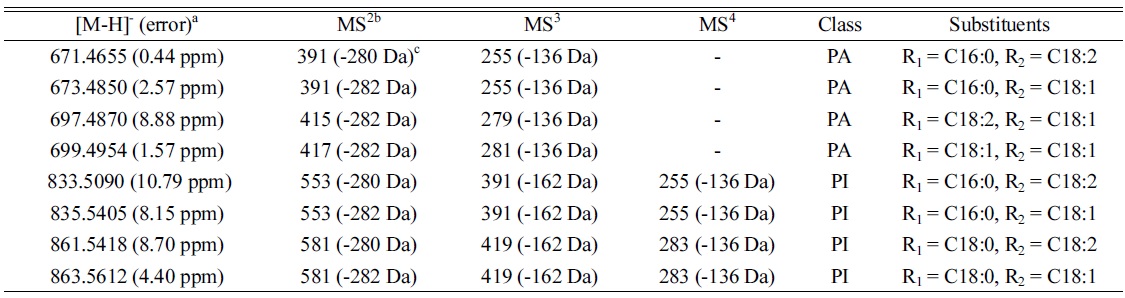
[Table 1.] Exact mass, main ions and neutral losses observed by negative ESI-IT-MS2

Exact mass, main ions and neutral losses observed by negative ESI-IT-MS2
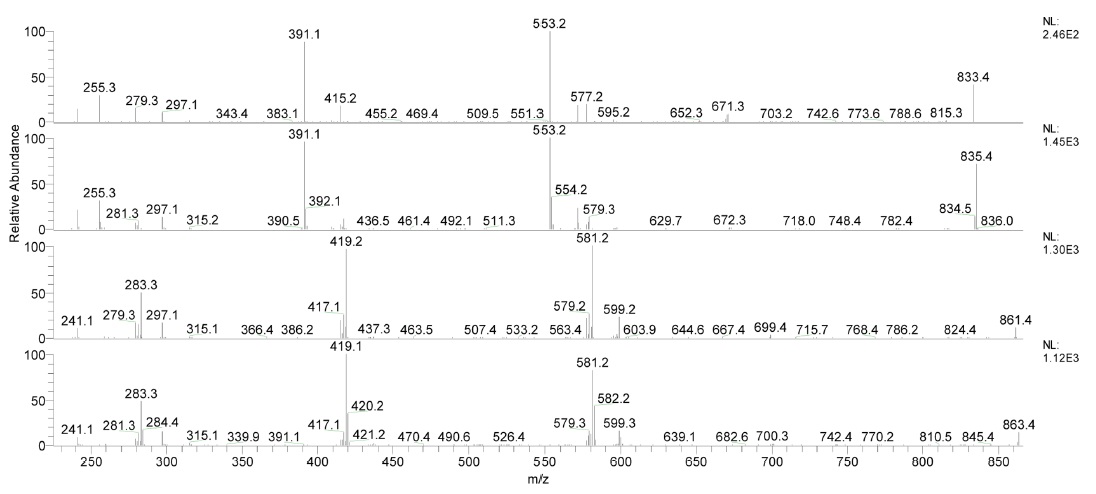
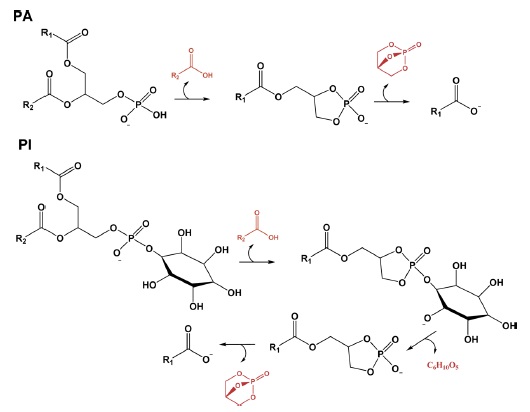
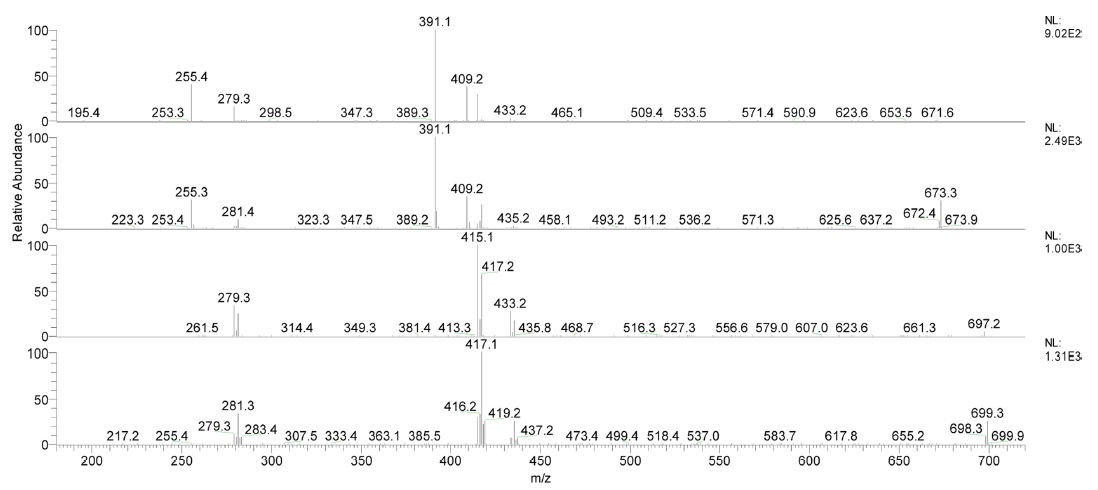
The MS2 analysis of these ions revealed two well-defined patterns of fragmentation. While for the first four main ions in the spectrum it was observed initial neutral loss of 282 (oleic acid C18:1) or 280 Da (linoleic acid C18:2) followed by a neutral loss of 136 Da (phosphate) (Figure 2), the last four main ions have presented after the loss of 282 or 280, a neutral loss of 162 Da (inositol) followed by a neutral loss of 136 (Figure 3).
These losses of 162 and 136 have been elucidated14 in mechanistic studies performed with PI compounds, being the first elimination associated with loss of inositol-H2O and the second associated with loss of phosphate group in a cyclic form. The absence of this 162 Da at the MS2 experiments for the first four ions indicates the absence of inositol, suggesting a PA structure (Figure 4). The same sample when subjected to ESI-QTOF-MS analysis displayed the same ions, being the measured
After recognizing the classes of phospholipids present in fraction, well as the fatty acid group R2 (Figure 3), it was possible to predict the fatty acid group R1 (Table 1), based on the mass differences observed at the product ion spectra along with the knowledge of the free fatty acids present in Brazil nuts oil4,which was confirmed through the signals referents to R1CO2- in spectrum. In this way were identified the presence of oleic acid (C18:1), linoleic acid (C18:2) and palmitic acid (C16:0), all previously described as major fatty acids in Brazil nut oil.4
The combination of SPE to purify phospholipids and MS to analyze them revealed a useful methodology to improve the gain on sensitivity and has permitted unambiguous characterization of eight phospholipids, four PA and four PI in Brazil nut. For these phospholipids it was not observed disagreement in respect of the composition of fatty acids of the phospholipids and that commonly found in Brazil nut oil. The issue of the reported absence of the linoleic acid (C18:2) as moiety of PA was overcome in this work. This result may have been obtained due the well known accuracy of mass spectrometry for identification of substances, even in complex mixture.