Biston robustum belongs to the family Geometridae and it is widely distributed throughout the Korea Peninsula; it also inhabits other countries, including Japan, China, Russia, Taiwan, and Vietnam (Jiang et al. 2011, Shin 2001). B. robustum imagoes are found twice a year (April through May and June through July) and cause the most severe damage to plants in July (Korea Forest Service 2015). Plants in Korea that B. robustum feed upon include Cornus controversa, Quercus acutissima, Rhododendron mucronulatum, Prunus serrulata var. spontanea, Pueraria lobata, and Cinnamomum camphora (Shin 2001). In Japan, Malus pumila, Pyrus pyrifolia var. culta, Urtica thunbergiana, Quercus serrata, Quercus acutissima, Castanea crenata, Eurya japonica, Prunus serrulata var. spontanea, Camellia sinensis, Cornus controversa, Camellia japonica, Acer palmatum, Rosa multiflora are the known food plants for B. robustum (Esaki et al. 1999). Globally, B. robustum has been known to cause damage to more than 30 plant species belonging to the families Theaceae, Caprifoliaceae, Aceraceae, Lardizabalaceae, Cornaceae, Fagaceae, Seguminosae, and Rosaceae; plants belonging to Rosaceae and the genus Prunus are the major food plants for B. robustum (Natural History Museum 2015). This polyphagous insect has been reported to damage 57 plant species in and around the Geomundo-area of South Korea (Park et al. 2005).
After the first major outbreak of B. robustum in 1989 near Soowoel Mountain in the Dadohaehaesang National Park of Korea (Jeollanam province Yeosu-si, Samsan-myeon Geomun-ri), significant damage to plants was reported within the same area in 2003 and 2004 (Park et al. 2005). Prior to this, non-periodic damage was often reported, resulting in flowerless trees or a weakening of tree vigor (Park et al. 2005). Although B. robustum is polyphagous, non-periodic outbreaks on a specific tree (i.e., C. japonica) have occurred, likely due to the reckless lumbering of the evergreen broad-leaved forest around C. japonica to obtain camellia flowers; this also led to reduction in species diversity (Park et al. 2005). In case of the bark beetle, which causes serious damages to forests worldwide, multiple studies have shown cascading changes in forest species compositions and diversities as well as increasing tree mortality as a result of decreasing forest structural complexity (Veblen et al. 1991).
Temperature may directly influence insect ontogenetic development, survival, and reproduction, and indirectly affect generation time and population growth rate (Nelson et al. 2013). Thus, temperature is one of the critical factors determining the timing of major insect outbreaks. Over the last century, the annual mean temperature of Korea has increased by 1.7℃, and is expected to further rise by 2℃ by 2050 (Korea Adaptation Center for Climate Change 2015). Therefore, the habitat of C. japonica may not be limited to the southern part of the peninsula, and widespread, continuous damages by B. robustum can be expected. Therefore, it is particularly important to investigate interactions between B. robustum and C. japonica because there are more than 20 natural monuments (Cultural Heritage Administration of Korea 2015) and monuments designated by cities/provinces in South Korea that may be consistently affected by B. robustum. We investigated the current and potential spatial distributions and habitable areas of B. robustum and C. japonica in South Korea in order to provide useful data for the preservation of C. japonica and minimize damage caused by B. robustum. To accomplish this, we (1) identified the most influential climate factors for predicting the potential distribution of B. robustum and C. japonica and (2) measured the overlapping areas of the distribution of these two species under the current, 2050-predicted, and 2070-predicted climatic conditions.
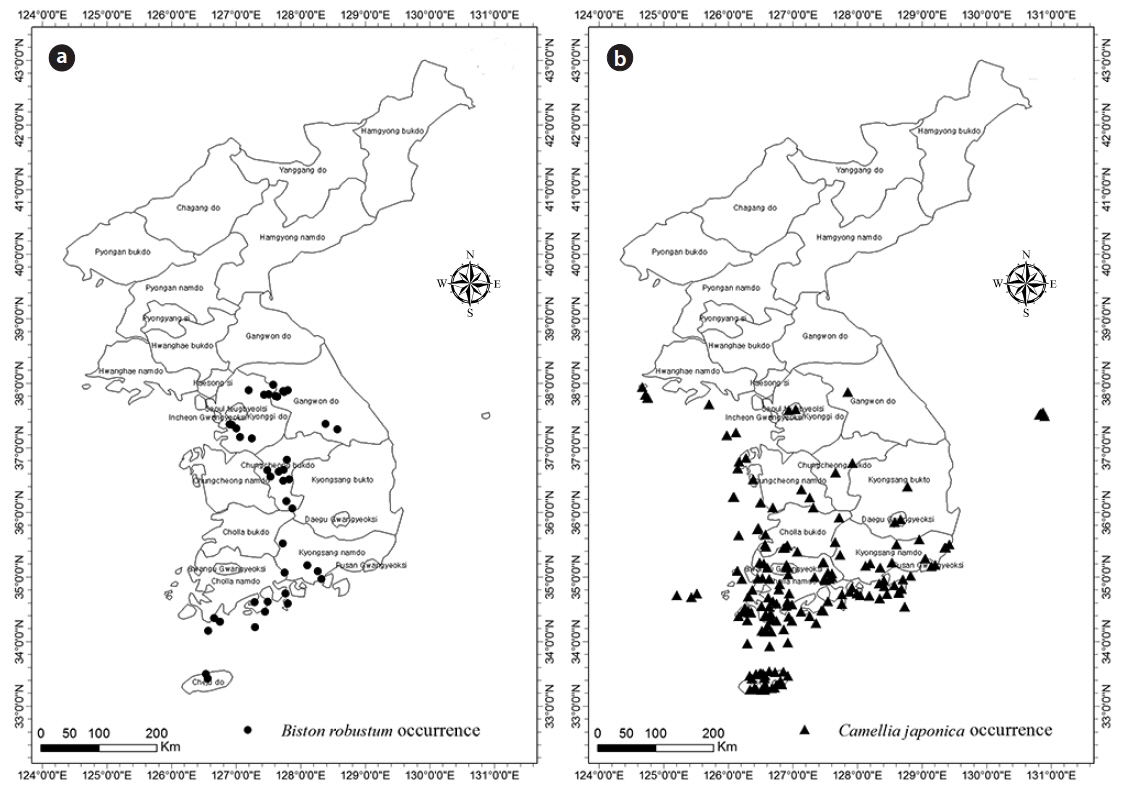
B. robustum data were collected from 45 points (Fig. 1a), and data obtained from the Global Biodiversity Information Facility (GBIF) until 2014 were used for further analyses. A total of 177 data collection points were used for the analyses of C. japonica (16 points from Lee and Yim 2002), 122 points from the Korea Biodiversity Information System, and 39 points from the Cultural Heritage Administration) (Fig. 1b). Data with uncertain collection information were not used. Representative coordinates were obtained from Google Earth.
Current and future climate data were needed to predict and assess climate change induced changes in B. robustum and C. japonica distributions. The WorldClim website (http://www.worldclim.org) provided current climate data. The spatial resolution used by WorldClim is 30” (approximately 1 km2). This organization provides climate information for the entire planet through its use of thinplate smoothing spline interpolation of climate data that were collected from 1950 to 2000 (Hijmans et al. 2005). Climate scenarios from the HadGEM-AO model (one of the many models of CIMP5), which uses the Representative Concentration Pathway (RCP), as determined by the IPCC’s Fifth Assessment Report on 2050 (2040–2060) and 2070 (2060–2080), were used to predict the future distribution of B. robustum and C. japonica.
To investigate changes in the distribution areas of B. robustum and C. japonica, we used the MaxEnt 3.3.3k (Phillips et al. 2006) species distribution model, which is based on maximum entropy algorithms. The MaxEnt species distribution is a machine-based learning method utilizing environmental characteristics of spatial information from areas where specific species are located. This model has been widely used in the ecological fields of biological geography and conservation biology (Phillips et al. 2006). The model compared the similarity of climate properties within the entire research area with climate properties in areas where B. robustum and C. japonica currently occur. A probability map of species distributions was created, ranging from 0 to 1, where the closer a value is to 1 the higher the likelihood that a species will be located in that area. The accuracy of the prediction model for B. robustum and C. japonica distribution areas was validated using the area under the curve of receiver operating characteristic (AUC of ROC). The Jackknife validation was then performed to validate the significance of the climatic variables that influence the predicted distribution areas (Phillips et al. 2006). The size and direction of changes in distribution areas, in response to climate changes, were evaluated by overlapping the current area with future areas. In order to map and analyze the effects of climate change on species distributions, ArcGIS 10.0 (ESRI, Redlands, USA) was used, and R-3.1.1 (http://www.R-project.org/) was used for the statistical analyses.
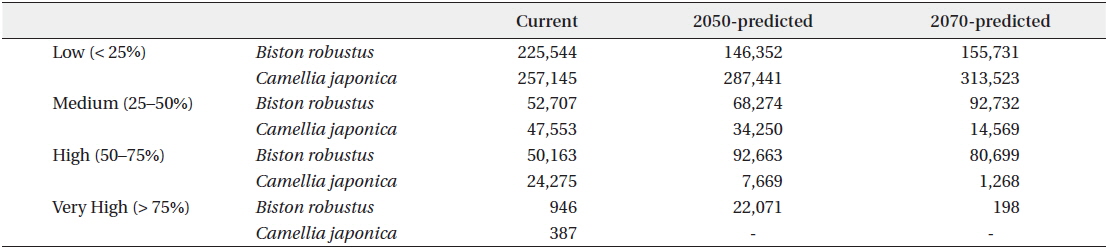
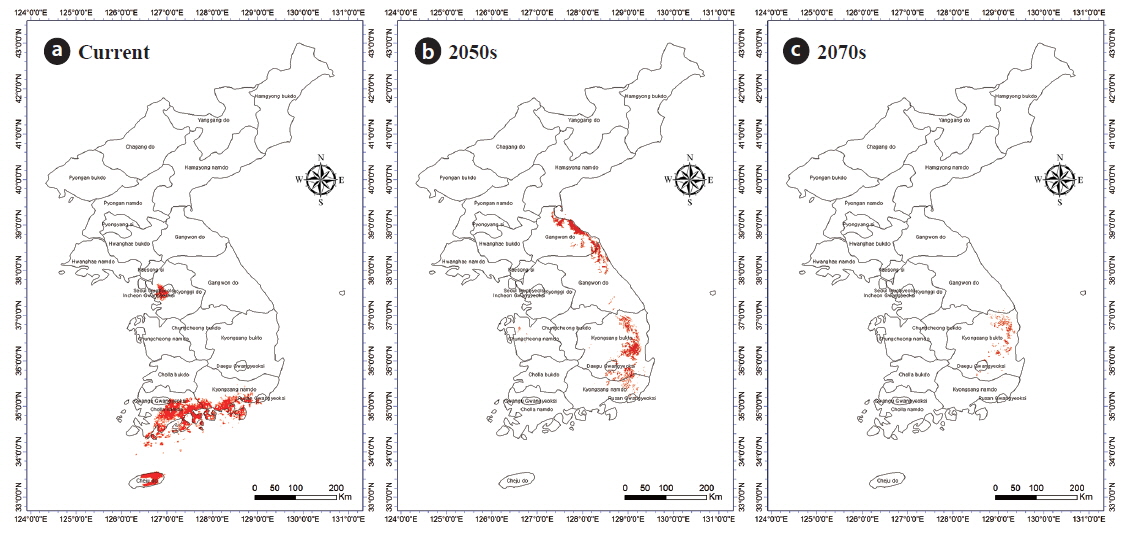
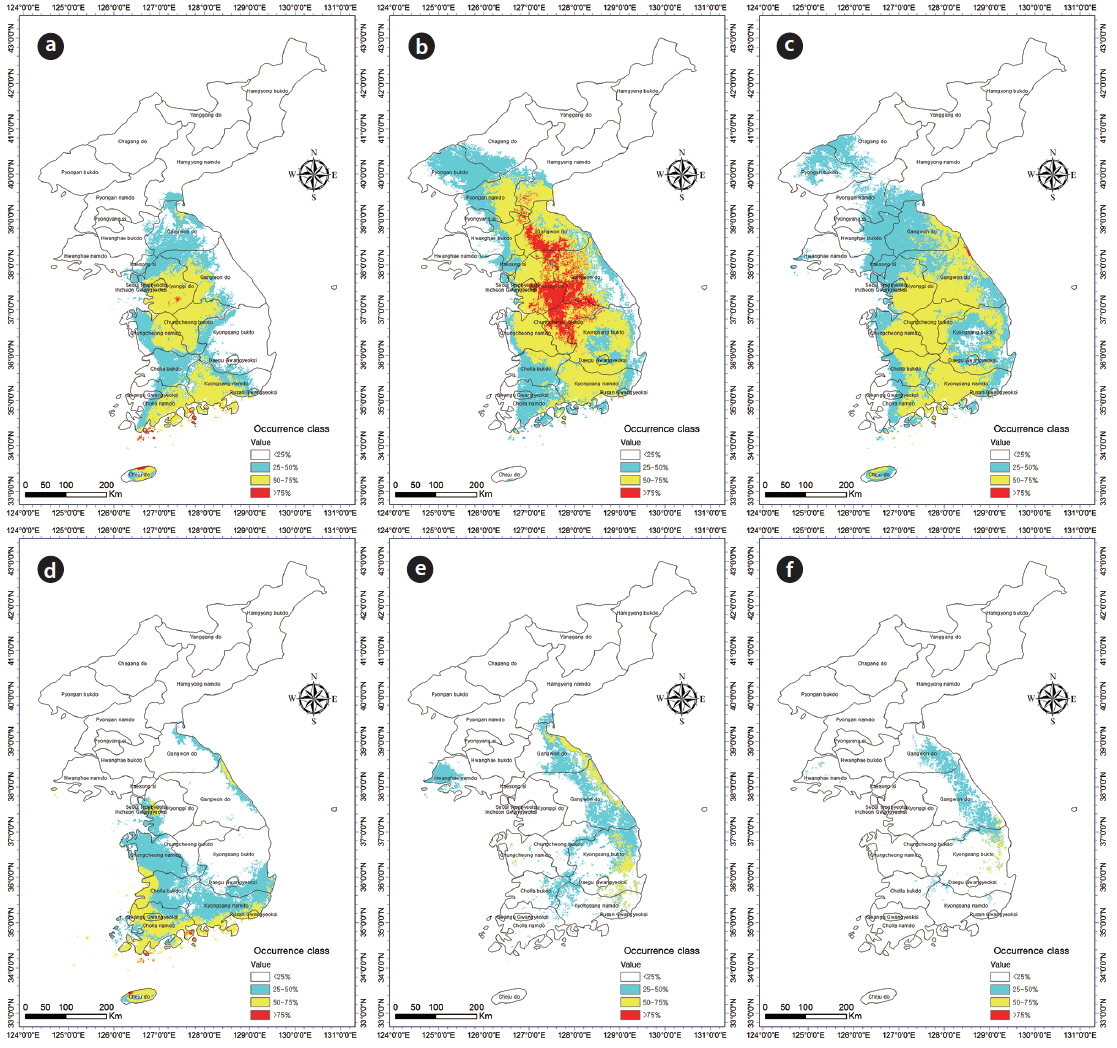
Incorporation of bioclimatic variables into the MaxEnt model showed that B. robustum will be distributed throughout Jeollanam, Gyeongsangnam, Chungcheongnam, Chungcheongbuk, Gyeonggi, and Gangwon provinces in South Korea, except for the western and eastern coastal areas (Fig. 2a). All areas, except for a few areas in the western and eastern coasts, were predicted to be habitable zones for B. robustum by 2050 (Fig. 2b). The area was predicted to decrease in size and shift eastward by 2070 (Fig. 2c). The current critical habitable area of B. robustum (Very High: >75%; Table 1) includes part of Gyeonggi Province located south of Seoul, Wan Island of Jeollanam Province, as well as the islands of Bogil, Soan, Chungsan, Yeosu-si, Dolsan, and Geogeum (Fig. 2a). These critical habitable areas were predicted to expand throughout Chungcheongnam, Chungcheongbuk, Gyeonggi, and Gangwon provinces by 2050 (Fig. 2b). However, the model predicted that by 2070, the critical habitable areas would be narrowly distributed along the coastlines of Sokcho-si and Goseong-gun of Gangwon Province (Fig. 2c).
Currently, C. japonica inhabits Seoul, some areas of Gyeonggi, Chungcheongnam, Chungcheongbuk, Jeollanam, Gyeongsangnam, and Gyeongsangbuk provinces, and the coastal areas of Gangwon Province (Fig. 2d). It was predicted that by 2050, C. japonica would not be distributed along the western coastal areas, but it would be found mainly in Gyeongsangnam and Gyeongsangbuk provinces, and along the coasts of Gangwon (Fig. 2e). In contrast, by 2070, habitable areas will be significantly smaller than the 2050 areas, and will be restricted to limited areas in Gyeongsangbuk Province and the southern coastal lines of Gangwon Province (Fig. 2f). Currently, the critical habitat of C. japonica includes the northern coastal lines of Jeju, Wan, Bogil, Soan, Yeosu-si, and Dolsal islands, but it will disappear from these areas by 2050 and 2070 (Fig. 2d–f).
The current potential habitable area of B. robustum (categorized as “High” 50–75%) is 50,163 km2, and was predicted to gradually expand to 92,663 km2 by 2050, and then decrease to 80,699 km2 by 2070 (Table 1). In contrast, for the “Very High” (>75%) category, the current potential habitable area was predicted to be 946 km2 and will dramatically increase to 22,071 km2 by 2050, and then significantly decrease to 198 km2 by 2070. The current potential habitable area of C. japonica in the ‘High’ category was 24,275 km2 and was predicted to significantly decrease to 7,669 km2 and 1,268 km2 by 2050 and 2070, respectively. Similarly, the “Very High” category was 387 km2 under the current conditions, but was predicted to completely disappear by 2050 and 2070.
The AUC of ROC, which validated the accuracy of the MaxEnt model for predicting possible distribution areas of B. robustum and C. japonica, ranged from 1.0 (perfect predictive accuracy) to 0.5 (least predictive accuracy). Species distribution predictions from the MaxEnt model were considered to be significant only if the AUC value exceeded 0.7 (Phillips and Dudik 2008). The AUC values for our MaxEnt model were 0.995 and 0.991 for B. robustum and C. japonica, respectively, indicating that the model effectively predicted distributions.
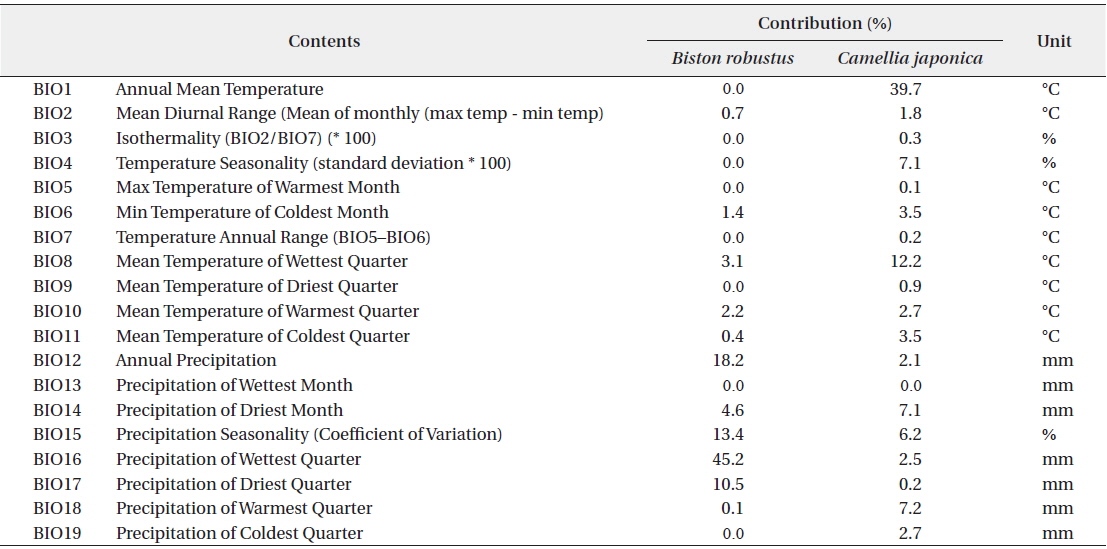
In the order of significance, BIO16, BIO12, BIO15, and BIO17 had impacts that exceeded 10% for the potential distribution of B. robustum, while BIO1, BIO3, BIO4, BIO5, BIO7, BIO9, BIO13, and BIO19 had no effect on distribution (Table 2). The variables of BIO16, BIO12, BIO15, and BIO17 are all related to the amount of precipitation; the sum of the contribution of these four variables was 87.3%, clearly indicating that precipitation is one of the most critical factors determining B. robustum distributions (Table 2). In contrast, BIO1 and BIO8 had effects that exceeded 10% for C. japonica potential distribution; these two variables were related to temperature and had a combined contribution of 51.9% (Table 2).
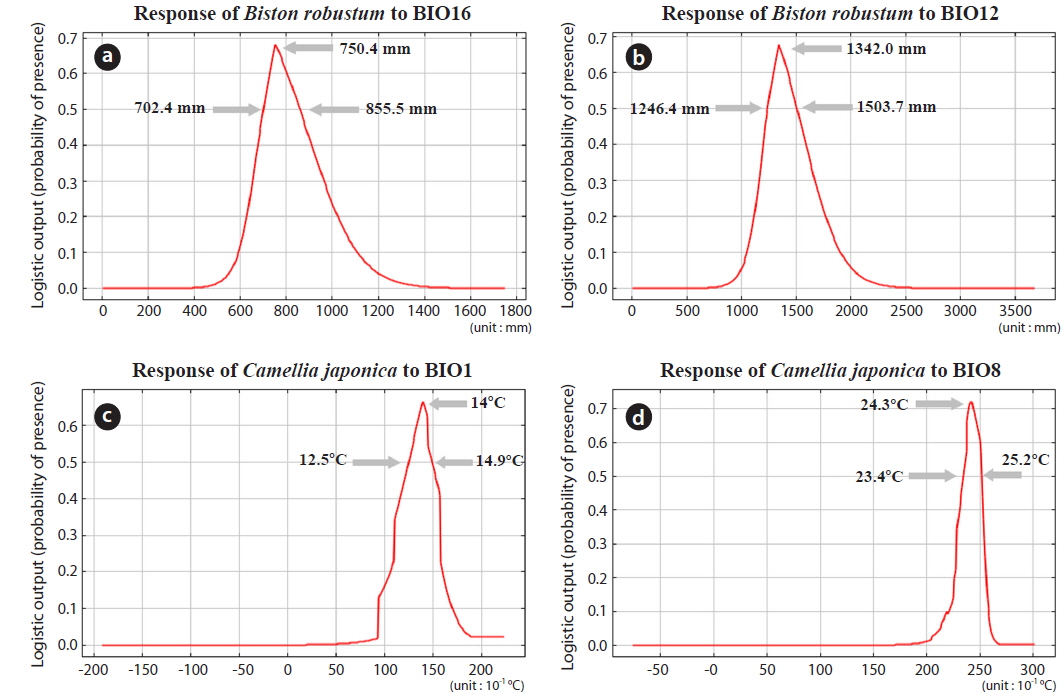
The two most influential factors for B. robustum distribution were BIO16 (Precipitation of the Wettest Quarter; 45.2%) and BIO12 (Annual Precipitation; 18.2%) (Table 2). The distribution probability of B. robustum was approximately 70% for precipitation of 750.4 mm (Fig. 3a). The probability was above 50% where BIO16 ranged between 702.4 mm and 855.5 mm (Fig. 3a). For BIO12, the probability of B. robustum occurrence was very close to 70% in the regions where the annual precipitation was 1,342.0 mm (Fig. 3b). The probability of B. robustum occurrence was greater than 50% in areas where the precipitation ranged from 1,246.4 mm to 1,503.7 mm (Fig. 3b). The two most significant variables related to C. japonica distribution were BIO1 (Annual Mean Temperature; 39.7%) and BIO8 (Mean Temperature of Wettest Quarter; 12.3%) (Table 2). For BIO1, the probability of distribution of C. japonica was approximately 70% in regions where this variable was 14℃ (Fig. 3c). The probability was higher than 50% in areas where the temperature was between 12.5℃ and 14.9℃ (Fig. 3c). However, for BIO16, the distribution probability of C. japonica was approximately 70% if the amount of precipitation was 24.3℃ (Fig. 3d). The probability was above 50% where BIO8 ranged between 23.4℃ and 25.2℃ (Fig. 3d).
Given that there was no location that had greater than 75% (‘Very High’) probability for C. japonica presence in 2050 and 2070, only regions where the probability was higher than 50% but less than 75% were included for the correlation analyses (i.e., overlapping areas) between C. japonica and B. robustum. Overlapping areas for the presence of B. robustum and C. japonica included Seoul, some parts of Gyeonggi Province, Jeju Island, Jeollanam province, and Gyeongsangnam provinces (Fig. 4a). By 2050, the overlapping areas were in Gyeongsangnam and Gyeongsangbuk provinces, and along the costal lines of Gangwon Province. By 2070, the overlapping areas were in limited areas of Gyeongsangbuk Province (e.g., Andong and Youngju) and Daegu City (Fig. 4b and 4c). Overall, these overlapping areas gradually shifted toward the eastern coastal areas from the southern coast of the Korea peninsula. The overlapping areas of B. robustum and C. japonica were 11,782 km2, 5,447 km2, and 870 km2 for the current, 2050-predicted, and 2070-predicted conditions, respectively, clearly showing a dramatic decrease in the overlapping area (Fig. 4a–c).
We predicted the distribution of B. robustum, a species found in South Korea (An et al. 2012), for current, 2050-predicted, and 2070-predicted conditions using climate change scenarios. Our analyses showed that these species are distributed mostly in inland provinces, but they may migrate to some eastern coastal areas in the future. It was predicted that the regions where the distribution probability of B. robustum is higher than 50% but less than 75% would dramatically increase until 2050 and then slightly decrease by 2070 (Table 1). As reported by Lee and Kim (1992), the potential habitable areas for C. japonica were concentrated around the southern coast of the Korean peninsula, whereas in our study, the area was extended to Daecheong Island and Ulreung Island to the west and the east, respectively. There was no habitable area predicted for C. japonica by 2050 and 2070, in which the probability was higher than 75%. Previously, other studies determined that C. japonica might inhabit the central inland area of Korea, including Seoul, if the average annual temperature were elevated by 2℃ (Korea Forest Service 2015). Further investigations might be warranted to evaluate this discrepancy.
The two most influential variables for the potential distribution of B. robustum and C. japonica were BIO16 (Precipitation of Wettest Quarter) and BIO12 (Annual Precipitation), and BIO1 (Annual Mean Temperature) and BIO8 (Mean Temperature of Wettest Quarter), respectively (Table 2). According to the National Weather Service data, the Precipitation of Wettest Quarter and Annual Precipitation of Yeosu-si and Wan Islands, where the probability of presence for both B. robustum and C. japonica was higher than 75%, were 766.2 mm and 773.9 mm, and 1439.0 mm and 1532.7 mm, respectively (Cultural Heritage Administration of Korea 2015). The annual mean temperature and mean temperature of wettest quarter of these areas were 14.3℃ and 14.1℃, and 23.7℃ and 23.6℃, respectively (Cultural Heritage Administration of Korea 2015). Except for the Annual Precipitation of Wan Island (1532.7 mm), such results are in agreement with our predictions in which the probability of B. robustum and C. japonica was higher than 50% (Fig. 3). Thus, predictions for the potential distribution of B. robustum and C. japonica, for present as well as future conditions, might be accurate. Finally, the overlapping regions where the probability of occurrence was higher than 50% but less than 75% for both B. robustum and C. japonica were predicted to be drastically reduced, and the overlapping area where the probability of occurrence was higher than 75% was shown for current conditions, but not predicted for future ones.
Using climate change scenarios, we predicted current and future distribution of B. robustum and C. japonica in Korea. Although it is predicted that B. robustum would cause consistent damage to C. japonica in the southern part of the Korean peninsula, the risk of a B. robustum outbreak seems to be extremely, considering the differences in factors determining its potential future distribution.