검색 전체 메뉴
PDF
맨 위로
OA 학술지
High-Resolution 3-D Refractive Index Tomography and 2-D Synthetic Aperture Imaging of Live Phytoplankton
  • 비영리 CC BY-NC
  • 비영리 CC BY-NC
ABSTRACT
High-Resolution 3-D Refractive Index Tomography and 2-D Synthetic Aperture Imaging of Live Phytoplankton
KEYWORD
Phytoplankton , Plankton , Quantitative phase imaging , Diffraction optical tomography
  • I. INTRODUCTION

    Phytoplankton are major food sources in aquatic ecosystems and play an important role in the global cycle of carbon and silicon, which has led many researchers to focus their efforts on investigating their diverse characteristics [1]. To research this microscopic organism in detail, an appropriate imaging system is essential. Several optical microscopic techniques have been used for the study of phytoplankton [1, 2]. However, conventional light microscopy techniques have severe drawbacks in imaging and quantitative studying of phytoplankton. For example, bright-field microscopy only produces low imaging contrasts for transparent objects such as phytoplankton. Phase contrast [3] or differential interference contrast (DIC) microscopy [4] provide enhanced imaging contrast for phytoplankton via interference; however, neither the phase contrast nor DIC microscopy provides quantitative information, and they are not capable of 3-D imaging. Although confocal laser scanning microscopy [5] provides the 3-D structures of phytoplankton, samples usually need to be labelled with exogenous agents such as fluorescent proteins or dyes, which cause phototoxicity, photobleaching, and interference with intrinsic cellular metabolism [6].

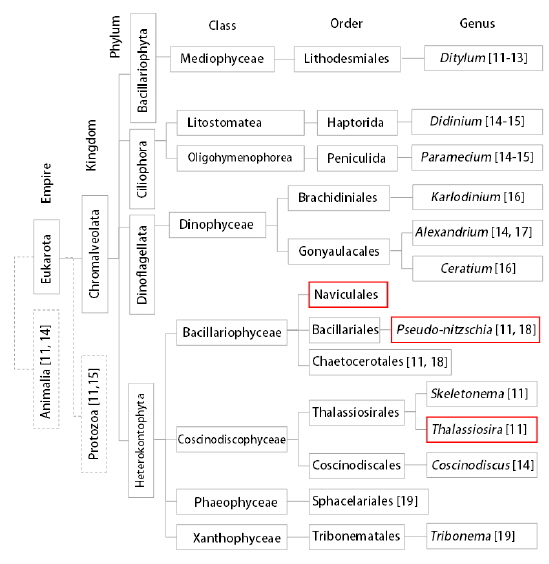
    Recently, there has been an emergence of quantitative phase imaging (QPI) or digital holography techniques and their applications in the study of transparent phase objects such as biological cells and tissues [7-13]. The QPI techniques − based on light interferometry − quantitatively measure optical path length shifts introduced by the refractive index (RI) distribution in a specimen. Several QPI techniques have been extensively employed for investigating phytoplankton research, as summarized in Fig. 1. Using digital in-line holographic microscopy or digital holographic microscopy based on Mach-Zehnder interferometry, the shapes, sizes, and 3-D positions of living organelles were measured [14-22]. However, previous works have only focused on the 2-D imaging of phytoplankton and 3-D internal structures of individual live phytoplankton have not been measured yet, largely owing to the limitation of tomographic capability of conventional in-line holography or digital holographic microscopy. We note a notable exception in which 3-D RI maps of non-living diatom skeletons have been measured [23].

    Here we present the measurements of high-resolution 3-D RI maps of phytoplankton employing optical diffraction tomography [24-26]. Multiple 2-D QPI images of individual phytoplankton are recorded with various angles of illumination, from which a 3-D RI map of the sample is reconstructed taking into account the effects of optical diffraction, analogous to computed tomography in X-ray. This measurement of a 3-D RI map provides the quantitative structural and biochemical information of phytoplankton including the dry mass, the volume, and the cytoplasmic density of phytoplankton. Furthermore, the measured set of multiple 2-D QPI images of phytoplankton recorded with various angles of illumination was also utilized for generating a high-resolution 2-D QPI image employing the synthetic aperture algorithm [27], which provides the spatial resolution beyond the diffraction limit determined by the numerical aperture (NA) of a used imaging system. The measured 2-D and 3-D quantitative phase images of phytoplankton and the parameters obtained clearly demonstrate the viability of the present method as a useful tool with unique advantages for the study of phytoplankton.

    II. METHODS

       2.1. Optical Setup

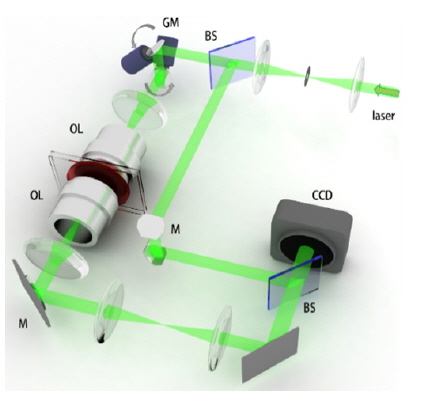
    To measure the quantitative phase images of individual phytoplankton, we employed quantitative phase microscopy based on Mach-Zehnder interferometry (Fig. 2). The experimental setup is equipped with a two-axis galvanometer mirror (GM, GVS012/M, Thorlabs, USA), which varies the illumination angle of an incident beam for the tomographic measurement. This setup is conceptually comparable with setups used in previous works [24, 28].

    For an illumination source, a diode-pumped solid state (DPSS) laser (λ = 532 nm, 50 mW, Cobolt Co., Solna, Sweden) is used. After spatial filtering, a laser beam is split into two beams by a beam splitter (BS, BS016, Thorlabs, USA). One of the beams serves as a reference beam and the other beam, which traverses the beam splitter and passes through a sample positioned in the stage of an inverted microscope, serves as a sample beam. These two beams are then recombined by another BS in front of the camera with a slightly tilted angle, and resultant off-axis interference patterns are captured by the high-speed CMOS camera (Neo sCMOS, ANDOR Inc., Northern Ireland, UK). One objective lens (UPLFLN, ×60, NA = 0.9, Olympus Inc., San Diego, CA, USA) positioned in front of the sample stage was used as a condenser lens for illuminating purposes. The total magnification of the imaging system is 240, consisting of the high NA imaging objective lens (PLAPON, ×60, Oil immersion, NA = 1.42, Olympus Inc., San Diego, CA, USA) and an additional 4-f telescopic imaging system. The field of view at the sample plane is 48.1 × 47.7 μm2, which corresponds to 1,776 × 1,760 pixels with a pixel size of 6.5 μm at the CCD plane.

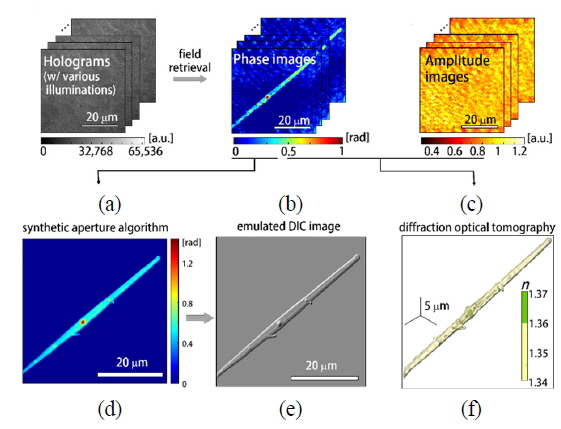
    At the microscopic stage, a sample is illuminated by a plane laser beam, and the angle of illumination can be systematically controlled by rotating the two-axis galvanomirror. For one sample, a set of 300 interferograms with various angles of illumination is recorded at a frame rate of 100 Hz. From the set of measured interferograms (Fig. 3(a)), the corresponding phase and amplitude information (Fig. 3(b) and (c)) of the sample can be retrieved using an appropriate phase retrieval algorithm [29]. These holograms measured with different illumination angles are then used to reconstruct the high-resolution 2-D quantitative phase map using synthetic aperture algorithm [27] and 3-D RI tomogram image of a sample employing optical diffraction tomography [24-26], which is explained in detail in the following section.

       2.2. Image Reconstruction Processes

    In order to construct 2-D high-resolution phase images of phytoplankton (Fig. 3(d), we employed the synthetic aperture imaging algorithm [27]. The principle of the synthetic aperture algorithm is to numerically extend the aperture of an imaging system in order to achieve high spatial resolution and high signal-to-noise ratio (SNR) [30, 31]. Measured holograms of a sample obtained with various illumination angles contain information on the scattering potential of a sample, which cannot be accessed by a conventional optical imaging system with a fixed aperture. Employing the synthetic aperture algorithm, this information can be fully harnessed and reconstructed in the 2-D Fourier space, and finally provides a high-resolution 2-D phase image of a sample beyond the diffraction-limit determined by NA of the optical imaging system used. The representative phase image obtained with the aperture synthesis algorithm is shown in Fig. 3(d).

    Compared to the phase image directly measured from the QPI system (Fig. 3(b), the phase image obtained with the aperture synthesis algorithm (Fig. 3(d)) provides higher spatial resolution and SNR ratio. In conventional quantitative phase images, the maximum spatial frequency kmax which determined the resolving power is determined as |kmax| = 2 πNAimg/λ, where NAimag denotes the NA of the imaging objective lens. Whereas the kmax achieved by the synthetic aperture algorithm is |kmax| =2π(NAillum + NAimg)/λ. In this case, NAillum denotes the NA of the condenser objective lens. In addition, using the synthetic aperture imaging, the SNR ratio can be significantly enhanced by reducing speckle noise. Moreover, the emulated DIC image (Fig. 3(e)) can also be numerically obtained. A DIC image can be calculated by interfering a synthetic aperture image, containing both amplitude and phase information, with a laterally translated synthetic aperture image [32]. Internal structures of phytoplankton can be clearly seen in the emulated DIC image, because the imaging contrast of DIC images depends on optical phase gradient.

    In order to construct 3-D RI maps of phytoplankton, we employed an optical diffraction tomography algorithm. Based on the Fourier diffraction theorem [33], a set of measured 2-D optical fields can be mapped onto a 3-D scattering potential spectrum. The spatial frequency information of a 2-D optical field measured with a plane wave with a specific angle of illumination corresponds to a hemispheric area, so called Ewald’s surface in 3-D Fourier space. Due to the limited NA of an objective lens, some information is inevitably inaccessible in the 3-D Fourier space. This missing information can be filled using an iteration method with appropriate assumptions [34]. Finally, the 3-D RI distribution of a sample can be converted from the 3-D scattering potential spectrum via 3-D inverse Fourier transformation. The representative 3-D RI map of phytoplankton is presented in Fig. 3(f), which shows high-resolution structural information of phytoplankton in 3-D with the quantitative RI values. The details on optical diffraction tomography and the custom-made MatLab codes used, which can be found elsewhere [26].

    III. RESULTS

       3.1. Quantitative Holographic Images of Individual Phytoplankton

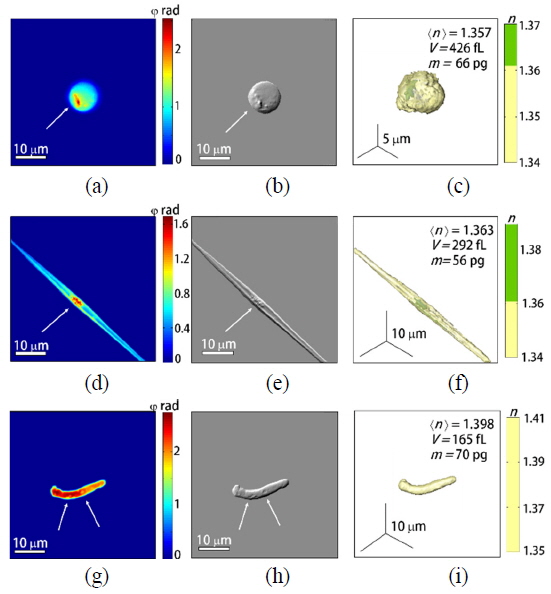
    To demonstrate the capability of quantitative imaging of phytoplankton, we measured 4, 11, 12 of spherical-, rod-shaped-, and non-spherical phytoplankton, respectively. These phytoplankton samples were collected from a pond in Daejeon, South Korea. The 50 μL of pond water was directly loaded between two coverslips (24 × 50 mm, Matsunami, Japan) without adding any exogenous agents. The holographic images of representative individual phytoplankton are depicted in Fig. 3. The high-resolution 2-D phase images obtained with the synthetic aperture algorithm (Figs. 4(a), (d), and (g)], the emulated DIC (Figs. 4(b), (e), and (h)) and the 3-D RI distributions (Figs. 4(c), (f), and (i)) of individual spherical-, rod-shaped-, and non-spherical phytoplankton were reconstructed from sets of measured 2-D phase images, respectively (See Methods).

    Based on the measured morphology and internal structures, the measured spherical phytoplankton (Fig. 4(a)-(c)) seem to belong to Thalassiosira decipiens. Overall morphology and the internal structures with high RI [indicated with the arrows in Figs. 4(a)-(b)] were seen in both the high-resolution 2-D phase and DIC images. The 3-D RI distribution of the spherical phytoplankton (Fig. 4(c)) clearly reveals the complex internal structures of the phytoplankton. The nucleus has higher RI value (n > 1.36) than cytoplasm [the area with green color in Fig. 4(c)]. Furthermore, the retrieved values of RI can serves as intrinsic imaging contrast for phytoplankton, which can be utilized for the extraction of various quantitative imaging parameters of phytoplankton including the mean RI <n>, dry mass M, and the volume V of individual phytoplankton. The calculated quantitative parameters of the spherical phytoplankton are indicated in Fig. 4(c). The rod-shaped phytoplankton (Figs. 4(d)-(f)) seem to belong to Pseudo-nitzschia australis based on its distinctive rod-like shape and the morphology of internal structure examined from the measured 2-D phase image and 3-D RI map. The nucleus structure with high optical thickness is clearly seen in the middle of the rod-shape phytoplankton in both the high-resolution 2-D phase image with the synthetic aperture algorithm as well as the emulated DIC image. The 3-D morphology of the rod-shape phytoplankton and the nucleus are also seen in the retrieved 3-D RI maps. The representative non-spherical phytoplankton (Figs. 4(g)-(i)) is thought to be Navicula sp. based on its shape and size seen in the measured quantitative phase images. Compared to the spherical and the rod-shaped phytoplankton, the non-spherical phytoplankton has high RI values (<n> = 1.398) for its cytoplasm, indicating the high density of biomolecules in cytoplasm. Furthermore, the large nucleus shown in the spherical and the rod-shaped phytoplankton is not found in the rod-shaped phytoplankton. Yet, it contains several small internal structures with low RI values dispersed in the cytoplasm, as indicated with the arrows in Figs. 4(g)-(h).

       3.2. Quantitative Phytoplankton Parameters: Volume, Dry Mass, and Density

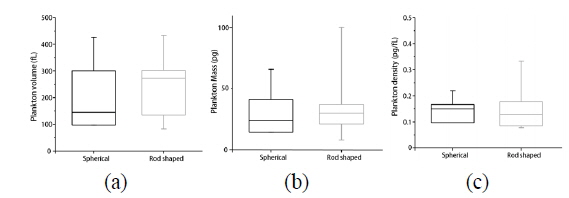
    In order to demonstrate quantitative analysis capabilities of quantitative phase imaging of phytoplankton, we retrieved morphological and biochemical properties of individual phytoplankton. The reconstructed 3-D RI maps and 2-D quantitative phase images using the synthetic aperture algorithm allow the quantitative analysis of phytoplankton, which provides various parameters including the volume, dry mass, and cellular density of individual phytoplankton, simultaneously. From the measured volume and dry mass, we also can calculate the density of each phytoplankton. These analyses were performed to 4 spherical and 11 rod-shaped phytoplankton and the results are represented in Fig. 5. We did not conduct statistical analysis for the non-spherical phytoplankton due to their large diversity of sizes and shapes.

    The volumes of individual phytoplankton are obtained from the measured 3-D RI maps. The accumulated number of voxels in a 3-D RI map of individual phytoplankton having the RI value greater than that of surrounding media was translated to the total volume considering the volume of a unit voxel. Figure 5(a) presents the volume distribution of the spherical and rod-shaped phytoplankton group. The mean values of cellular volumes of individual phytoplankton are 242 ± 130 fL (n = 4) and 239 ± 108 fL (n = 11), for the spherical and the rod-shaped phytoplankton, respectively. The error term means a standard deviation of the parameter. The dry masses of non-aqueous biomolecules [35-37] in individual phytoplankton are determined from the measured high-resolution 2-D quantitative phase images using the synthetic aperture algorithm. The integration of optical path length values over an area of individual phytoplankton is linearly proportional to the total dry mass in the phytoplankton via a proportional constant called RI increment [37], because the RI of biomaterials such as cells and tissues is linearly proportional to the concentration of nonaqueous biomolecules. Because the values of RI increment do not significantly vary among different species of phytoplankton, we used the report value of the RI increment 0.18 mL/g [38] for the analysis. The result is shown in Fig. 5(b). The mean values of the determined dry masses are 36 ± 19 pg and 36 ± 27 pg, for the spherical and the rod-shaped phytoplankton, respectively. Then, the dry mass density of individual phytoplankton is calculated by dividing the total dry mass of phytoplankton by its volume. The result is shown in Fig. 5(c). The mean values of the dry mass densities are 0.16 ± 0.04 pg/fL and 0.15 ± 0.08 pg/fL for the spherical and the rod-shaped phytoplankton, respectively.

    IV. DISCUSSION AND CONCLUSION

    In this paper, we propose and experimentally demonstrate that the QPI techniques provide unique advantages for the study of individual phytoplankton. High-resolution 3-D RI maps, 2-D synthetic aperture images, and emulated DIC images of live phytoplankton are quantitatively and precisely measured. In particular, we show that from the measured quantitative phase images, the structure and biochemical parameters, including phytoplankton volume, total dry mass, and cytoplasmic density are simultaneously retrieved. Furthermore, internal structures of phytoplankton are clearly visualized without using exogenous labeling agents.

    QPI techniques, with their capacity for 3D RI imaging, their potential for generating contrast by intrinsic optical property and their quantitative and non-invasive nature, would be a welcome complement to the existing imaging tools for the study of diverse aspects in phytoplankton biology and biophysics; (1) QPI techniques could be useful for investigating precise morphological and compositional alterations in phytoplankton under diverse environmental conditions, because the RI distributions can serve as an intrinsic optical indicator reflecting the structural and biochemical information. (2) Even though the particular focus of this study is on static 3-D images of phytoplankton, dynamics of 3-D RI tomograms of individual phytoplankton can allow to measure intracellular dynamics of subcellular organelles [39-41] or dynamics fluctuation in cell membrane [42-47] which can provide abundant information about pathophysiology of phytoplankton. (3) In addition, recent advances in QPI techniques can also be further employed to investigate phytoplankton research including super-resolution imaging [48], Fourier transform light scattering technique [49-53], real-time visualization of 3-D RI maps [54], multi-spectral QPI [55-59], and polarization-sensitive QPI [60, 61]. (4) Furthermore, QPI techniques can be accessible to an existing microscope by attaching the recently developed QPI unit [62, 63], which will further extend the applicability of QPI techniques for the study of phytoplankton.

    With QPI techniques, many interesting open questions in phytoplankton biology are now accessible to direct experimental study. Furthermore, the present approach can also be extended for the study of general plankton [17, 64, 65] or zoospores of alga [66]. This new approach has many potential applications. For example, when combined with underwater electronics, 3-D RI imaging of live phytoplankton could be of particular interest to marine microbiologists trying to study biological oceanography [67] and plankton ecology [68]. In addition, 3-D RI tomogram of individual phytoplankton can also be utilized for automated plankton identification [69] or the study of fluid dynamics of plankton [62, 70, 71].

참고문헌
  • 1. Lopez P. J., Descles J., Allen A. E., Bowler C. 2005 “Prospects in diatom research,” [Current Opinion in Biotechnology] Vol.16 P.180-186 google cross ref
  • 2. Stephens D. J., Allan V. J. 2003 “Light microscopy techniques for live cell imaging,” [Science] Vol.300 P.82-86 google cross ref
  • 3. Zernike F. 1942 “Phase contrast, a new method for the microscopic observation of transparent objects,” [Physica] Vol.9 P.686-698 google cross ref
  • 4. Nomarski G. 1955 “Differential microinterferometer with polarized waves,” [J. Phys. Radium] Vol.16 P.9S-11S google
  • 5. Sheppard C., Shotton D., Sheppard C. 1997 Confocal Laser Scanning Microscopy google
  • 6. Giepmans B. N., Adams S. R., Ellisman M. H., Tsien R. Y. 2006 “The fluorescent toolbox for assessing protein location and function,” [Science] Vol.312 P.217-224 google cross ref
  • 7. Popescu G. 2011 Quantitative Phase Imaging of Cells and Tissues google
  • 8. Lee K., Kim K., Jung J., Heo J. H., Cho S., Lee S., Chang G., Jo Y. J., Park H., Park Y. K. 2013 “Quantitative phase imaging techniques for the study of cell pathophysiology: From principles to applications,” [Sensors] Vol.13 P.4170-4191 google cross ref
  • 9. Kim M. K. 2011 Digital Holographic Microscopy: Principles, Techniques, and Applications google
  • 10. Kim M.-K. 2010 “Applications of digital holography in biomedical microscopy,” [J. Opt. Soc. Korea] Vol.14 P.77-89 google cross ref
  • 11. Yi F., Lee C.-G., Moon I.-K. 2012 “Statistical analysis of 3D volume of red blood cells with different shapes via digital holographic microscopy,” [J. Opt. Soc. Korea] Vol.16 P.115-120 google cross ref
  • 12. Jung J., Kim K., Yu H., Lee K., Lee S., Nahm S., Park H., Park Y. 2014 “Biomedical applications of holographic microspectroscopy [Invited],” [Appl. Opt.] Vol.53 P.G111-G122 google cross ref
  • 13. Kim Y., Shim H., Kim K., Park H., Heo J. H., Yoon J., Choi C., Jang S., Park Y. 2014 “Common-path diffraction optical tomography for investigation of three-dimensional structures and dynamics of biological cells,” [Opt. Express] Vol.22 P.10398-10407 google cross ref
  • 14. Malkiel E., Alquaddoomi O., Katz J. 1999 “Measurements of plankton distribution in the ocean using submersible holography,” [Measurement Science and Technology] Vol.10 P.1142 google cross ref
  • 15. Stewart G. L., Beers J. R., Knox C. 1974 “Application of holographic techniques to the study of marine plankton in the field and in the laboratory,” [Proc. Annual Technical Symposium] P.183-188 google
  • 16. Heflinger L., Stewart G., Booth C. 1978 “Holographic motion pictures of microscopic plankton,” [Appl. Opt.] Vol.17 P.951-954 google cross ref
  • 17. Garcia-Sucerquia J., Xu W., Jericho S. K., Klages P., Jericho M. H., Kreuzer H. J. 2006 “Digital in-line holographic microscopy,” [Appl. Opt.] Vol.45 P.836-850 google cross ref
  • 18. Garcia-Sucerquia J., Xu W., Jericho S., Jericho M., Tamblyn I., Kreuzer H. 2006 “Digital in-line holography: 4-D imaging and tracking of micro-structures and organisms in microfluidics and biology,” [Proc. ICO20: Biomedical Optics] P.602613-602613-602619 google
  • 19. Sheng J., Malkiel E., Katz J., Adolf J., Belas R., Place A. R. 2007 “Digital holographic microscopy reveals prey-induced changes in swimming behavior of predatory dinoflagellates,” [Proceedings of the National Academy of Sciences] Vol.104 P.17512-17517 google cross ref
  • 20. Lewis N. I., Xu W., Jericho S. K., Kreuzer H. J., Jericho M. H., Cembella A. D. 2006 “Swimming speed of three species of Alexandrium (Dinophyceae) as determined by digital in-line holography,” [Phycologia] Vol.45 P.61-70 google cross ref
  • 21. Hermand J.-P., Randall J., Dubois F., Queeckers P., Yourassowsky C., Roubaud F., Grelet J., Roudaut G., Sarre A., Brehmer P. 2013 “In-situ holography microscopy of plankton and particles over the continental shelf of Senegal,” [Proc. Ocean Electronics (SYMPOL)] P.1-10 google
  • 22. Javidi B., Moon I., Yeom S., Carapezza E. 2005 “Three-dimensional imaging and recognition of microorganism using single-exposure on-line (SEOL) digital holography,” [Opt. Express] Vol.13 P.4492-4506 google cross ref
  • 23. Debailleul M., Simon B., Georges V., Haeberle O., Lauer V. 2008 “Holographic microscopy and diffractive microtomography of transparent samples,” [Measurement Science and Technology] Vol.19 P.074009 google cross ref
  • 24. Lauer V. 2002 “New approach to optical diffraction tomography yielding a vector equation of diffraction tomography and a novel tomographic microscope,” [Journal of Microscopy] Vol.205 P.165-176 google cross ref
  • 25. Sung Y., Choi W., Fang-Yen C., Badizadegan K., Dasari R. R., Feld M. S. 2009 “Optical diffraction tomography for high resolution live cell imaging,” [Opt. Express] Vol.17 P.266-277 google cross ref
  • 26. Kim K., Yoon H.-O., Diez-Silva M., Dao M., Dasari R., Park Y.-K. 2014 “High-resolution three-dimensional imaging of red blood cells parasitized by Plasmodium falciparum and in situ hemozoin crystals using optical diffraction tomography,” [J. Biomed. Opt.] Vol.19 P.011005-011012 google
  • 27. Alexandrov S., Hillman T., Gutzler T., Sampson D. 2006 “Synthetic aperture Fourier holographic optical microscopy,” [Phys. Rev. Lett.] Vol.97 P.168102 google cross ref
  • 28. Fang-Yen C., Choi W., Sung Y. J., Holbrow C. J., Dasari R. R., Feld M. S. 2011 “Video-rate tomographic phase microscopy,” [J. Biomed. Opt.] Vol.16 P.011005 google cross ref
  • 29. Debnath S. K., Park Y. 2011 “Real-time quantitative phase imaging with a spatial phase-shifting algorithm,” [Opt. Lett.] Vol.36 P.4677-4679 google cross ref
  • 30. Mico V., Zalevsky Z., Garcia-Martinez P., Garcia J. 2006 “Synthetic aperture superresolution with multiple off-axis holograms,” [JOSA A] Vol.23 P.3162-3170 google cross ref
  • 31. Hillman T. R., Gutzler T., Alexandrov S. A., Sampson D. D. 2009 “High-resolution, wide-field object reconstruction with synthetic aperture Fourier holographic optical microscopy,” [Opt. Express] Vol.17 P.7873-7892 google cross ref
  • 32. Lue N., Choi W., Popescu G., Dasari R. R., Badizadegan K., Feld M. S. 2007 “Quantitative phase imaging of live cells using fast Fourier phase microscopy,” [Appl. Opt.] Vol.46 P.1836 google cross ref
  • 33. Wolf E. 1969 “Three-dimensional structure determination of semi-transparent objects from holographic data,” [Opt. Commun.] Vol.1 P.4 google
  • 34. Tam K., Perez-Mendez V. 1981 “Tomographical imaging with limited-angle input,” [JOSA] Vol.71 P.582-592 google cross ref
  • 35. Barer R. 1953 “Determination of dry mass, thickness, solid and water concentration in living cells,” [Nature] Vol.172 P.1097-1098 google cross ref
  • 36. Zangle T. A., Teitell M. A. 2014 “Live-cell mass profiling: An emerging approach in quantitative biophysics,” [Nature methods] Vol.11 P.1221-1228 google cross ref
  • 37. Popescu G., Park Y., Lue N., Best-Popescu C., Deflores L., Dasari R. R., Feld M. S., Badizadegan K. 2008 “Optical imaging of cell mass and growth dynamics,” [Am. J. Physiol. Cell Physiol.] Vol.295 P.C538-544 google cross ref
  • 38. Stramski D. 1999 “Refractive index of planktonic cells as a measure of cellular carbon and chlorophyll a content,” [Deep Sea Research Part I: Oceanographic Research Papers] Vol.46 P.335-351 google cross ref
  • 39. Wang Z., Millet L., Chan V., Ding H., Gillette M. U., Bashir R., Popescu G. 2011 “Label-free intracellular transport measured by spatial light interference microscopy,” [J. Biomed. Opt.] Vol.16 P.026019 google cross ref
  • 40. Diez-Silva M., Park Y., Huang S., Bow H., Mercereau-Puijalon O., Deplaine G., Lavazec C., Perrot S., Bonnefoy S., Feld M. S., Han J., Dao M., Suresh S. 2012 “Pf155/RESA protein influences the dynamic microcirculatory behavior of ring-stage Plasmodium falciparum infected red blood cells,” [Sci. Rep.] Vol.2 P.614 google
  • 41. Chandramohanadas R., Park Y., Lui L., Li A., Quinn D., Liew K., Diez-Silva M., Sung Y., Dao M., Lim C. T., Preiser P. R., Suresh S. 2011 “Biophysics of malarial parasite exit from infected erythrocytes,” [PLoS One] Vol.6 P.e20869 google cross ref
  • 42. Park Y., Best C. A., Auth T., Gov N. S., Safran S. A., Popescu G., Suresh S., Feld M. S. 2010 “Metabolic remodeling of the human red blood cell membrane,” [Proceedings of the National Academy of Sciences of the United States of America] Vol.107 P.1289-1294 google cross ref
  • 43. Park Y., Best C. A., Badizadegan K, Dasari R. R., Feld M. S., Kuriabova T., Henle M. L., Levine A. J., Popescu G. 2010 “Measurement of red blood cell mechanics during morphological changes,” [Proceedings of the National Academy of Sciences of the United States of America] Vol.107 P.6731-6736 google cross ref
  • 44. Park Y., Diez-Silva M., Popescu G., Lykotrafitis G., Choi W., Feld M. S., Suresh S. 2008 “Refractive index maps and membrane dynamics of human red blood cells parasitized by Plasmodium falciparum,” [Proc. Natl. Acad. Sci. USA] Vol.105 P.13730-13735 google cross ref
  • 45. Popescu G., Park Y., Choi W., Dasari R., Feld M., Badizadegan K. 2008 “Imaging red blood cell dynamics by quantitative phase microscopy,” [Blood Cells Mol. Dis.] Vol.41 P.10-16 google cross ref
  • 46. Kim Y., Shim H., Kim K. H., Park H. J., Jang S. S., Park Y. K. 2014 “Profiling individual human red blood cells using common-path diffraction optical tomography,” [Scientific Reports] Vol.4 google
  • 47. Oh S., Fang-Yen C., Choi W., Yaqoob Z., Fu D., Park Y. K., Dassari R. R., Feld M. S. 2012 “Label-free imaging of membrane potential using membrane electromotility,” [Biophys. J.] Vol.103 P.11-18 google cross ref
  • 48. Cotte Y., Toy F., Jourdain P., Pavillon N., Boss D., Magistretti P., Marquet P., Depeursinge C. 2013 “Marker-free phase nanoscopy,” [Nature Photonics] Vol.7 P.113-117 google cross ref
  • 49. Ding H., Wang Z., Nguyen F., Boppart S. A., Popescu G. 2008 “Fourier transform light scattering of inhomogeneous and dynamic structures,” [Phys. Rev. Lett.] Vol.101 P.238102 google cross ref
  • 50. Lee K., Kim H.-D., Kim K., Kim Y., Hillman T. R., Min B., Park Y. 2013 “Synthetic Fourier transform light scattering,” [Opt. Express] Vol.21 P.22453-22463 google cross ref
  • 51. Jo Y., Jung J., Lee J. W., Shin D., Park H., Nam K. T., Park J.-H., Park Y. 2014 “Angle-resolved light scattering of individual rod-shaped bacteria based on Fourier transform light scattering,” [Scientific Reports] Vol.4 google
  • 52. Kim K., Park Y. 2012 “Fourier transform light scattering angular spectroscopy using digital inline holography,” [Opt. Lett.] Vol.37 P.4161-4163 google cross ref
  • 53. Kim Y., Higgins J. M., Dasari R. R., Suresh S., Park Y. K. 2012 “Anisotropic light scattering of individual sickle red blood cells,” [J. Biomed. Opt.] Vol.17 P.040501-040501 google cross ref
  • 54. Kim K., Kim K. S., Park H., Ye J. C., Park Y. 2013 “Real-time visualization of 3-D dynamic microscopic objects using optical diffraction tomography,” [Opt. Express] Vol.21 P.32269-32278 google cross ref
  • 55. Park Y., Yamauchi T., Choi W., Dasari R., Feld M. S. 2009 “Spectroscopic phase microscopy for quantifying hemoglobin concentrations in intact red blood cells,” [Opt. Lett.] Vol.34 P.3668-3670 google cross ref
  • 56. Jang Y., Jang J., Park Y. 2012 “Dynamic spectroscopic phase microscopy for quantifying hemoglobin concentration and dynamic membrane fluctuation in red blood cells,” [Opt. Express] Vol.20 google
  • 57. Jung J., Jang J., Park Y. 2013 “Spectro-refractometry of individual microscopic objects using swept-source quantitative phase imaging,” [Anal. Chem.] Vol.85 P.10519-10525 google cross ref
  • 58. Jung J., Park Y. 2014 “Spectro-angular light scattering measurements of individual microscopic objects,” [Opt. Express] Vol.22 P.4108-4114 google cross ref
  • 59. Jung J., Kim K., Yu H., Lee K., Lee S., Nahm S., Park H., Park Y. 2014 “Biomedical applications of holographic micro-spectroscopy,” [Appl. Opt.] Vol.53 P.G111-G122 google cross ref
  • 60. Wang Z., Millet L. J., Gillette M. U., Popescu G. 2008 “Jones phase microscopy of transparent and anisotropic samples,” [Opt. Lett.] Vol.33 P.1270-1272 google cross ref
  • 61. Kim Y., Jeong J., Jang J., Kim M. W., Park Y. 2012 “Polarization holographic microscopy for extracting spatio-temporally resolved Jones matrix,” [Opt. Express] Vol.20 google
  • 62. Lee S. J., Byeon H. J., Seo K. W. 2014 “Inertial migration of spherical elastic phytoplankton in pipe flow,” [Experiments in Fluids] Vol.55 P.1-9 google
  • 63. Kim K., Yaqoob Z., Lee K., Kang J. W., Choi Y., Hosseini P., So P. T., Park Y. “Diffraction optical tomography using quantitative phase imaging unit,” [Opt. Lett.] google
  • 64. Kim K., Yaqoob Z., Lee K., Kang J. W., Choi Y., Hosseini P., So P. T., Park Y. 2014 “Diffraction optical tomography using quantitative phase imaging unit,” [Opt. Lett.] Vol.39 P.6935-6938 google cross ref
  • 65. Sun H., Benzie P., Burns N., Hendry D., Player M., Watson J. 2008 “Underwater digital holography for studies of marine plankton,” [Philosophical Transactions of the Royal Society A: Mathematical, Physical and Engineering Sciences] Vol.366 P.1789-1806 google cross ref
  • 66. Heydt M., Rosenhahn A., Grunze M., Pettitt M., Callow M., Callow J. 2007 “Digital in-line holography as a three-dimensional tool to study motile marine organisms during their exploration of surfaces,” [The Journal of Adhesion] Vol.83 P.417-430 google cross ref
  • 67. Wiebe P. H., Benfield M. C. 2003 “From the Hensen net toward four-dimensional biological oceanography,” [Progress in Oceanography] Vol.56 P.7-136 google cross ref
  • 68. Dahms H.-U., Hwang J.-S. 2010 “Perspectives of underwater optics in biological oceanography and plankton ecology studies,” [Journal of Marine Science and Technology] Vol.18 P.112-121 google
  • 69. Benfield M. C., Grosjean P., Culverhouse P. F., Irigoien X., Sieracki M. E., Lopez-Urrutia A., Dam H. G., Hu Q., Davis C. S., Hansen A., Pilskaln C. H., Riseman E. M., Schultz H., Utgoff P. E., Gorsky G. 2007 “RAPID Research on automated plankton identification,” [Oceanography] Vol.20 P.172-187 google
  • 70. Durham W. M., Climent E., Barry M., De Lillo F., Boffetta G., Cencini M., Stocker R. 2013 “Turbulence drives microscale patches of motile phytoplankton,” [Nature Communications] Vol.4 P.2148 google
  • 71. Sohn M. H., Lim S., Seo K. W., Lee S. J. 2013 “Effect of ambient medium viscosity on the motility and flagella motion of Prorocentrum minimum (Dinophyceae),” [Journal of Plankton Research] Vol.35 P.1294-1304 google cross ref
이미지 / 테이블
  • [ FIG. 1. ]  Classification tree of representative phytoplankton species which have been studied using holographic techniques with references. Red boxes: species measured in the current study.
    Classification tree of representative phytoplankton species which have been studied using holographic techniques with references. Red boxes: species measured in the current study.
  • [ FIG. 2. ]  Experimental optics setup based on Mach-Zehnder interferometry equipped with a two-axis rotating mirror based on galvanometer. BS: beam splitter; GM: galvanometer mirror; OL: objective lens; M: mirror; CCD: camera.
    Experimental optics setup based on Mach-Zehnder interferometry equipped with a two-axis rotating mirror based on galvanometer. BS: beam splitter; GM: galvanometer mirror; OL: objective lens; M: mirror; CCD: camera.
  • [ FIG. 3. ]  A schematic flowchart depicting the process for various QPI imaging modalities. (a) A set of measured holograms of phytoplankton obtained with various illumination angles. A set of (b) phase and (c) amplitude maps retrieved from the holograms in (a) via the optical field retrieval process. (d) 2-D high-resolution phase image obtained with the synthetic aperture algorithm, (e) emulated DIC image calculated from (d). (f) Reconstructed 3-D RI distribution of the phytoplankton.
    A schematic flowchart depicting the process for various QPI imaging modalities. (a) A set of measured holograms of phytoplankton obtained with various illumination angles. A set of (b) phase and (c) amplitude maps retrieved from the holograms in (a) via the optical field retrieval process. (d) 2-D high-resolution phase image obtained with the synthetic aperture algorithm, (e) emulated DIC image calculated from (d). (f) Reconstructed 3-D RI distribution of the phytoplankton.
  • [ FIG. 4. ]  Representative QPI results of individual spherical phytoplankton (a)-(c), rod-shaped phytoplankton (d)-(f), and non-spherical phytoplankton (g)-(i). (a), (d), and (g) 2-D high-resolution phase images obtained with the synthetic aperture algorithm. Units for colorbars are radians. (b), (e), and (h) emulated DIC images corresponding to (a), (d), and (g). (c), (f), and (i) 3-D RI maps of corresponding phytoplankton. The calculated mean RI <n>, total volume V, and dry mass M of individual phytoplankton, are specified.
    Representative QPI results of individual spherical phytoplankton (a)-(c), rod-shaped phytoplankton (d)-(f), and non-spherical phytoplankton (g)-(i). (a), (d), and (g) 2-D high-resolution phase images obtained with the synthetic aperture algorithm. Units for colorbars are radians. (b), (e), and (h) emulated DIC images corresponding to (a), (d), and (g). (c), (f), and (i) 3-D RI maps of corresponding phytoplankton. The calculated mean RI <n>, total volume V, and dry mass M of individual phytoplankton, are specified.
  • [ FIG. 5. ]  Statistical analysis of quantitative parameters in QPI results of phytoplankton in spherical and rod shapes. A box-and-whisker plot of (a) volume, (b) dry mass, and (c) cytoplasmic density of spherical and rod-shaped phytoplankton are represented. Boxes, median values with upper and lower quartiles; whiskers, range. The spherical and rod-shaped phytoplankton groups contain 4 and 11 samples, respectively.
    Statistical analysis of quantitative parameters in QPI results of phytoplankton in spherical and rod shapes. A box-and-whisker plot of (a) volume, (b) dry mass, and (c) cytoplasmic density of spherical and rod-shaped phytoplankton are represented. Boxes, median values with upper and lower quartiles; whiskers, range. The spherical and rod-shaped phytoplankton groups contain 4 and 11 samples, respectively.
(우)06579 서울시 서초구 반포대로 201(반포동)
Tel. 02-537-6389 | Fax. 02-590-0571 | 문의 : oak2014@korea.kr
Copyright(c) National Library of Korea. All rights reserved.