Lunar surface has gone through various events that developed its current shape. Among lunar topographies, the lunar crater rays developed from impact craters and their ejecta have been of interest to scientists for a long time. In order to find out the composition of these lunar features, analyses were performed on the samples obtained from the lunar landing sites and other sites nearby, to determine the lunar composition (Turkevich 1973; Wieczorek et al. 2006). However, after application of remote sensing technology, it was possible to develop a map of the composition and mineral distribution of the entire lunar surface, using the data from satellites orbiting the Moon. This technology provides several advantages: fast and easy data acquisition, comparison of relative ages using reflectance, and enabling investigation of wide areas. Remote sensing has become an essential part of planetary exploration and the more detailed investigations are being performed for topographic features from large scales (lunar highlands or lunar maria) to the scale of lava tubes fit for human survival (Hong et al. 2014)
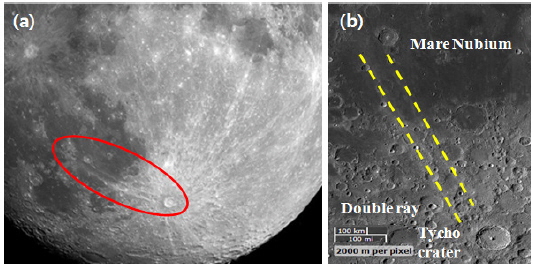
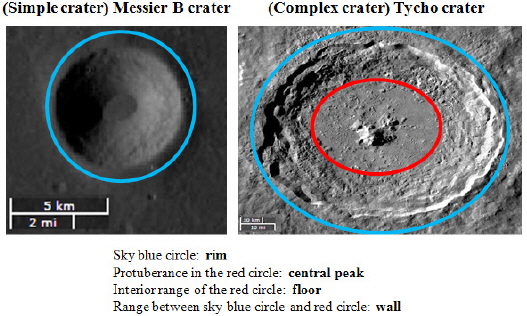
Among the topographic features of the lunar surface, impact craters are formed by the collision of stellar bodies with the lunar surface that result in deep cavities (Fig. 1(a)). These craters are located all over the lunar surface including both highlands and maria, and they have various shapes depending on the impact object and several parameters, including the direction of impact, size, magnitude, speed, and angle. Most craters are classified as either simple or complex craters (Fig. 2) according to their complexity of structure.
Both simple and complex craters have a rim, which is located at the boundary of the impact crater and its surroundings. However, complex craters are distinguished by the existence of floor, wall, rim, and central peak; the floor indicates the flat surface formed after the impact of an object on the lunar surface. The accumulation of layers formed on the periphery of the floor due to the impact is called the wall. The protuberance formed by the upward reaction of lunar surface due to the impact is called the central peak.
Immediately after formation of the impact crater, whitish stretched lines in a spoke-line pattern also occur. These, the mixture between the object’s remnant and the lunar surface’s remnant, are called the lunar rays. In general, these take the shape of spokes around the impact crater; however, the shape might change due to effects from nearby craters (Pieters et al. 1985; Hawke et al. 2004). In the past, the origin of lunar rays has been studied using spectral reflectance data obtained from Optical MATurity (OMAT) values (Grier et al. 2001). This approach enables determination of the relative ages, and variation in mature soil, of an area of investigation; thus, it is appropriate for studying the origin f lunar rays (Lucey et al. 2000).
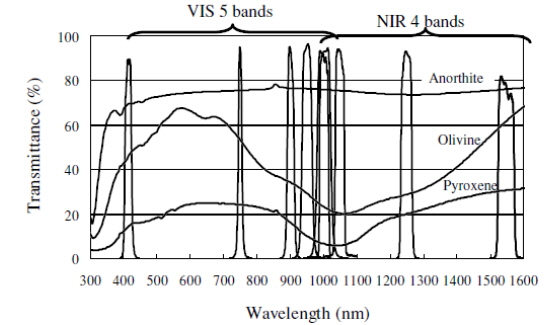
The wavelengths measured to provide optical maturity indicate differences in the crystal structure of a compound, giving each oxide a characteristic spectral wavelength of absorption, reflectance, and transmittance. Thus, it is possible to estimate the distribution of various types of rock at a certain site and to calculate their optical maturity as indicated in Fig. 3 (Grier et al. 2001; Ohtake et al. 2008; http://www.lpi.usra.edu/lunar/missions/clementine/ data/).
In this paper, the investigation was performed for the double ray which indicates two lines stretched in parallel from the Tycho crater (Lat. 43.35° S / Lon. 11.32° W) to the third-quadrant of Mare Nubium and for the craters between the lines (Fig. 1(b)).
For research on the origin of lunar rays, the wavelength data required to calculate the optical maturity were obtained from image editing and analysis tool (Exelis Visual Information Solution: ENVI), the data of the Multiband Imager (MI) onboard the Japanese lunar probe called the SELenological and ENgineering Explorer, or SELENE (Kodama et al. 2010). The equation to determine optical maturity (Eq. (1)) shown below is cited from Lucey et al. (2000).

where x0 is the minimum value of 750 nm reflectance and y0 is the maximum value of the 950 nm/750 nm ratio. Investigation of the study area was performed based on the data indicating the 750 nm reflectance, 950 nm/750 nm reflectance ratio, and optical maturity image file obtained from ENVI.
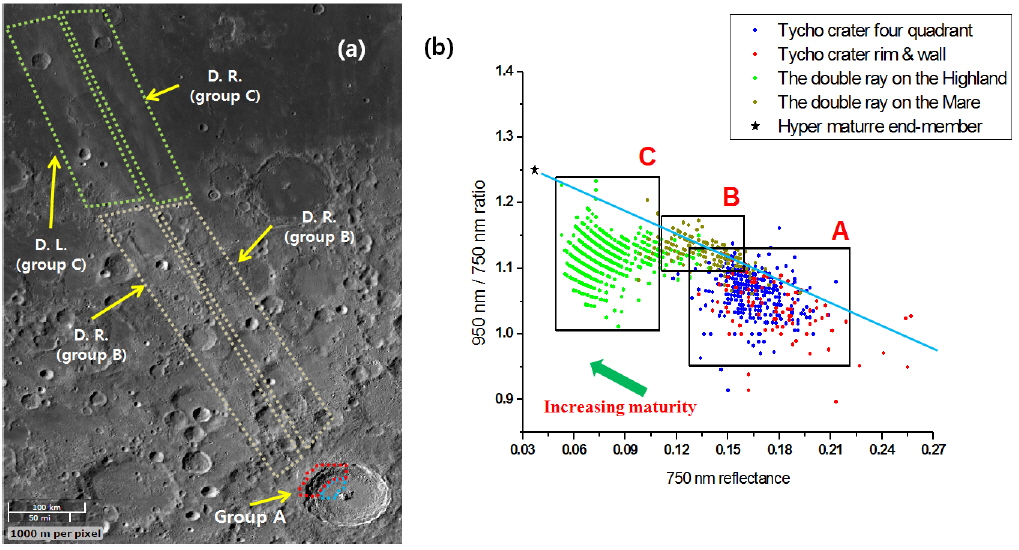
Fig. 4(a) and (b) display the Tycho crater and the double ray, as well as the 750 nm reflectance plotted as a function of the 950 nm/750 nm ratio. In part (a), DL refers to the left of the double rays, and DR refers to the right one. Correspondence is indicated between the reflectance distribution data sets Group A, B, and C (Fig. 4(b)), and the relevant parts of the study area. Group A data (the dotted red and blue polygons in Fig. 4(a)) indicate the interior of the Tycho crater, Group B data (the dotted dark yellow polygons in Fig. 4(a)) represent the highlands, and Group C data (the dotted green polygons in Fig. 4(a) correspond to Mare Nubium, which contains the double ray. The difference in reflectance among Group A, B, and C is due to the partial difference in chemical composition. Comparison between the actual compositions of highlands and lunar maria reveals that the highlands are richer in Ca and Al by about 4% and 10%, respectively, than the lunar maria. In contrast, the lunar maria are richer in Fe and Ti by about 9% and 3%, respectively, than the highlands (Turkevich 1973).
Thus, in Group C, there is a difference in ratio range up to 0.2. Comparison of Group A and Group B indicates that the compositions of Group A show as newer and brighter than those of Group B, due to material exposed from the lunar subsurface. The 750 nm reflectance is higher in Group A than in Group B, except for a small range where reflectance of the two is the same. The soil optical maturity or OMAT is in the order of Group C > B > A. The relative age of the lunar surface determined by reflectance has the same sequence as the soil maturity.
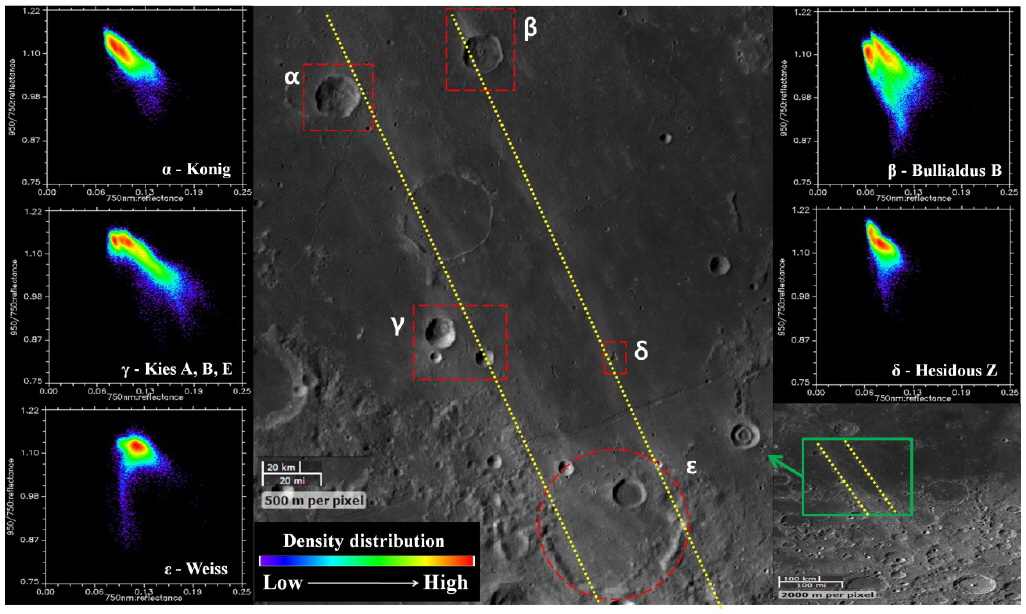
Fig. 5 shows craters that occur along the DL and DR. The 750 nm reflectance is plotted as a function of the 950 nm/750 nm ratio for these craters. The study areas are indicated by regions within red-dashed lines, and the double ray is indicated by the two yellow dotted lines. The index color in these graphs indicates the density slice of data distribution and as the color changes from red to violet, the density decreases. The Weiss crater, which extends to both the DL and the DR, showed a reflectance range similar to that of Group B in Fig. 4, but showed a huge difference in the 950 nm/750 nm ratio: the reflectance range of the Weiss crater was 0.84–1.17, while that of Group B was 1.1–1.75. Based on this, it was deduced that the area of investigation includes a highland region and part of a mare region, and that the material of highland region covers the part of mare region. In addition, in the mare region that includes DL, the reflectance distributions of Kies A, B, and E (the solid region of red and yellow) belong to Group C in Fig. 4. The red part of the graph corresponds to a mare region that occupies a large portion of the dotted study area. The high reflectance values are believed to be caused by ejecta generated when the Tycho crater was formed. It was found that the reflectance distributions measured in the interior of the Hesiodus Z crater (along the DR) were similar to those of the mare region (Group C). Moreover, Konig crater along the DL, and Bullialdus B crater along the DR, had similar ranges of 750 nm reflectance distribution on the horizontal axis. Investigation of high density regions of the two craters (reddish regions) reveals the trend of being clustered to Group C in Fig. 4.
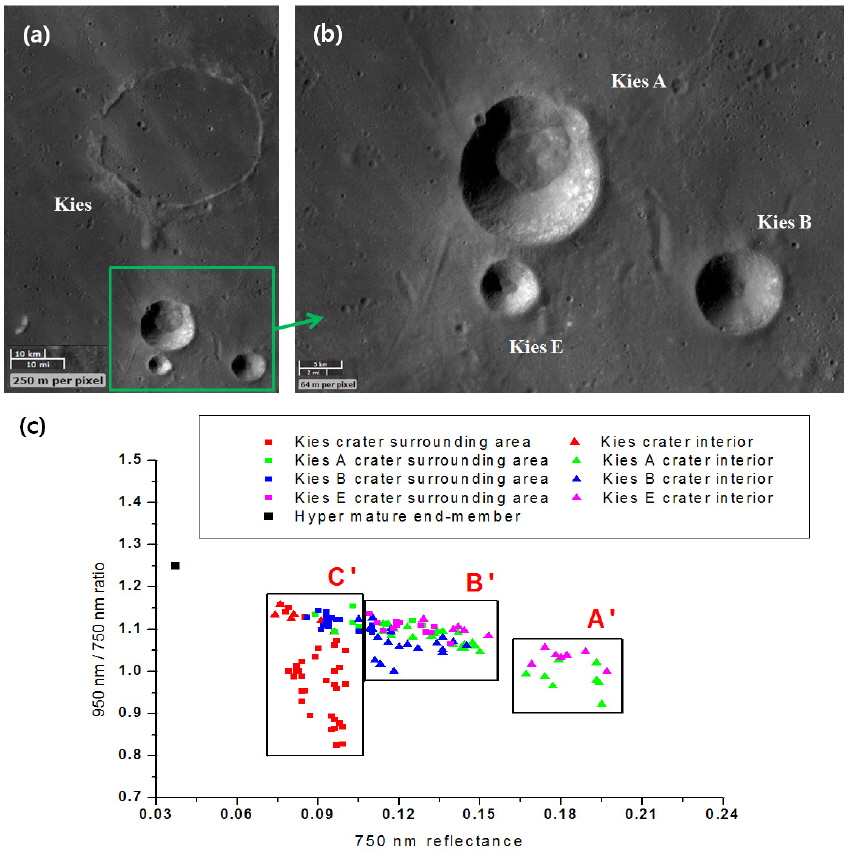
Fig. 6(a) and (b) show the images of the Kies crater along the DL (mentioned in Fig. 4(a)) and Kies A, B, and E craters, and their surroundings. Fig. 6(c) shows the reflectance measured inside of Kies A, B, and E craters and the surroundings. In this graph, Group A′ (the interior of Kies A and E craters), B′ (the interior of Kies A, B, and E craters and the surroundings of Kies A and E craters), and C′ (the interior of Kies crater and the surroundings of Kies A and B craters) belong to data Group A, B, and C, respectively, in Fig. 4. The interior of Kies A and E craters, which have higher reflectance distribution compared to the surroundings in Group A′ (Fig. 6), is believed to have been formed by the ejecta from Tycho crater. The reflectance distributions of Group B′ are lower than those of Group A′ on the horizontal axis. However, Group B′ also shows brighter reflectance distributions than those of the surroundings. These are believed to be caused by ejecta covering the highlands from the Tycho crater (Hawke et al. 2004). Meanwhile, on the vertical axis of Fig. 6(c), Group C′ show a huge difference in reflectance distribution compared to Group A′ and Group B′. The graph shows that the iron content is higher for higher values of the 950 nm/750 nm ratio, at the same 750 nm reflectance of the horizontal axis. Generally, the iron content should be higher in a mare region than in a highland region, but the graph shows lower reflectance in the surroundings. This is confirmed by the fact that the paths of the double ray remain within the Kies crater. This could be caused by the fact that the area surrounding the Kies crater is covered by the materials ejected from the Tycho crater. These materials could be younger than the inner materials of the mare region in the Kies crater. The wide range of the 950 nm/750 nm ratio of Group C′ is thus due to the mixture of these two materials. Investigation of the results of comparison of Fig. 6(b) and the lunar geological map shows that the Kies A and E craters are classified as Ec (bright materials ejected from the rim of a large crater) and Kies B crater is not so classified (Geological map of the nearside of the Moon, US Geo. Survey Map I-703, http://www.lpi.usra.edu/resources/mapcatalog/usgs/I703/). In Fig. 4(a), when the brightness of the reflectance is correlated to the relative ages, the relative ages of Kies A crater and Kies E crater are similar; however, it is estimated that the relative age of Kies B crater is older.
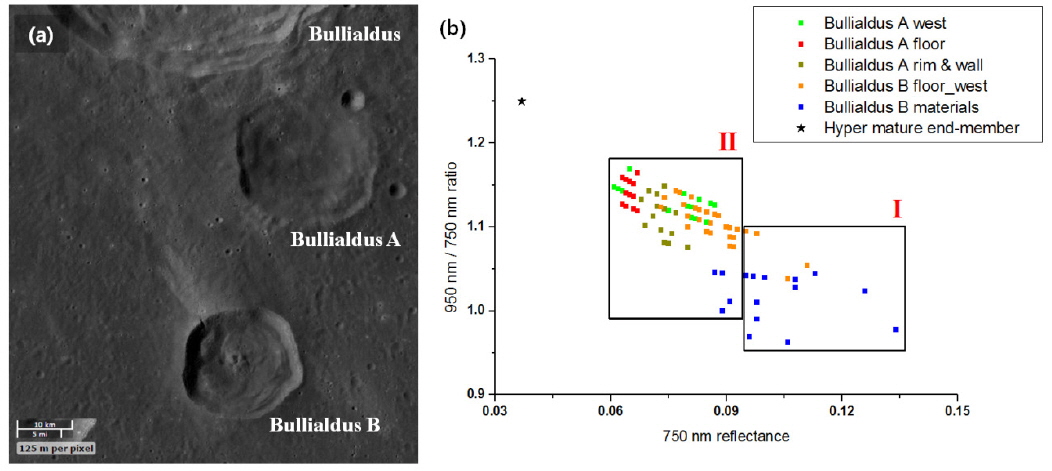
Fig. 7(a) shows the images of the Bullialdus A and B craters and the Bullialdus crater to the north, and Fig. 7(b) shows the reflectance of the Bullialdus A and B craters, and the surroundings. In Fig. 7(b), Group II represents the western floor, rim, and wall of Bullialdus A and the western side of the interior of Bullialdus B, while Group I indicates part of the western side of the interior of Bullialdus B and the western region of the surroundings. Group I of Fig. 7, belongs to Group B of Fig. 4, which corresponds to the reflectance distribution of a highland area. Based on this analogy, the reflectance of Group I must have been affected by the ejecta from highlands after the formation of the Tycho crater. Also, the reflectance of Bullialdus A in Group II (Fig. 7) belongs to Group C of Fig. 4. Moreover, the reflectance (dark yellow green dots) of the interior (rim and wall) of Bullialdus A crater are similar to those of the mare region. According to comparison with the lunar geological map, these are classified as the ejecta (Ic) from a small crater (Geological map of the nearside of the Moon, US Geo. Survey Map I-703, http://www.lpi.usra.edu/resources/mapcatalog/usgs/I703/).
There are several advantages in obtaining the reflectance data through remote sensing: enabling topographical analysis of study sites, reducing the time needed for geological investigation, and enabling investigation of wide areas at a time. In this paper, an investigation was performed for sites from the scale of the double ray located in the northwest of the Tycho crater, to the scale of a typical crater, based on the degree of reflectance. It was found that the trend of reflectance distribution was similar for these sites. Also, the origins of crater groups in these sites could be deduced using these data. In addition, it was possible to provide criteria for determination of whether the measured reflectance was obtained from the crater itself, or from ejecta generated by the impact forming the Tycho crater.
According to the lunar exploration plan of Korea, a lunar orbiter is to into a lunar orbit and a lunar probe is to land on the lunar surface in early 2020. For this purpose, topographical investigation of the lunar surface from the orbiter is an essential element of finding landing sites or investigating the surrounding topography. In future studies, investigation of topographical characteristics will be performed based on reflectance. Also, various aspects of research on the origin and mechanism of the double ray will be performed by searching for traces of the geomorphological evolution of the lunar surface.