Since the measurement of aberrations of the human eye using the Shack-Hartmann (SH) sensor was introduced twenty years ago, aberration has been widely used in ophthalmology. [1, 2] Nowadays, the implantation of an aspheric intraocular lens (IOL) has become popular after cataract surgery, as well as wavefront correction in refractive surgery [3, 4]. Theoretically, an aspheric IOL should improve retinal image quality by compensating corneal spherical aberration (SA), which is the major cause of decreasing image quality and is usually positive in eyes with cataracts [4-8]. However, there were some debates about the benefits of aspheric IOL use and also disagreements regarding the benefits of postoperative residual SA in patients with aspheric IOLs. Nowadays, commercially available aspheric IOLs have various SAs; hence IOLs with specific SAs can be targeted for individual patients [9-11]. However, there is no clear target SA for optimal visual outcome [12]. Some studies indicated that complete correction of SA improved visual performance, but some model-eye studies could not indicate best visual quality for a fully corrected SA [12-15]. Inter-subject variability and interaction of the different sources of optical aberration may also make it difficult to determine the ideal SA of an IOL [16, 17].
A previous adaptive optics simulation study reported quantifiable results after full correction of SA [14]. However, no report has yet indicated how many patients achieved improved visual quality following full correction of SA or decreased visual quality. Therefore, we investigated what percentage of the patients would have visual improvement following full correction of SA (zero SA) and analyzed the optimal SA after cataract surgery.
Charts of patients who underwent phacoemulsification with implantation of spherical monofocal IOLs (AR40e, Abbott Medical Optics, Inc., Santa Ana, CA) at the Asan Medical Center from April 2007 to February 2010 were reviewed. All procedures were performed by the same surgeon (H. Tchah). Inclusion criteria were uneventful phacoemulsification with implantation of AR40e, and clinically well-positioned IOL in the capsular bag. Exclusion criteria were improper aberration data with less than 5 mm pupil size, post-operative decentered or tilted IOL, posterior capsular opacification (based on slit lamp examination) within the follow-up period, previous refractive surgery, or other corneal diseases.
2.2. Manipulation of Higher-order Aberration
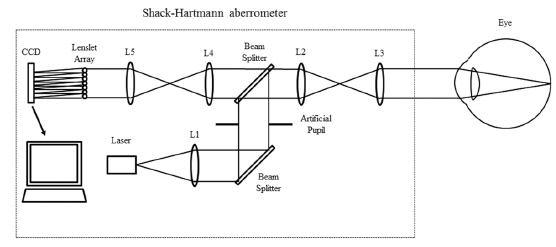
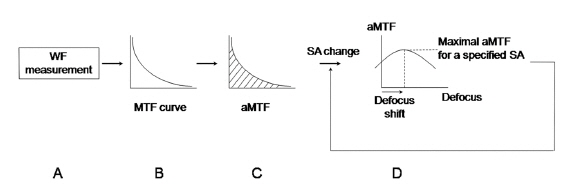
HOAs were measured with ZywaveTM (Bausch & Lomb, Rochester, NY) using the SH principle after using a mydriatic agent (0.5% tropicamide and 0.5% phenylephrine, Mydrin-P®, Santen, Osaka, Japan). In brief, a polarized light source produced a small spot on the retina. Diffusely reflected light went through the lens and cornea and was relayed to the plane of the lenslet array. A CCD sensor recorded the spot array pattern and ocular aberration was reconstructed with the relative spot displacements (Fig. 1) [1, 2]. HOAs were normalized with a pupil size of 5 mm. For computation of the MTF, the monochromatic PSF was computed by applying a Fourier transform to the pupil function using a program developed with MATLAB software (MathWorks, Natick, MA), as described previously [18]. The area under the MTF curve (aMTF) was the summation of MTFs according to spatial frequencies, which provided overall information on the ocular optical quality [19]. The aMTF was calculated up to 60 cpd - the highest detectable spatial frequency for human eyes [20].
To simulate the correction of SA, Zernike coefficients of SA in each subject were modified from -0.2 ㎛ to +0.2 ㎛ with an interval of 0.01 ㎛. At each specific SA, through-focus aMTF were calculated with the range of defocus from -2.0 D to +2.0 D with an interval of 0.1 D. The maximal aMTF was the maximum value of the aMTF according to the changes of SA and defocus, which with the maximal aMTF were recorded (Fig. 2). The calculated aMTFs with innate SA and those after full correction of innate SA were analyzed. According to the differences between calculated aMTFs before and after full correction of innate SA, the total group was divided into two groups, eyes with increased aMTF (Group 1) and eyes with decreased aMTF (Group 2).
All data were analyzed using SPSS version 14.0 software (SPSS Inc., Chicago, IL). Continuous variables were described as means and standard deviations, and compared using the Mann-Whitney U test and repeated ANOVA.[21] A
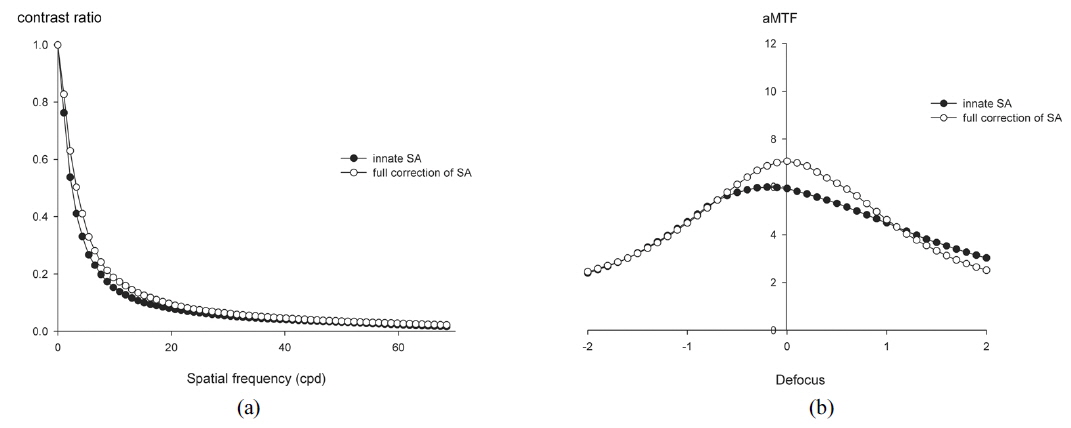
We examined 64 eyes from 51 patients. Table 1 shows the demographic and postoperative refractive data. The average target spherical equivalent (SE) was -1.02 ± 1.21 D and the average absolute prediction error (the difference between target SE and postoperative SE) was 0.16 ± 0.47 D. Full correction of innate SA increased the MTF at spatial frequencies less than 22 cpd with statistically significant differences (Mann-Whitney U test,
[TABLE 1.] Demographic characteristics and postoperative refractive errors and visual acuity
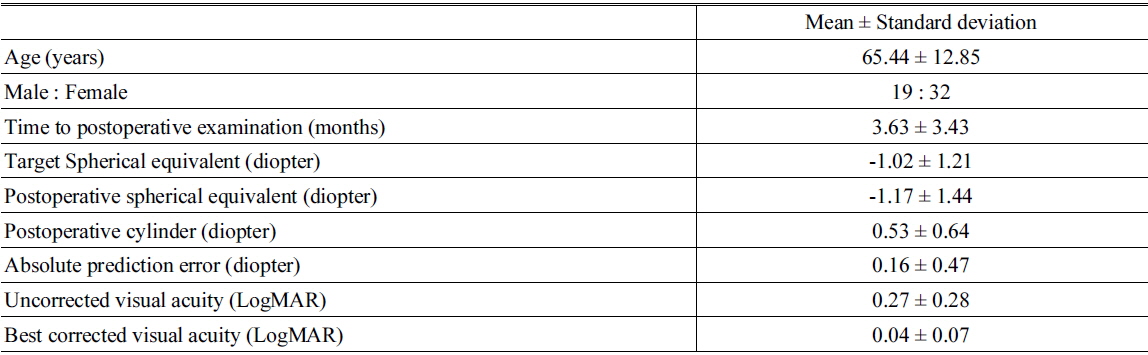
Demographic characteristics and postoperative refractive errors and visual acuity

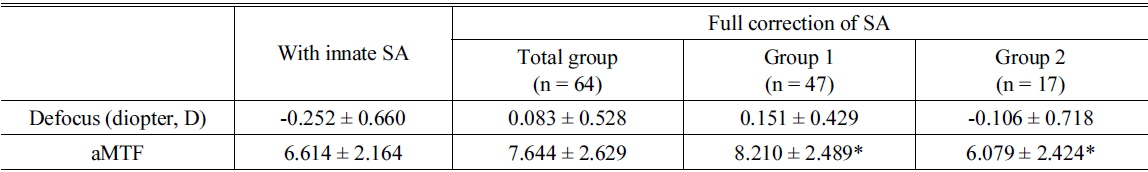
Simulated best optical quality and matched defocus for the best area under the modulation transfer function curve after full correction of spherical aberration
Forty-seven eyes (73.4% of 64 eyes) had increased aMTF after full correction of the SA (Group 1, Table 2). These patients had a mean hyperopic shift of 0.40 ± 0.63 D (from -0.252 ± 0.660 D to 0.151 ± 0.429 D) and an average 22.4% increase of the aMTF (from 6.614 ±2.164 to 8.210 ± 2.489, Table 2).
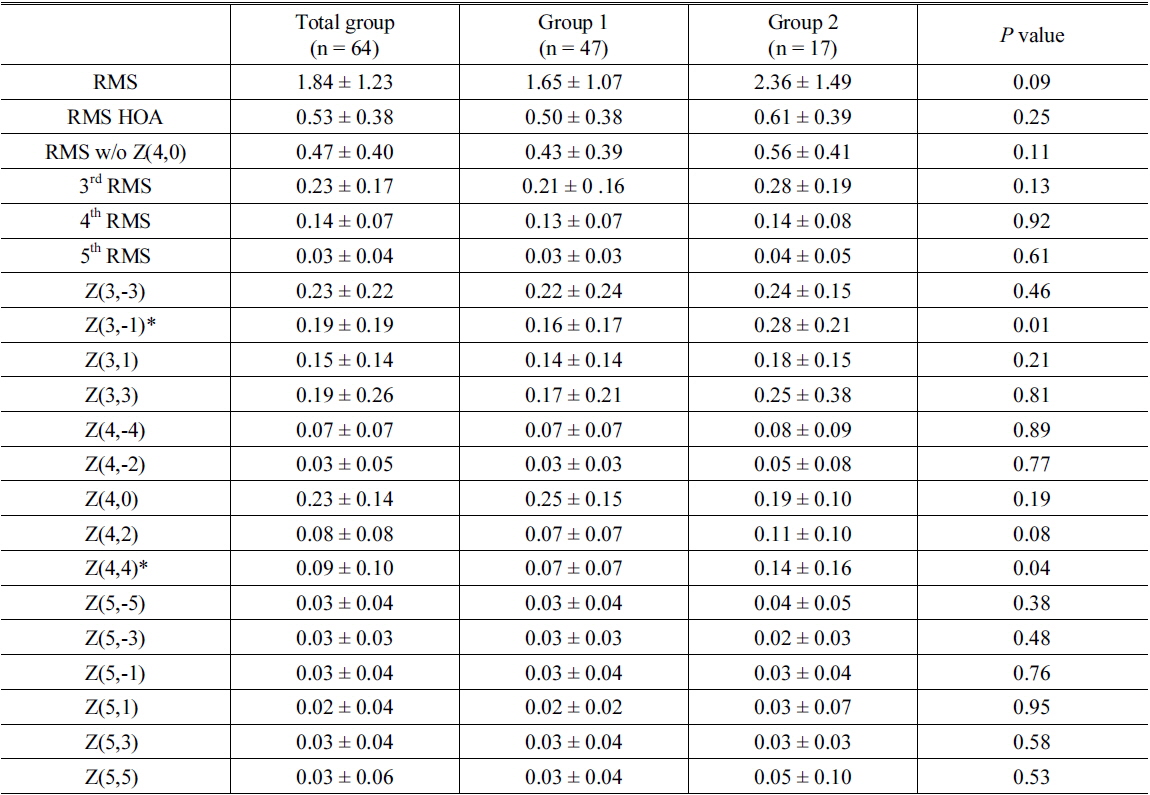
Table 3 shows the root mean square (RMS) of postoperative aberration in micrometers for all eyes, eyes with increased aMTF (Group 1), and eyes with decreased aMTF (Group 2) after full correction of innate SA. Group 2 had statistically significant differences at Z(3,-1) (vertical coma,

Absolute values of postoperative aberration (μm, 5mm pupil size) in eyes (Group 1, n = 47) with increased area under modulation transfer function curve (aMTF) and eyes with decreased aMTF (Group 2, n =17) after full correction of innate spherical aberration
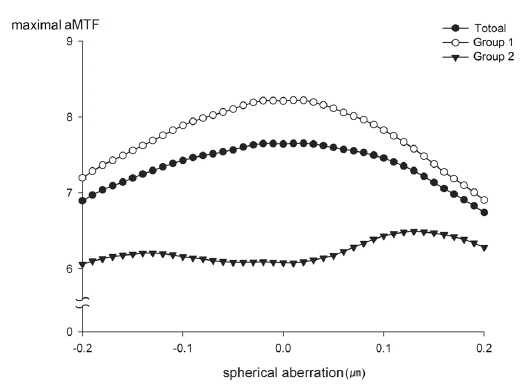
Figure 4 shows that the average of maximal aMTF through the range of defocus at each spherical aberration. For all eyes and Group 1, the maximal aMTF was at a SA of 0.02 μm and 0.01 μm, respectively (aMTF = 7.66 ± 2.69 and 8.22 ± 2.54, respectively). However, Group 2 had a maximal aMTF at a SA of 0.13 μm (aMTF = 6.49 ± 2.63).
In the present study, we investigated optical improvement after correction of SA under a relatively realistic postoperative situation. We simulated postoperative wavefront aberrations of eyes through the use of spherical IOLs in which there were no preoperative problems or intraoperative/postoperative complications (e.g., clinically detectable tilt or decentration of IOL) which could offset the possible benefits of an aspheric IOL [3, 4, 22, 23]. In a previous pilot study (not published), we measured HOAs of IOLs using an optical bench, and found that the HOAs of the AR40e IOL was almost zero. Therefore, we simulated the postoperative HOAs of our eyes with the AR40e IOLs. Aberration-free IOLs are known to be less sensitive to tilt and decentration, which might minimize the HOAs induced by the IOL itself [3, 24].
Our results indicate that optical performance as a function of spatial frequency increased after full correction of innate SA at all spatial frequencies (Fig. 3). One of the strengths of this study is that objective measurements allowed us to divide subjects into two groups: those with increased aMTF, and those with decreased aMTF. Most previous studies on the benefits of aspheric IOLs involved comparisons between spherical IOLs and aspheric IOLs or a customized selection of various aspheric IOLs [4, 6, 10, 12-14, 25-28]. Some studies noted that the benefits from aspheric IOLs may be limited or diminished by inter-subject variability and interaction between HOAs [12, 16, 23]. However, no previous studies have established conditions that actually worsen optical performance. Our results indicate statistically significant differences between eyes with increased aMTF and those with decreased aMTF in the vertical coma and tetrafoil (Table 3). Previous studies found that corneal SA and coma did not change significantly with corneal incision and that other HOAs also did not change, especially after micro-incision cataract surgery [15, 29]. Therefore, it could be assumed that relatively high preoperative corneal HOA might be a negative predictive factor of optical outcomes using aspheric IOLs.
On the other hand, there are differences of opinion regarding the optimal postoperative SA. Our results indicate that a postoperative SA near zero appears to provide the best optical performance (Fig. 4). This result is supported by previous studies that used customized correction of SA to improve optical quality [5, 13, 25, 30]. However, other previous clinical and experimental studies suggested that other targets for postoperative SA provide the best optical quality [10, 12, 15]. Nonetheless, the present study has some advantages over these other previous studies. We simulated optical quality with postoperative wavefront data and an AR40e IOL that had an SA of almost zero, which could more closely mimic the actual clinical situation. Moreover, the interval of our simulated SA was 0.01 μm, which presumably provides improved accuracy.
The eyes with decreased aMTF had slightly higher optical quality at an SA of +0.13 μm through the range of SAs. The optical quality was not totally concordant with the reduction of SA in Group 2. This might be due to an interaction of HOAs [16]. Thus, use of customized full correction of SA may improve optical quality, but a small residual SA might provide more benefits over full correction, especially for patients with high values of radially asymmetric optical components such as vertical coma.
Based on our results, the analysis of preoperative corneal aberration would be helpful in using aspheric or aberration free IOLs to improve optical outcomes. Though one of the considerations was the possibility of surgically induced HOAs, previous studies indicated that recent micro-incision cataract surgery led to no or minimal change of surgically induced HOAs [9, 29, 31]. This was why we attempted to simulate the postoperative ocular aberrations as the most clinically relevant condition instead of the preoperative corneal aberrations calculated on the basis of corneal topography. Another consideration is that we only included patients with AR40e IOLs who had uneventful implantations and no postoperative complications. In clinical practice, this might not exclude all influences in postoperative ocular aberrations of the IOL. However, aberration-free IOLs are known to be less sensitive to tilt and decentration, which might minimize the HOAs induced by the IOL itself, which was another reason why we attempted to simulate postoperative ocular aberrations as the most clinically relevant condition [3, 24].
To our knowledge, this study is the first report to demonstrate the optimal SA by use of simulated postoperative clinical wavefront data and to identify characteristics of eyes that might have some worsening of optical quality after full correction of SA. We revealed that seventeen eyes (26.6 %) had decreased aMTF after full correction of the SA and statistically significant differences at Z(3,-1) (vertical coma,

![Schematic diagram of the measurement of aberrations of the human eye using the SH sensor [2].](http://oak.go.kr/repository/journal/15914/E1OSAB_2015_v19n4_403_f001.jpg)