Hemiplegia is a common symptom following stroke [1]. The most significant symptom of hemiplegia following stroke is problems with movement due to muscle tension. Alleviation and evaluation of muscle tension is important in rehabilitation of hemiplegia patients [2]. Two terms are commonly used to identify muscle tension: muscle tone and muscle spasm. Muscle tone is defined as the resistance to a passive stretch that reflects the relative influence of the mechanical-elastic characteristics and reflexive drive to the muscle. Muscle spasm is defined as the velocity-dependent resistance to passive stretching, and is accompanied by increased deep tendon reflexes [3, 4].
Several tools have been used to treat muscle tension, including drugs, Botox, electrical stimulation therapy, and surgery. However, these methods may also affect normal muscle [5, 6]. Laser therapy is a novel therapy which has been used to treat rheumatoid arthritis, chronic pain and muscle strain [7]. Laser therapy can be divided into two categories: low-level laser therapy (LLLT) and high-intensity laser therapy (HILT), depending on the laser fluence. Lopes-Martins
There are several methods that can be used to evaluate muscle tension, including the modified Ashworth scale (MAS), tone assessment scale (TAS), electromyography (EMG), and the Myotonometer. The MAS is a six-point ordinal scale for grading the resistance encountered during passive muscle stretching. It includes a 1+ scoring grade to indicate resistance through less than half of the movement [14]. Because MAS does not take account of the relation between abnormal tone and posture and the associated reaction, TAS was developed to address these issues that may be important with the measurement of tone and its impact on function [15-17]. However, Gergson
We have previously [21] reported a real-time monitoring system using the Myotonometer for HILT, and demonstrated a muscle tension release effect in normal subjects. The muscle tension is characterized using the muscle hardness; i.e., [22]

where I is the influence coefficient, d is the radius of the Myotonometer rod, μ is Poisson’s ratio,
The subjects were recruited from the Oriental Medical Clinic at WonKwang University Oriental Medicine Hospital in Gwangju, and ethical approval was obtained from the Ethics Committees of the hospital. All patients had hemiplegia following a stroke, and had MAS grades in the range 1-2. The mean age of the subjects was 58.4 years (the age range was 37-75 years), and they comprised two males and three females. Table 1 lists data describing the subjects of this study.
[TABLE 1.] Data on the patients
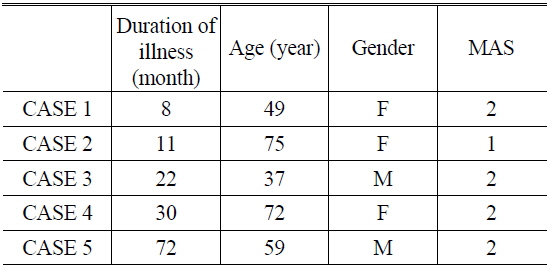
Data on the patients
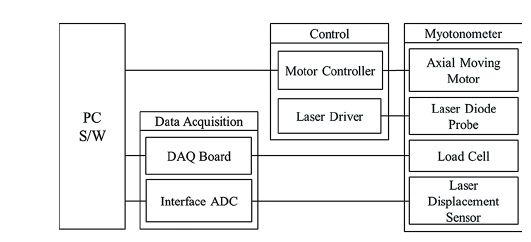
2.1. Real-time Monitoring System
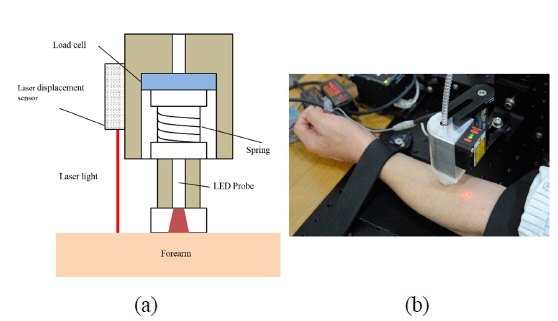
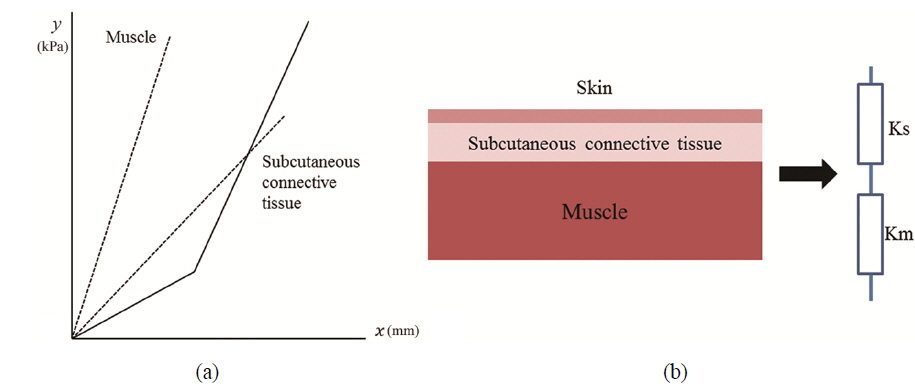
We have previously combined HILT and the Myotonometer to create a real-time feedback monitoring and treatment system [21]. The composition of the monitoring system and HILT-Myotonometer system is shown schematically in Figs. 1 and 2. Figure 1 shows the moving motor and moving controller, which were used for linear control of the velocity of the Myotonometer during the measurements. The 808-nm high-power diode laser had a spot size of 0.07 cm2, and the irradiance was 4.28 W/cm2; the beam was focused using a bi-concave lens to vary the spot size in the range 0.07-1 cm2 to irradiate a larger area, and increase the therapeutic effect. The laser diode probe was placed in the center of the Myotonometer, which enables us to measure muscle tension continuously and in real-time during the laser therapy. When the Myotonometer was pressed vertically onto the patient’s skin, a load cell (LTH 3000, FUTEK, USA) was used to measure the pressure, and a laser displacement sensor (ZX-LD40, OMRON, JAPAN) was used to measure the distance. To reduce error incurred by the concave depression, which may result when the load cell is close to the surface of the skin, the load cell was placed 5 cm from the laser displacement sensor [22]. The output signals were collected using a data acquisition board (USB-6210, National Instruments) interfacing with an analog-to-digital converter, and the muscle stiffness was calculated from the ratio of the changes in distance and pressure. After applying pressure to the surface of the skin, the displacement was measured to determine hardness of the muscle, as shown in Fig. 3(a). The pressure from the Myotonometer was applied separately to the subcutaneous connective tissue and the muscle tissue. In the early stages of the pressure-displacement curve, we find a relatively small gradient, which corresponds to a small hardness of the soft subcutaneous connective tissue. During the later stages, however, the hardness increased, due to the larger stiffness of the muscle tissue. This behavior can be described using a two-layer spring model, as shown in Fig. 3(b) [23]. With this two-layer spring model, the force-displacement relation in the early stages of displacement is given by
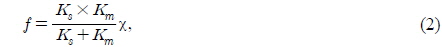
where f is the force due to the pressure applied at the terminal, Ks is the stiffness of skin and subcutaneous connective tissues, Km is the stiffness of the muscle, and
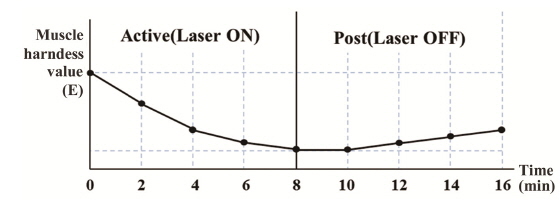
The left forearm was investigated. All patients underwent both the active and post-treatment tests. An 808-nm diode laser (CW mode, 0.07-cm2 spot size, and average power of 4.28 W/cm2) was used during the active test, and the patients relaxed without any stimulus during the post-treatment test. Each phase of the test lasted 8 minutes, and the force and displacement were measured every 2 minutes during treatment, as shown in Fig. 4. The post-treatment test was performed to monitor the relief of muscle tension and the duration of the effect following HILT. This may supplement the positive effects of laser treatment. To determine the location of the Myotonometer probe, a circle corresponding to the diameter of the probe tip was marked on the surface of the skin.
2.3. Muscle Tension Measurements
To evaluate a degree of muscle tension, the gradient of the force-displacement graph and the muscle hardness E were analyzed. In the force-displacement curves, the force was determined based on the input voltage of the load cell, 21 and the displacement was found to increase in proportion to this force, which was applied to the subcutaneous tissue; however, the gradient of the force-displacement curve depended on the degree of muscle tension. Using the measured force and displacement during laser treatment, we calculated the muscle hardness using Eq. (1), which represents the change in muscle tension as a function of time.
To establish treatment procedure and to evaluate the results, it is important to accurately monitor the variation in the skeletal muscle. Conventional evaluation methods, including MAS and EMG, are generally reliable; however, they do not provide information on the muscle tension [24]. The experiments described in the study were designed for
3.1. Force-displacement Measurements
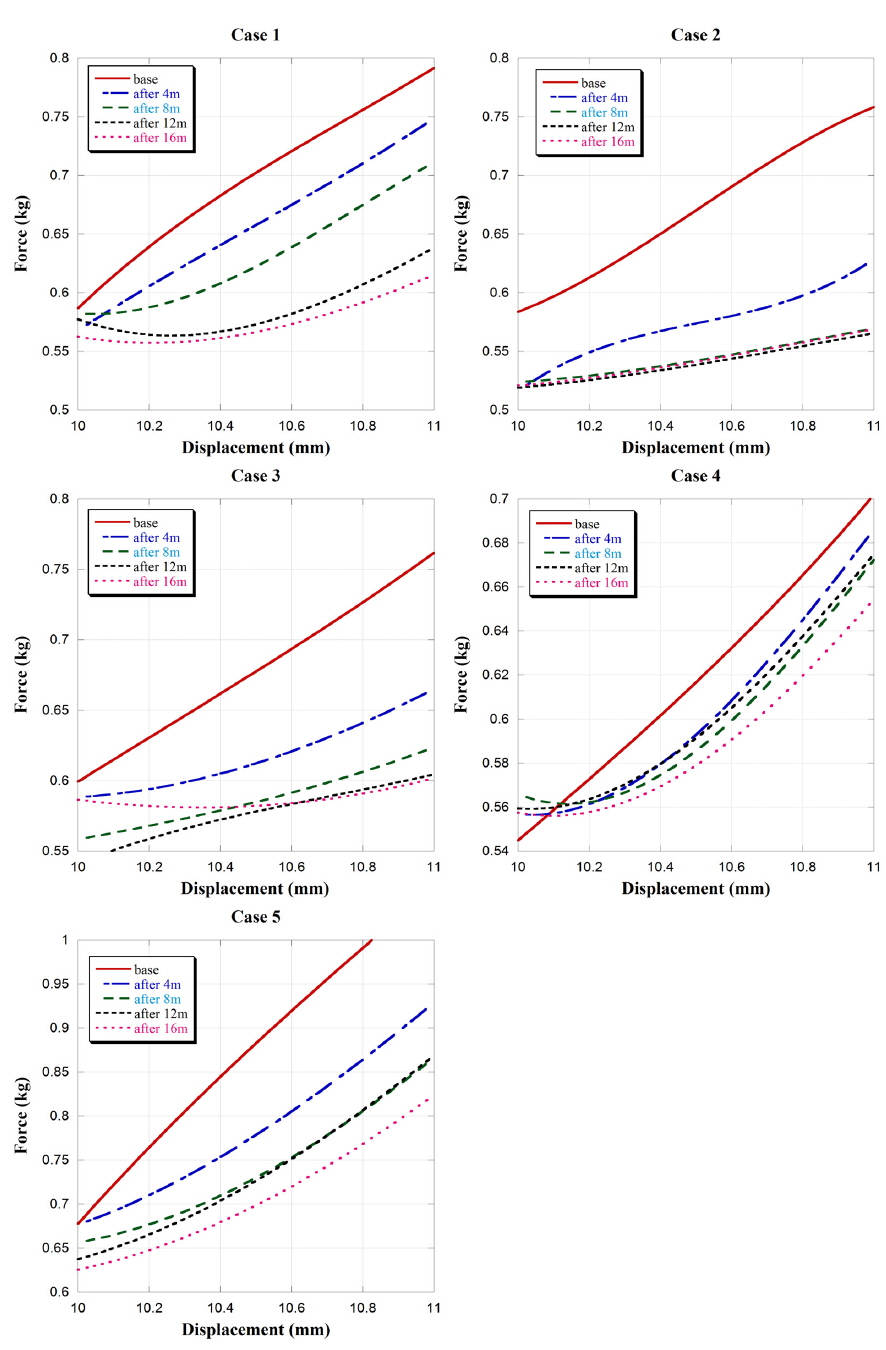
Figure 5 shows force-displacement curves for the five patients measured every 2 minutes. Some data were lost due to unexpected movements during measurement (especially with case 3). Each curve corresponds to a degree of muscle resistance when specific force (0.5-1 kg) was applied on the surface of the skin. Hemiplegic patients have stiffer muscles with more non-uniform muscle fibers and with a shorter muscle fiber length, and these abnormalities lead to increased passive stiffness [21-27]. As a consequence, the abnormal muscle tissue resulted in lower resistance, and the displacement per unit force is in inverse proportion to muscle stiffness.
The force required to change the displacement was highest in the base state; i.e., before-treatment state, and gradually reduced during laser irradiation, with the effect being maintained for some time following the treatment. The required force changed more significantly during the active phase of the experiments than during the post-treatment phase. Moreover, not only did the required force change but also the gradient of the force-displacement curve varied during the experiments. During the active part of the test, the gradient decreased; however, the gradient then increased during the post-treatment phase, although the required force remained smaller than prior to the therapy. These results indicate that muscle tension decreased during the treatment, and slowly recovered following the treatment.
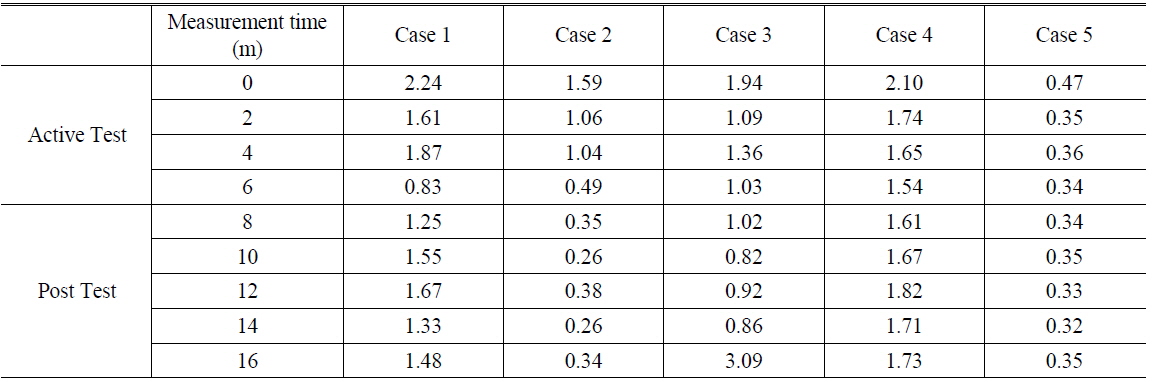
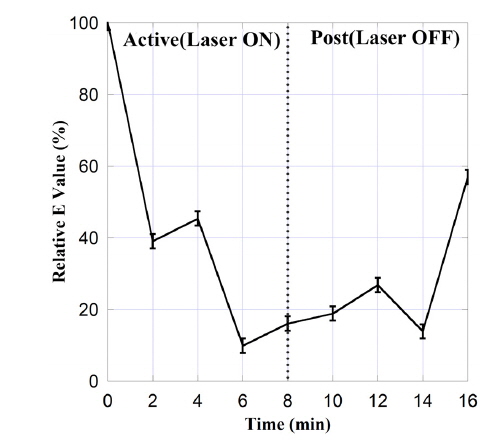
The muscle hardness may be calculated from the displacement and the applied force using Eq. (1). The muscle hardness E corresponds to the gradient of the force-displacement curve. The value of E may be used to characterize the therapeutic effect of HILT on muscle hardness. Table 2 lists E as a function of time during treatment, and Fig. 6 shows these data normalized to the initial (i.e., pre-treatment) value of E. We find that E decreased as a function of time during the active treatment phase (i.e., with laser radiation), and that this reduction in E was preserved during the post-treatment phase (albeit with some increase). This shows that HILT had a therapeutic effect that persisted following the application of the therapy. Although the same protocol was applied to all patients, there was some variation in therapeutic effect between patients. Some patients exhibited a tendency for E to return to the initial state, whereas with case 2 (75 years, MAS 1) the low muscle stiffness was maintained. These inter-patient variations are attributed biological and pathological characteristics of the muscle cells in each patient. [28] In addition, slower muscle recovery from stimuli may be expected in older patients [29].
[TABLE 2.] The muscle hardness E during each test

The muscle hardness E during each test
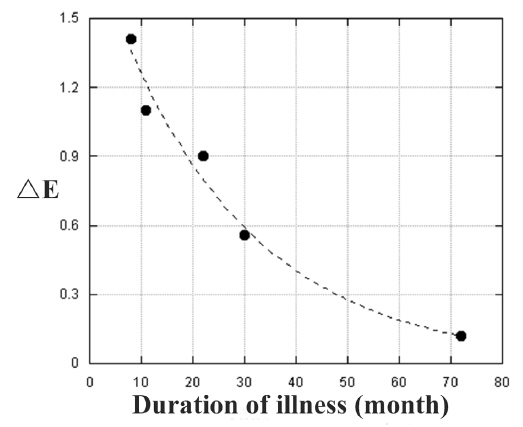
The variations in muscle hardness (E) depending on the duration of illness are shown in Fig. 7 to evaluate the treatment efficacy. A larger variation in E corresponds to the more effective treatment. We found that the treatment efficacy decreased exponentially as a function of the duration of illness. Some studies have reported a similar drop in efficacy as a function with the duration of the illness [30-33]. Recovery of muscle function has been shown to be the most significant during the first week after stroke, and rehabilitation is less effective when initiated more than 3 months after a stroke [30]. It has also been reported that the most significant factor affecting treatment efficacy is not the severity of the muscle tension, rather the duration of the illness [31-33]. Moreover, the ceiling effect; i.e., an increasing dose of a given medication or treatment having progressively smaller effect, may affect the efficacy of treatment [34-37].
We found that force-displacement decreased exponentially during laser treatment, and the HILT effect was maintained following the therapy. The muscle hardness, which was determined from the gradients of the force-displacement curves, decreased during laser irradiation and the low muscle tension was maintained following the treatment.
HILT is a non-invasive therapy that can be used for treating muscle disorders, and the Myotonometer is a reliable tool for assessing muscle stiffness, tone, and compliance. In this study, we combined HILT and Myotonometer measurements to achieve simultaneous laser treatment and real-time monitoring, and this combined system allowed quantitative measurements of the treatment efficacy during the therapy. HILT exerted a positive effect in relieving muscle tension in hemiplegic patients. We quantitatively evaluated the muscle tension using force-displacement curves to determine the muscle hardness. The treatment efficacy was lower in patients where the duration of illness was longer. This real-time monitoring and treatment system can be helpful in developing treatment strategies to avoid ceiling effects and to increase the treatment efficacy.