Recently, Seong et al. (2010) reported that the sea surface temperatures of the East, West and South Seas of Korea have exhibited distinct increases. In aquaculture farming, water temperature is a key environmental factor affecting the growth and survival of aquatic organisms (Wang et al., 2006). In particular, the ability of fish to obtain oxygen from the environment can be strongly affected by water temperature; changes in temperature can alter the rate of oxygen consumption and its delivery to tissues at the physiological level (Powell and Watts, 2006). Previous reports have suggested that elevated temperatures can cause higher metabolic rates, which then lead to increased oxygen consumption and subsequent production of reactive oxygen species (ROS) (An and Choi, 2010). In aquatic environments, aquatic organisms are often exposed to multiple stressors, including temperature changes; therefore, understanding the influence of elevated temperature on the antioxidant profile of aquatic organisms is crucial (Bocchetti et al., 2004).
Due to adverse effects on human health, the contamination of aquatic ecosystems with arsenic (As) has been receiving worldwide attention, particularly in South and Southeast Asia (Kapaj et al., 2006). As is a potentially toxic trace element that tends to accumulate to a greater extent in aquatic compared with terrestrial animals (McGeachy and Dixon, 1989). The United States Environmental Protection Agency set a limit of 0.01 ppm for As in drinking water (USEPA, 2001). Kim et al. (2007) reported that total As in freshwater and marine fish in Korea ranged from 0.024 to 2.23 and from 0.14 to 65.54 mg kg-1 dry wt, respectively. During a histopathological investigation, Ahmed et al. (2013) demonstrated that As is highly toxic to the liver and gills of tilapia,
As induces oxidative stress by cycling between metal oxidation states or by interacting with antioxidants (Halliwell, 2004). Liu et al. (2001) demonstrated that the free radical formation induced by As generates ROS that can interact directly with enzyme or metal-catalyzed processes in the liver of mice. As can exert its toxicity during a process of binding to critical thiol proteins and cellular non-protein thiols such as glutathione (GSH) (Chouchane and Snow, 2001). The regulation of the activity of antioxidant enzymes such as glutathione peroxidase (GPx), glutathione reductase (GR), and GSH-independent antioxidant by As is also an important aspect involved in the toxic mechanism of As (Shi et al., 2004). GSH-associated metabolism functions as a major mechanism for cellular protection against agents that generate oxidative stress. GSH participates in the detoxification process, scavenges free radicals, reduces peroxides, and conjugates with electrophilic compounds at several different levels (Dringen et al., 2000). This process is aided by enzymes such as GST, GPx, GR, aldo-keto reductase, and aldehyde dehydrogenase (Yu, 1994). Because antioxidant enzymes are widely used as biomarkers of marine pollution, research on antioxidant responses to marine environmental changes such as elevated water temperatures is tantamount. In the present study, we examined the activity of antioxidant enzymes after exposure to As at 20, 25, and 30℃ in tilapia,
>
Experimental animals and water conditions
Tilapia
Prior to temperature acclimation, fish were held for 4 weeks in aerated tanks in 20℃ water to ensure a common thermal history between acclimation groups. Temperatures were then adjusted using a water heater (Electronic thermostat, MS701- H, Mink, Korea), starting at 20℃ at increasing at 1℃ intervals once every other day until the final target temperature was reached (25 or 30℃).
Two replications of toxicity tests (10 fish at each As concentration and each temperature) were conducted in static systems with continuous aeration at a constant water temperature (20, 25, or 30℃) and a constant room temperature of 20℃. Experimental fish were exposed to waterborne treatments of 0, 200, and 400 μg L-1 sodium arsenite (NaAsO2, Sigma-Aldrich, Inc., USA) for 20 days at each temperature. The tank water was changed thoroughly once every 2 days, at which time, water quality parameters were measured for the bioassay (Table 1).
[Table 1.] Chemical components of seawater and experimental conditions used in this study
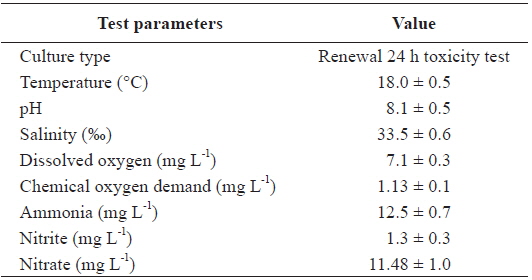
Chemical components of seawater and experimental conditions used in this study
Fish exposed to each As concentration were sampled at the end of the experiment. Fish were anesthetized using benzocaine, and the standard length and weight were measured immediately. The liver and gills were removed and kept at -80℃ until analysis.
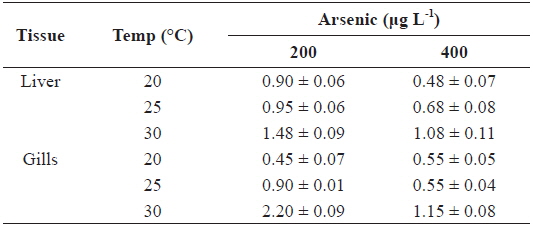
Each tissue was lyophilized to a constant weight after washing with distilled water and then digested using the wet digestion method after measuring the dry weight. Lyophilized organs were dissolved in HNO3 and re-dried by heating to 120℃. This process was repeated until all organic matter was digested completely. Final samples were dissolved in 2% HNO3 and used for analysis after filtration (Advantec MFS, Inc.; 0.2-μm filter). The concentration of total As in tissues was measured using an ICP-MS (Inductively Coupled Plasma Mass Spectrophotometer) (Elan, Perkin-Elmer Inc., USA) equipped with an automatic sampler using argon gas. An ICP multi-element standard solution VI (Merck) was used to produce a standard curve. As concentrations in the tissues of fish were expressed as μg g-1 dry wt. The accumulation factor (AF) is often used to compare the body burden of an organism to the degree of contamination in the water. The following definition was used here:
AF = [Me]fw,exp - [Me]fw,control / [Me]water
where [Me]fw,exp, [Me]fw,control, and [Me]water are the metal concentrations in the experimental group, control group, and water, respectively, measured in μg g-1 (Holwerda, 1991).
Liver and gill tissues used to determine enzyme activity were rinsed in 0.1 M KCl (pH 7.4) and homogenized (099CK4424, Glass-Col, Germany) in 0.1 M phosphate-buffered saline (pH 7.4). The homogenate was centrifuged at 10,000
The GSH level was measured following the method of Srivastava and Beutler (1970). A precipitation solution (3 μL) containing metaphosphoric acid, disodium ethylenediamine tetraacetic acid (Na2EDTA), and NaCl was added to a 2-mL sample. The mixture was centrifuged at 4,500
GR activity was determined using NADPH (nicotinamide adenine dinucleotide phosphate) and the GSH oxidized (GSSG) as substrate, as described by Beutler (1984). One unit of GR was defined as the NADPH consumed per minute while catalyzing the reduction of 1 mM GSSG.
>
Glutathione peroxidase (GPx)
GPx activity was measured by determining the decrease in NADPD (Sigma, USA) during the formation of reduced GSH via GR at 340 nm using a modified method of Bell et al. (1985). In this procedure, 2.5 mM H2O2 in 50 nM potassium phosphate buffer (1 mM GSH, 0.1 M NADPH, 0.5 U/mL GR, 1 mM EDTA, 2 mM sodium azide, pH 7.4) was used as the substrate.
>
Glutathione S-transferase (GST)
GST activity was measured using a modified method of Habig (1974). The sample (20 μL) was mixed with 100 μL 0.2 M potassium phosphate (pH 6.5) and 40 μL distilled water. The reaction was initiated by adding 20 μL 10 mM GSH and 20 μL 10 mM CDNB (1-chloro-2,4-dinitrobenzene). The reaction mixture was kept at room temperature for 1 min. GST activity was then determined by the absorbance increase at 340 nm after 5 min and was expressed as nmol min-1 mg-1 protein.
Data are presented as means ± standard error. For statistical analysis, a one-way analysis of variance (ANOVA) was used, followed by Duncan’s multiple range tests using SPSS statistical software (SPSS Inc., Chicago, IL, USA). Differences were considered statistically significant when
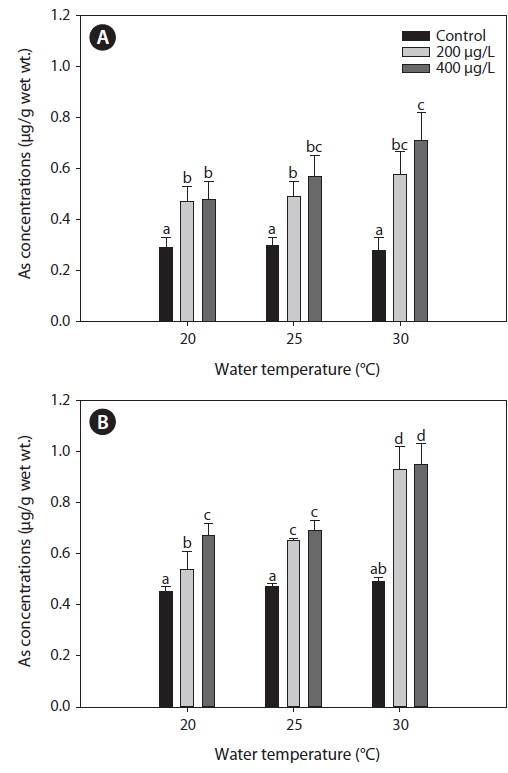
Fig. 1 presents the levels of As accumulation in the liver and gills of tilapia,
The AFs for liver and gills at 200 and 400 μg L-1 of waterborne As exposure at different water temperatures are presented in Table 2. The AFs increased with the water temperature in the liver and gills; however, an inverse relationship was observed between AFs and As exposure concentration.

Accumulation factor (AF) in the liver and gills of tilapia Oreochromis niloticus exposed to different arsenic concentrations, respectively, at 20, 25 and 30℃ for twenty-days
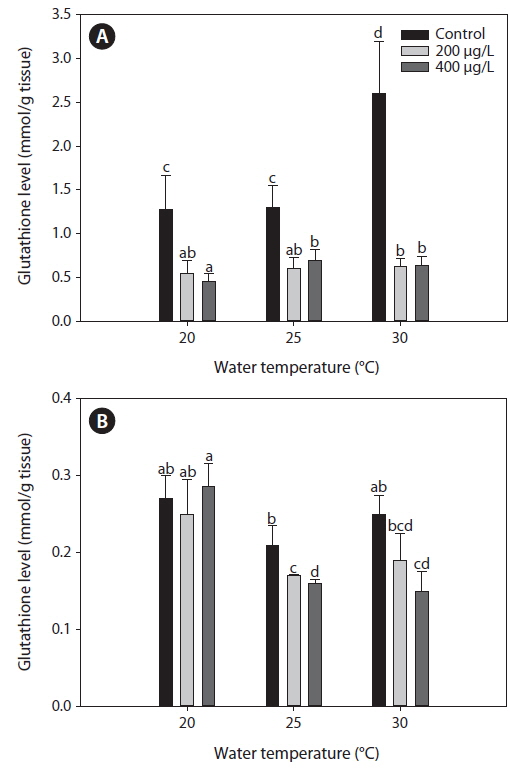
Glutahione (GSH)
Fig. 2 presents GSH levels in the liver and gills of tilapia according to water temperature and As exposure levels over 20 days. In the non-exposed group, liver GSH levels increased significantly at 30℃ compared with both 20 and 25℃. Although As exposure caused a significant decrease in GSH levels in the liver compared with the non-exposed group at each temperature evaluated (
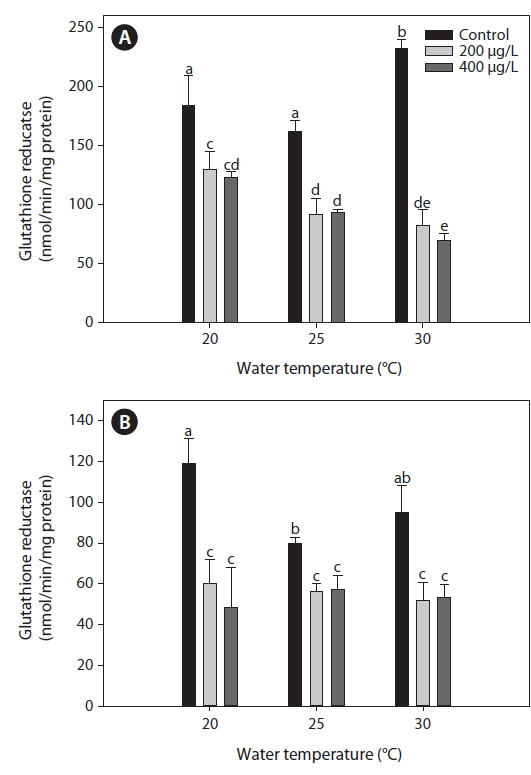
Glutahione reducatase (GR)
The GR activity measured in the liver of tilapia increased significantly at 30℃ compared with both 20 and 25℃ (Fig. 3). After 20 days of As exposure, there was a significant decrease in GR activity in the liver compared with the non-exposed group at each water temperature. In particular, liver GR activity decreased significantly with increased water temperature. In the gills, GR activity decreased significantly after As treatment, regardless of the water temperature, but values did not significantly differ between 200 and 400 μg L-1.
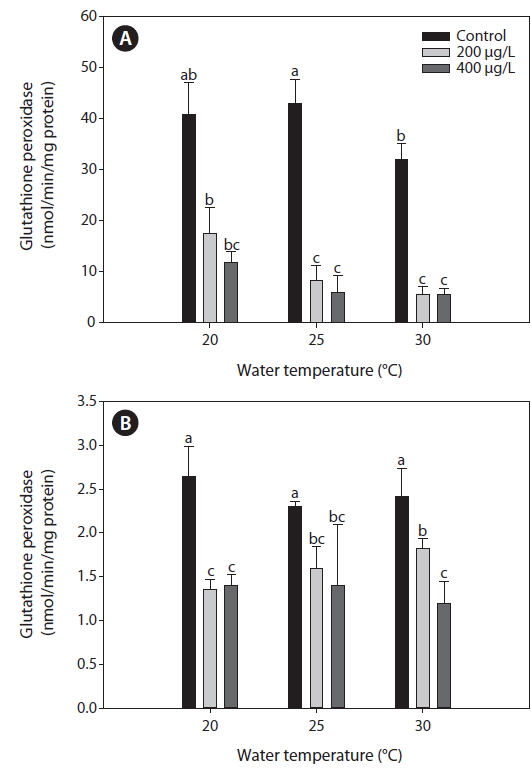
Glutahione peroxidase (GPx)
Fig. 4 presents the GPx activities in the liver and gills of tilapia according to water temperature and As exposure over 20 days. As caused a significant inhibition of GPx activities of the liver and gills compared to the non-exposed groups at each water temperature. In the liver, GPx activities significantly decreased with increasing water temperature, but no significant changes of GPx activities were observed between 200 and 400 μg L-1.
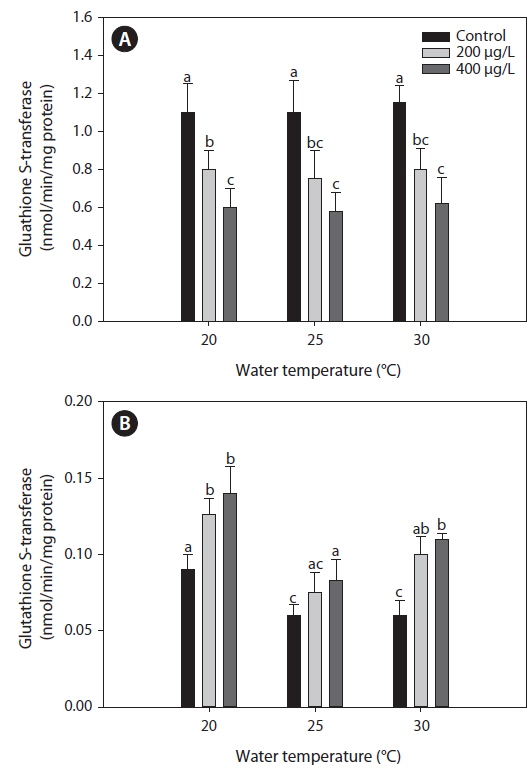
Glutahione S-transferase (GST)
The activities of GST measured in the liver were similar between 20℃ and warmer temperatures (25 and 30℃) in the non-exposed group (Fig. 5). Exposure to As caused a significant decrease in GST activity in the liver compared with the non-exposed group, regardless of water temperature. However, in the gills, GST activity increased significantly after As treatment at each water temperature evaluated, although warmer water temperatures (25 and 30℃) caused a decrease in GST activity compared with values at 20℃ in the non-exposed group.
Metal accumulation in fish tissues depends on the metal concentration, exposure time, manner of metal uptake, environmental conditions (e.g., water temperature, pH, hardness, salinity), as well as intrinsic factors such as fish age and feeding habits (Campana et al., 2003). Although various metals exhibit different affinities to fish tissues, most accumulate mainly in the liver, kidney, and gills. The accumulation of metals in various organs of fish may cause structural lesions and functional disturbances (Jezierska and Witeska, 2006). In the present study, waterborne As exposure led to similar As levels between the liver and gills of tilapia (Fig. 1). Takatsu et al. (1999) also reported similar levels of As accumulation between the liver and gills of the freshwater fish, Tribolodon hakonensis. As accumulation in the liver affects how this organ functions in detoxification, while accumulation in the gills affects its role in respiration, excretion, and osmoregulation (Culioli et al., 2009). Furthermore, Culioli et al. (2009) have suggested that the gills accumulate the highest levels of As and represent the best organ for biomonitoring As pollution.
In the present study, As levels in tilapia exhibited higher accumulation when water temperatures exceeded 20℃ (Fig. 1). Increased accumulation of metals at higher temperatures likely results from higher rates of metal uptake through increased respiration and ventilation in the gills. Kock et al. (1996) reported that elevated cadmium and lead levels in
Currently, oxidative stress is the most widely accepted and well-studied mechanism of As toxicity (Ercal et al., 2001). Previous studies have also reported As-induced antioxidant imbalances (Samuel et al., 2005; Valko et al., 2006; Hughes and Kitchin, 2006). An antioxidant response is the primary cellular defense mechanism against As toxicity. The metabolism of As may follow several potential pathways, i.e., classical reduction, oxidative methylation, and GSH conjugation. As-induced oxidative stress can cause GSH to react directly with electrophiles; therefore, GSH may play an important role in As detoxification along with the cofactors GPx and GST (Dopp et al., 2010).
As induces a depletion of antioxidant defense enzymes such as SOD, GPx, GR, and GST, although the pattern of depletion varies with factors such as dose, time, and organ (Mishra et al., 2008). Generally, short-term exposure to low As concentrations increases the activities of these enzymes, whereas chronic exposure usually decreases activity levels (Shi et al., 2004). Lantz et al. (2007) proposed that GST could be used as a biomarker for As toxicity. Ventura et al. (2007) reported that GST activities were reduced in the polychaete
Bajanyukova et al. (2007) reported that GPx and GST appear to play particularly important roles in the antioxidant defenses of goldfish subjected to thermal stress (from 3 to 23℃).
Given that As is enzymatically methylated in the liver, its toxicity depends on the type of As compound and the species of fish, as well as environmental factors such as water temperature (Kotsanis and Iliopoulou, 1999). In addition, Cherkasov et al. (2006) demonstrated that Cd-induced oxidative stress in oysters can be particularly strong and pronounced at an elevated water temperature of 30℃ compared with 20℃. These authors suggested that antioxidants offer adequate protection against Cd-induced ROS at 20℃ in oysters; in contrast, at 30℃, antioxidant systems appear to be unavailable for defense against Cd-induced ROS generation, and considerable oxidative damage occurs.
Kaur et al. (2005) reported that high-temperature treatments (from 20 to 32℃) modulated antioxidant enzymes such as GSH, GR, and GST in the liver and gills of
Antioxidant defense is one of the most efficient mechanisms of protecting biological molecules, but the process is also a major target for toxic compounds. Altered levels of these antioxidants provide insight into the degree, extent, or stage of As-induced oxidative damage. Thus, antioxidant levels can be used as biomarkers of As toxicity. In addition, the antioxidant activity of enzymes such as GSH, GR, and GPx is directly and inversely proportional to As toxicity, depending on water temperature. Furthermore, the inhibition or fluctuation of antioxidant enzymes indicates that the fish might not possess a normal physiological homeostasis against oxidative stress due to As exposure. These findings support our results, which demonstrated that the exposure of tilapia to As caused significant modulations in antioxidant enzymes at an elevated temperature of 30℃. In particular, the present study suggests that the large fluctuations in antioxidant enzymes at 30℃ are due to accelerated As accumulation in tilapia caused by elevated water temperatures. Similarly, Carvalho and Fernades (2005) reported that the toxicity of heavy metals in fish increased more at 30℃ compared with 20℃ due to increased oxygen consumption and respiration rate.
Our data indicate that As affected antioxidant responses in the liver and gills of tilapia in terms of GSH levels and GPx, GR, and GST activities. The antioxidant defenses were likely overwhelmed in the liver and gills, leading to increased As accumulation and exaggerated As toxicity when the water temperature was increased. Furthermore, our study provides another mechanism for the synergistic effects observed between environmental temperature and pollutants, which may have important implications for the survival of fish in polluted environments during seasonal warming and/or global climate change.