Experimental transgenesis in a laboratory fish model has received much attention as a potential means to study the function of vertebrate genetics, and a variety of transgenic fish strains have been investigated with particular focus on developmental genetics and functional genomics (Chen et al., 1996; Gong et al., 2001; Rembold et al., 2006). Transgenic strains that acquire the ability to express a visible reporter throughout their body in a constitutive and ubiquitous manner throughout their life cycle provide an invaluable resource for research into in vivo cell migration and lineages, transgene silencing, tissue regeneration, RNA interference and/or sexual dimorphism (Hsiao and Tsai, 2003; Burket et al., 2008; Xie et al., 2005; Huang et al., 2008).
Postmortem studies on the induction of ubiquitous transgenic expression in fish have reported a frequent loss of transgenicity (i.e., transgenic expression) in certain organs during adulthood, and the silencing of transgenes after several generations (Gibbs and Schmale, 2000; Nam et al., 2000; Kim et al., 2004; Burket et al., 2008). Despite its importance, the mechanisms underlying this unwanted modification are not fully understood and accurate prediction of transgene silencing post-expression has not been possible. Not surprisingly, the strength and robustness of transgene-mediated ubiquitous expression have been principally governed by characteristics of the transgenic locus formed in the host genome (i.e., the insertion site, transgene copy number and/or concatemeric arrangement), which are broadly referred to as the positional effects (Koetsier et al., 1996; Nam et al., 1999; Geurts et al., 2006). However, the structural and functional stability of the transgenic locus in the animal genome is highly species (or strain)-specific and even contradictory between transgenic strains generated with a given transgene construct. Furthermore, transgenic loci containing long concatemers can be prone to transgene rearrangement and silencing, which could frequently lead to unfaithful expression of the introduced transgene in transgenic animals (Geurts et al. 2006). In contrast, other transgenic strains carrying extremely high copy numbers of transgenic integrants arranged in a concatemer have been successful in driving robust expression, and have passed the transgene copies on to many subsequent generations without loss of function (Nam et al., 2001; Kim et al., 2004; Cho et al., 2013a). For the reasons outlined above, a series of evaluation processes to verify the transgenic genotypes and expression profiles from sufficient numbers of transgenic strains is needed to select the optimum transgenic lines with respect to stability, persistency and robustness of the fluorescence expression.
The euryhaline medaka species Oryzias dancena and O. javanicus have many advantageous traits and are suitable model platforms for transgene-based heterologous expression assays to visualize the expression patterns of a given target gene, and their endogenous β-actin promoters have the potential to drive the ubiquitous expression of a foreign reporter construct in their tissues (Cho et al., 2011; Lee et al., 2012). However, due to the limited number of established transgenic strains available, the functionality of transgene copy number-dependent expression characteristics have not been explored to date in these β-actin promoter-driven transgenic strains. It is thus vital to select the most suitable transgenic line(s) for use in practical applications to address the issues raised above.
In this study, experimental transgenesis of the β-actin promoter-driven fluorescent reporter (β-actin-GFP) in the marine medaka O. dancena model was scaled-up, and comparative analyses of the transgene insertion patterns, transgene copy numbers and expression characteristics were performed in 21 established transgenic germlines.
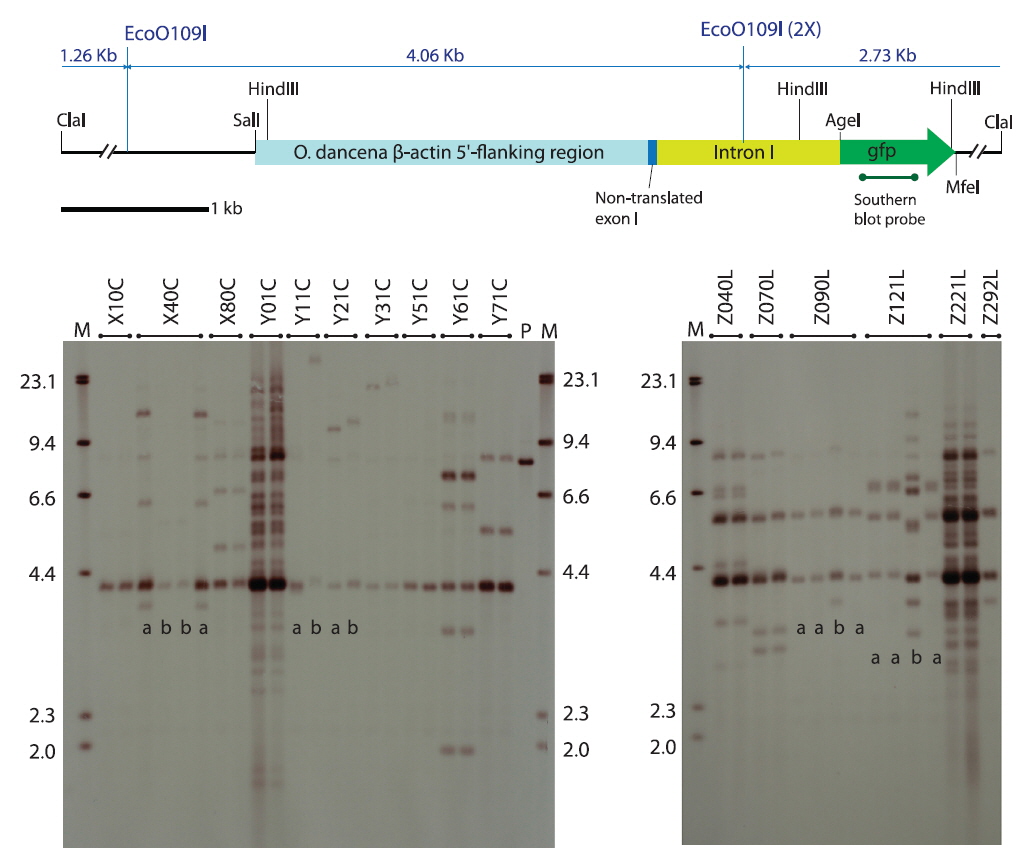
The transgene was constructed by fusing the marine medaka β-actin regulator, including the non-translated exon-1 and intron-1 (Cho et al., 2011), with an egfp gene (pEGFPC1 plasmid; Clontech Laboratories Inc., Mountain View, CA, USA), in which the egfp fragment was spliced unidirectionally into the AgeI and MfeI restriction sites of the β-actin regulator-containing plasmid, placing the egfp gene immediately downstream of the β-actin regulator. The resultant transgene plasmid was named podβ-actGFP (8,066 bp) and its partial restriction map is shown in Fig. 1. Transgenic plasmid DNA was amplified in the Escherichia coli XL1 Blue MRF´ strain (Agilent Technologies, Inc., Santa Clara, CA, USA) and gel purified. Both circular and ClaI-linearized forms of the podβ-actGFP were prepared in injection buffer (10 mM Tris-HCl and 0.01 mM EDTA, pH 8.0) at 50 μg/mL. One-celled embryos were microinjected according to procedures described previously (Cho et al., 2011), and the microinjected embryos were placed in an incubator at 26 ℃ with a salinity of 5 parts per thousand (ppt) until hatching. After hatching, the larvae from each microinjected batch were raised to adulthood and presumed transgenic founders were selected based on the presence of GFP signals observed by fluorescence microscopy. At sexual maturity, the identified founder transgenic strains were mated with non-transgenic, wild type fishes as described previously (Cho et al., 2013a). From each mating group, at least 160 offspring were examined for the presence of GFP signals to estimate the germline transmission frequency of the functional transgene from the founder transgenic strain to the F1 progeny. The GFP-positive F1 individuals from each group were selected and grown to sexual maturity to produce the F2 generation, in a similar fashion to the propagation of the F1 transgenic strains. Fluorescence microscopy and PCR screening of the transgene podβ-actGFP were carried out with randomly selected GFP-negative progeny (n ≥ 48) to identify whether the transgenic families contained any non-functional transgenic individuals (i.e., PCR-positive but GFP-negative). Template DNA was prepared from fry whole-body samples using a conventional SDS/proteinase K method, followed by ethanol precipitation. Approximately 100 ng of template DNA were subjected to PCR cycling (30 cycles at 94℃ for 30 s, 60℃ for 30 s and 72℃ for 30 s with an initial denaturation step at 94℃ for 2 min) using the primer pairs ODGFP TG 1F (5ʹ-ACGTAAACGGCCACAAGTTC-3ʹ) and ODGFP TG 1R (5ʹ-TGTTGTGGCGGATCTTGAAG-3ʹ) to amplify a 450-bp internal segment of the transgene.
Five micrograms of EcoO109III-digested genomic DNA from F1 and/or F2 transgenic fish was separated on a 1% agarose gel, transferred to a positively charged nylon membrane (Roche Applied Science, Manheim, Germany) and hybridized with a digoxygenin-11-dUTP-labeled probe of an egfp gene segment. All procedures, including hybridization, stringent washing and signal detection were carried out using a DIG DNA Labeling and Detection Kit (Roche Applied Science) according to the manufacturer’s instructions.
To estimate the transgene copy number per cell for each transgenic line, a quantitative PCR assay was conducted using 5 ng of genomic DNA (measured spectrophotometrically) from each individual. To ensure that an equal amount of DNA was used across all samples, each template sample was pre-confirmed as having almost identical Ct values (± 0.4) based on the qPCR amplification of the endogenous actin gene (GenBank accession no. HM347346) segments (data not shown). Thermal cycling and detection of the fluorescent signal of the amplification products were carried out using 2 × iQ™ SYBR® Green Supermix and Optic Module from the iCycler® iQ™ Real-Time Detection System (Bio-Rad, Hercules, CA, USA) according to the manufacturer’s recommendations under the following cycling conditions: 45 cycles at 94℃ for 15 s, 60℃ for 15 s and 72℃ for 15 s with an initial denaturation step at 94℃ for 2 min. The PCR primers were qGFP-F (5ʹ-AACGAGAAGCGCGATCACAT-3ʹ) and qGFP-R (5ʹ-TACCGTCGACTGCAGAATTC-3ʹ). The resulting amplicon was 130 bp. Based on standard curves prepared using known copies of positive plasmids (podβ-actGFP), the PCR efficiency for each amplification reaction was confirmed to range from 97.1 – 101.6%. From preliminary tests to determine the appropriate ranges of the standard copy numbers, two different standard curves scales were applied (0 – 200 copies for low-copy-number transgenic lines and 0 – 2,500 copies for high-copy-number transgenic lines) to ensure optimum resolution. For each transgenic genotype, at least four individuals from the F1 and F2 generations were tested, and three independent experiments were carried out per individual to calculate the average copy number.
The GFP signals were measured using the MetaVueTM Research Imaging System (Molecular Devices Corp., Downingtown, PA, USA) and NIS-Elements BR image analysis software (ver. 3.1) equipped in an AZ100 fluorescence microscope system (Nikon Corporation Instruments Company, Japan) with a Nikon GFP-B-2A filter (450–490 nm excitation; dichromatic mirror cut-on at 500 nm and a barrier filter at 515 nm). The arbitrary values (statistical mean of intensity values of the pixels) relative to the serial dilutions of a standard purified GFP protein (Clontech Laboratories Inc.) were measured using the image analysis software to assess the relative strength of GFP expression across the transgenic strains. Living GFP-transgenic strains (six specimens per transgene genotype; 1-week-old fry) were subjected to fluorescence microscopy analysis. To examine the distribution pattern of transgenic GFP expression in adult tissues, somatic (brain, eye, fin, gill, heart, intestine, kidney, liver, skeletal muscle, spleen) and gonadic (ovary or testis) tissues were obtained from F1 and/or F2 individuals (n = 8 per transgene genotype) and examined using fluorescence microscopy.
To ascertain whether the GFP expression levels measured using fluorescence microscopy were positively correlated with the transcriptional levels of the gfp transgene, a qRT-PCR assay of gfp mRNA levels was performed on selected transgenic lines, with a significantly different range of GFP intensity. Transgenic fry used in the fluorescence measurement assays were subjected to total RNA isolation using the RNeasy Plus Mini Kit (Qiagen, Hilden, Germany). An aliquot (2 μg) of purified total RNA was reverse transcribed to cDNA using the Omniscript Reverse Transcription Kit (Qiagen), which included a marine medaka 18S rRNA primer to prepare the 18S rRNA normalization control (GenBank accession no. HM347347). The transgene gfp (amplicon size of 258 bp) and the normalization control 18S rRNA (amplicon size of 253 bp) were amplified with the PCR primer pairs qRT-GFP 1F (5ʹ-CCTGAAGTTCATCTGCACCAC-3ʹ)/1R (5ʹ-TCGATGCCCTTCAGCTCGAT-3ʹ) and qOD 18S RNA 1F (5ʹ-TCCAGCTCCAATAGCGTATC-3ʹ)/1R (5ʹ-AGAACCGGAGTCCTATTCCA -3ʹ), respectively. By using the standard curves for the transgene and the normalization control gene, PCR efficiencies > 0.93 were confirmed. Amplification and signal detection were conducted using the 2 × iQ™ SYBR® Green Supermix and iCycler® iQ™ Real-Time Detection System (Bio-Rad) under the following cycling conditions: 45 cycles at 94℃ for 20 s, 60℃ for 20 s and 72℃ for 20 s with an initial denaturation step at 94℃ for 2 min. Expression of the gfp transcripts in each sample were normalized against that of 18S rRNA control based on methods described previously (Kubista et al., 2006; Cho et al., 2011). Triplicate independent assays were performed.
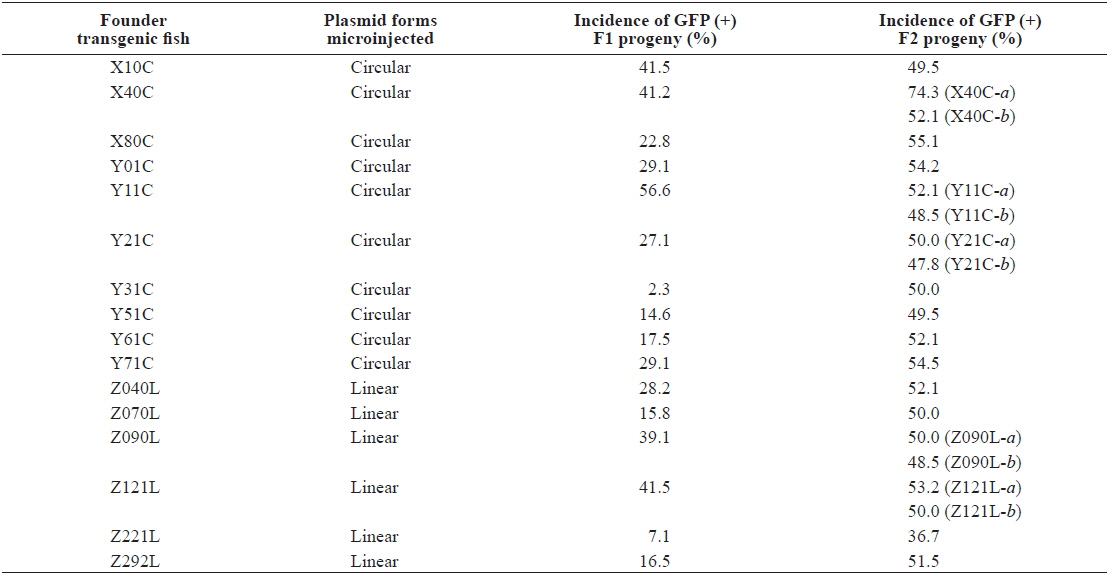
Following multiple microinjection trials, 21 and 14 GFP-positive founder fishes were selected at adulthood from embryo batches injected with the circular and ClaI-linearized podβ-actGFP transgene, respectively. Irrespective of whether the circular and linear forms were microinjected, all founder fishes exhibited a mosaic distribution pattern of GFP signals in their external appearance, although the area of the GFP expression sites and fluorescence intensities were highly variable among the founder individuals (not shown). In general, mosaicism in founder fishes has been explained by late genomic integration of introduced transgenic DNA, typical of microinjection-mediated gene transfer in fish embryos (Iyengar et al., 1996; Nam et al., 1999; Burket et al., 2008). Of the 36 founders subjected to progeny testing for germline transmission, 10 and 6 founders respectively, belonging to the circular and linear podβ-actGFP-injected groups, showed successful transmission of the fluorescent transgene to their F1 offspring. As expected, germline transmission frequencies from the F0 to the F1 generation were highly variable among founder individuals, ranging from 2.3 – 56.6%, as assessed by the incidence of GFP (+) fish in the F1 generation (Table 1). Table 1 shows that all transgenic founders were present at a frequency of < 50% (except for Y11C), indicating that the germ cells in these founders were mosaic for the transgene, with a wide degree of mosaicism. However, a GFP incidence close to 50% in the transgenic founder Y11C suggested exceptionally early integration of the transgene introduced into the one-celled embryo, displaying a frequency of germline transmission resembling that of Mendelian single gene inheritance (Nam et al., 2007). The PCR screening of the GFP (-) progeny to test for failure of GFP expression in transgenic strains, identified three transgenic families (X10C, Y51C and Z292L) which included a small portion of PCR (+) but GFP (-) F1 offspring with a frequency of < 5%, suggesting that functional expression of the transgene could not be achieved in all the transgenic strains (data not shown). It is not yet known whether these non-functional PCR (+) fishes share a genomic integration pattern with their corresponding GFP-positive siblings.
Although high variability of the germline transmission frequency was common in the passage from F0 to F1, most, but not all, transgenic F1 fishes transmitted the fluorescent transgene to the F2 generation following Mendelian inheritance patterns. Moreover, the GFP (-) but PCR (+) transgenic strains, present in a few strains in the F1 generation, were no longer detected in the F2 generation (data not shown), suggesting that hemizygous transgenic genotypes were successfully established in these transgenic lines (Nam et al., 2000). However, unlike these stable transgenic strains, two exceptional transgenic lines, X40C-a and Z221L, exhibited a frequency of GFP (+) F2 progeny that deviated greatly from the expected Mendelian ratio. The X40C-a F1 transgenic progeny that originated from the X40C founder (see also Southern blot; Fig. 1) exhibited 74.3% of GFP (+) incidence in its F2 offspring, possibly resulting from multiple integration events in two unlinked chromosomes. However, the F1 transgenic strains of the Z221L line exhibited an unexpectedly low GFP frequency of 36.7%. As no GFP (-) but PCR (+) transgenic F2 individuals were detected, even in this group, this low incidence could be due to retarded proliferation of the transgenic germ cells or depressed fertilizing capability of the transgenic gametes compared to those of their non-transgenic counterparts (Cho et al., 2011).
Southern blot hybridization analysis did not reveal any notable hybridization signals from the non-transgenic control fishes under the present hybridization conditions (data not shown). Transgenic strains carrying podβ-actGFP revealed various hybridization patterns in the transgenic lines, indicating independent and random integration of multiple copies of the microinjected DNA in most of the transgenic groups (Fig. 1), consistent with previous microinjection experiments in fish embryos (Hackett and Alvarez, 2000; Kim et al., 2004; Cho et al., 2013a). In the transgenic strains developed by microinjection with ClaI-linearized podβ-actGFP, the hybridization of the gfp probe to the EcoO109I-digested genomic DNA should have enabled visualization of the junction fragment between the transgene and the host chromosome, which is > 2.73 kb. Hence, hybridization products > 2.73 kb could reflect, at least indirectly, the genomic integration of the introduced transgene into the host genome (Nam et al., 1999; Hackett and Alvarez, 2000). Any 4-kb hybridization signals, commonly observed in most transgenic lines, could be a consequence of the tail-to-head concatemerization of the ClaI-linearized podβ-actGFP (i.e., 2.73 kb joined to 1.26 kb) prior to integration, although the detailed array of concatemers should be further validated by positional cloning of the transgenic locus (Uh et al., 2006). Similarly, the relatively strong hybridization signal at 5.5 kb in several of the transgenic lines, including Z040L, Z070L and Z221L, could be the result of tail-to-tail concatemerization (i.e., between the two 2.73-kb tails). Tandem concatemers of exogenously introduced linear DNA molecules have been reported (Iyengar et al., 1996; Geurts et al. 2006; Cho et al., 2013b). The circular podβ-actGFP-injected transgenic groups also displayed diverse hybridization patterns depending upon the transgenic lines, in which multiple copies of transgenic integrants were evident. A hybridization band at 4 kb was present in most transgenic strains, and might reflect the gfp-containing internal 3.99-kb fragment spliced from the podβ-actGFP transgene by the digestion with EcoO109I. However, due to the random pattern of the breakage of the circular plasmid prior to incorporation into the host chromosome, a clear explanation for all the hybridization bands has proven difficult from the Southern blot analysis alone.
As evidenced by the Southern blot hybridization analysis, five transgenic founders passed on each of two different transgene genotypes to their F1 offspring. These were X40C, Y11C and Y21C from the circular transgene-injected groups and Z090L and Z121L from the linear transgene-injected groups (see blots in Fig. 1). For both the X40C and Z121L lineages, the two transgenic genotypes detected among the F1 fishes within a given family differed greatly from one another in terms of hybridization pattern and transgene copy number (labeled a and b; Fig. 1), suggesting that these founder fishes could have experienced two independent transgene integration events, resulting in the chimeric status of their germ cells. On the other hand, the transgenic line Z090L showed two different, but relatively similar, hybridization patterns among the F1 fishes, suggesting the possibility that a slight recombination or modification from the original transgene integration could have occurred in a certain portion of the germ cells during their proliferation process. However, to verify these hypotheses, further research is needed to gain an insight into the insertion and junction sites for each transgenic genotype. Each transgenic genotype observed in the F1 individuals in this study had been successfully inherited by the F2 generation (data not shown).
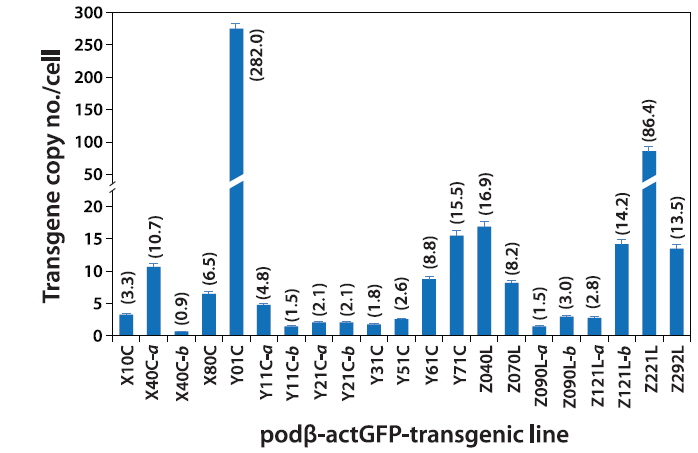
Based on the qPCR assay, the average transgene copy number per cell varied greatly among the transgenic lines, ranging from 0.9 (almost a single copy; transgenic line X40C-b) to high copy numbers of up to 282 copies (transgenic line Y01C; Fig. 2). In general, the transgenic lines displayed multiple copies of the transgene integrants, with the exception of some of the transgenic lines, such as X40C-b, Y11C-b and Z090L-a (0.9 – 1.5 copies). Overall, the average copy number scored using qPCR was in agreement with the Southern blot hybridization patterns, although a direct comparison of the values from the qPCR and Southern blot might not be realistic due to the different sensitivities of the methods. There was no notable variation in the qPCR-based estimation of transgene copies in any of the transgenic lines. In a comparison between the circular- and linear DNA-injected groups, no plasmid configuration-specific tendency was observed, although there was a very high copy number in the Y01C transgenic line injected with the circular form of the transgene. Despite the highly variable copy numbers, which depended on the transgenic strains investigated, our data indicated that multiple copies would be integrated only into a single chromosomal site (or into closely related- and neighboring sites on a single chromosome) in each transgenic line, with the exception of in X40C-a, as supported by the hemizygous propagation of the F2 off-spring from F1 (Nam et al., 2007; Cho et al., 2011, 2013b).
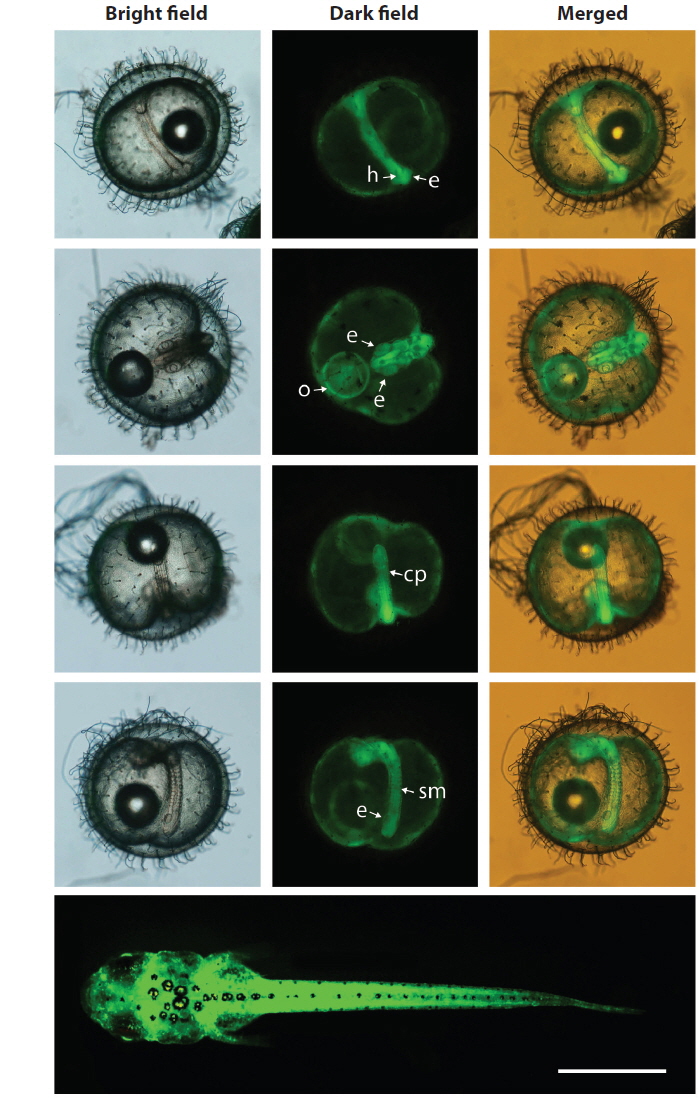
During embryonic development, spatial and temporal patterns of transgenic GFP expression were identified in all of the transgenic lines tested. The expression pattern of the GFP signals could be characterized at the onset of expression at the neurula stage, which intensified at the somite formation stage and was ubiquitous throughout the embryonic body, including the head, body trunk, eye and caudal peduncle, although the intensity of the GFP signal varied among the transgenic lines. This ubiquitous pattern was persistent in hatchlings that showed whole body expression of the GFP signals. Representative images showing the ubiquitous distribution of the GFP signals, exemplified by the Y71C transgenic line are shown in Fig. 3. The developmental expression pattern of the GFP reporter in this study was in agreement with previous observations of the expression of the endogenous β-actin gene in developing fish embryos using qRT-PCR or a transgenically tagged fluorescent reporter (Lee et al., 2009; Cho et al, 2011; Lee et al., 2012), suggesting that the GFP-based reporter system could be used visualize onsite and real-time expression of the β-actin gene in this species.
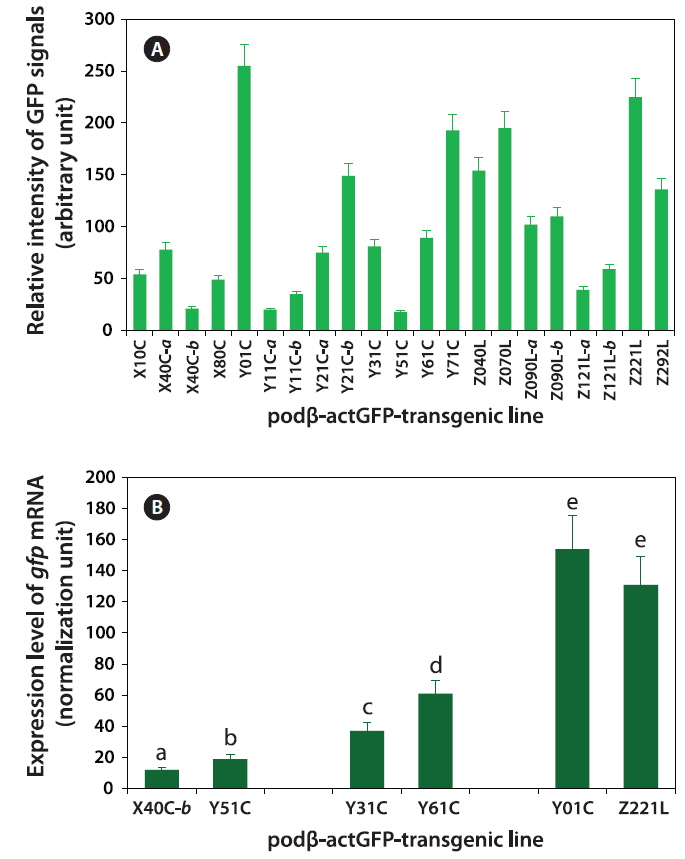
Fluorescence microscopic image analysis revealed that levels of GFP signals in the transgenic fry varied across the transgenic lines, with the difference between the weakest and strongest GFP expression being ~14-fold (Fig. 4A). Usually, the transgenic strains belonging to groups with robust GFP expression were easily distinguishable by eye from their non-transgenic siblings. However, the microscopic assay in this study revealed the external GFP expression in only an indirect way, and instead, this assay should include the mismatch of GFP quantification between GFP-expressing living organism and purified GFP protein in solution. For this reason, further quantification to assess the actual amount of GFP protein (e.g., using GFP antibody-based ELISA or Western blot) is needed to fully quantify the concentration of GFP expressed in the fry. However, our data on GFP signal analysis could be, at least in part, supported by the qRT-PCR analysis of gfp mRNA from the same transgenic specimens used in the image analysis. Transgenic lines that were either weak (X40C-b and Y51C), moderate (Y31C and Y61C) or strong (Y01C and Z221L), revealed different levels of transgene transcripts, in which the gfp mRNA levels positively correlated with the microscopic data. The difference between the weakest and strongest expression of gfp mRNAs was 12-fold (Fig. 4B).
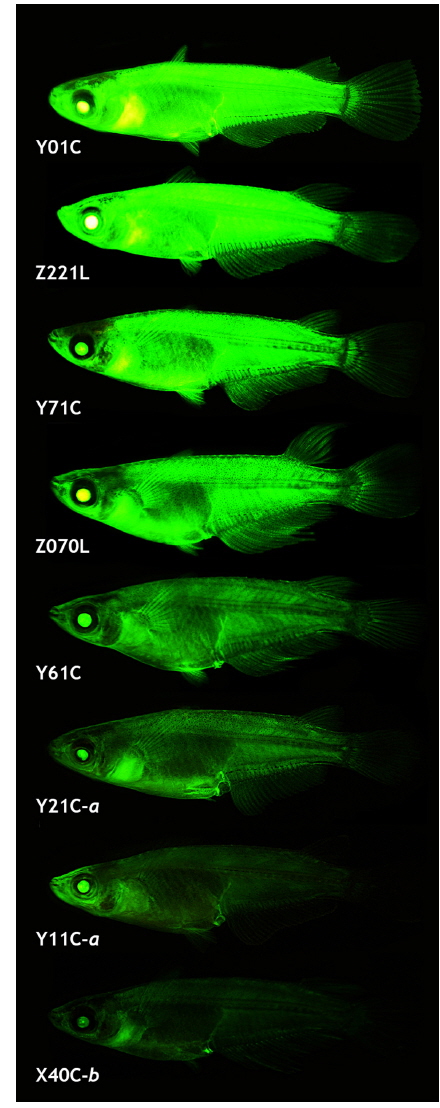
The transgenic expression pattern observed in the early stages generally persisted during growth to sexual maturity, although several transgenic lines lost GFP expression in certain tissues, similar to previous reports on transgenic strains with ubiquitous expression (Gibbs and Schmale, 2000; Burket et al., 2008; Er-meng et al., 2010). Of the 21 transgenic strains, 6 lost the GFP signals in one or more tissues, while the remaining 15 successfully retained the GFP phenotype in a ubiquitous manner. The number and type of GFP-negative organs observed in the six transgenic strains were not uniform: the transgenic lines failed to express GFP in 1 – 4 organs (the brain, eye, fin, heart, kidney, liver, spleen and/or testis). Although GFP expression was not quantified among the tissues, microscopic observations revealed that the tissue-dependent expression pattern of the transgenic GFP was possibly not homogeneous for all the transgenic lines (data not shown). Although tissue/organ-dependent expression levels were difficult to assign to a specific or uniform pattern, the external appearance of the GFP phenotype in the adult transgenic strains was in agreement with the GFP signals measured in the microscopic assays (Fig. 5). Under identical exposure conditions, the transgenic adults belonging to either the Y01C or Z221L strains always displayed strong GFP expression, which was barely seen in the other transgenic lines. On the other hand, transgenic lines—such as Y11C-a and X40C-b—that had the lowest GFP levels at the fry stage displayed a consistently weak or moderate GFP phenotype. Collectively, data from this study suggest that the expression of the GFP transgene under the control of an endogenous β-actin regulator can be stably expressed from the embryonic stage to adulthood, enabling effective labeling of most tissues and organs throughout the life cycle of this species.
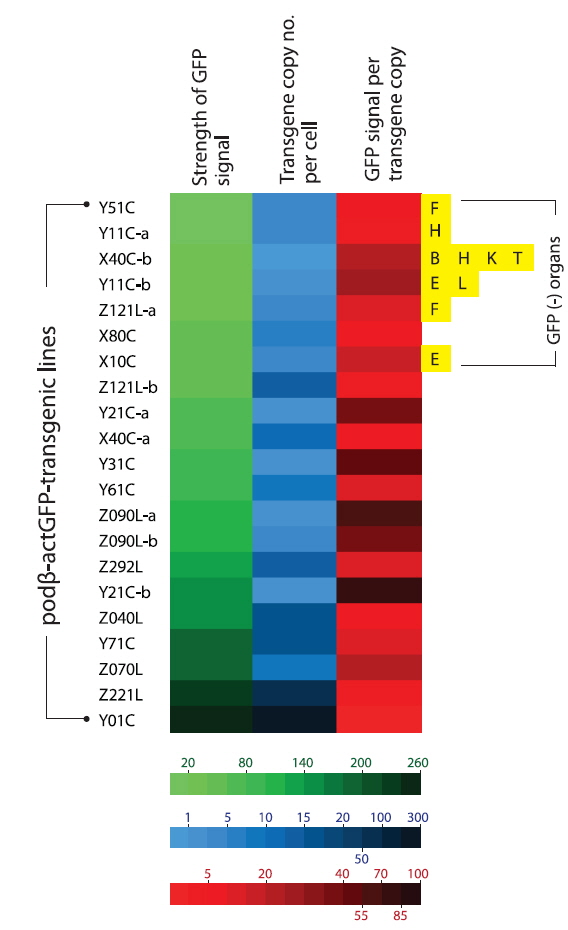
The data obtained at the transgene genotype and phenotype levels reveal a potential interrelationship between transgene copy number and GFP expression (Fig. 6). There exists neither a direct nor proportional correlation between the expression levels of transgenic GFP and copy numbers of transgene integrants. There is no simplified pattern of cross-talk between the two parameters. However, some common tendencies in the relationship between transgene copy number and expression characteristics should be considered. First, the highest GFP expression levels were achieved in the transgenic strains with the highest, absolute transgene copy numbers, as seen in the Z221L and Y01C lines. This is largely contradictory to previous claims that transgenic animals with very high numbers of transgene copies in long concatemers often fail to display high expression levels (Dorer and Henikoff 1997; Geurts et al. 2006). On the other hand, this finding is in agreement with previous observations of high-copy-number transgenic marine medaka strains carrying different transgenes, suggesting a relatively high capability of the marine medaka genome to maintain high copies of exogenously introduced genes (Cho et al., 2011; 2013a). Transgenic lines possessing single- or only a few transgene copies are more likely to display relatively weak expression levels than the high-copy-number transgenic strains. The bottom five ranking transgenic lines (i.e., the five strains with the weakest GFP expression; Y51C, Y11C-a, X40C-b, Y11C-b and Z121L-a lines) had a transgene copy number of < 5 /cell. Furthermore, the loss of the GFP signal occurred preferentially in those transgenic lines with weak or moderate GFP expression levels compared to those with strong expression levels. Although specific mechanism of differential transgene silencing remain to be clarified (Baup et al., 2010), the preliminary genomic Southern blot hybridization analysis of the GFP-positive and negative organs from a given transgenic individual suggest that the lack of GFP in these organs to be more likely to be related to epigenetic modification(s) rather than direct recombination or deletion of the transgene (blots not shown) (Matzke et al., 2000). Despite the highest GFP expression in the high-copy-number transgenic strains (Z221L and Y01C), the expression efficiency (i.e., GFP levels per transgene copy) was low in both strains. Overall, the transgene copy number was inversely correlated with the efficien cy of transgene expression, suggesting that all copies of the transgene integrants in the high-copy-number transgenic fish may not be fully functional, and also that there might an upper limit for the biological accumulation of GFP protein in marine medaka tissues. For the high-copy-number transgenic strains, such as Y01C and Z221L, it is unclear whether each transgene copy arranged in a concatemer or in multiple concatemers, is transcriptionally active. It is also not known whether each functional copy drives a similar level of transgene expression. However, despite these uncertainties, it is clear that the high-copy-number transgenic strains showing strong fluorescence expression were able to retain sufficient copies of the functional transgenes, even if a portion of these transgene copies in their genomes failed to undergo functional transcription. A similar hypothesis has been proposed for transgenic marine medaka strains carrying tissue-specific fluorescent constructs (Cho et al., 2013a, 2013b). Hence, the functional utility of such a high-copy-number transgenic line exhibiting a robust expression might be principally dependent upon its ability to maintain a sufficient number of functional copies through multiple generations. Taken together, our data suggest that a single-copy transgenic line may not always be the most desirable to achieve the strong and ubiquitous transgene expression of a fluorescent protein, at least in this fish species. Additionally, this study revealed that multivalent parameters, including transgene copy number, strength of expression, expression efficiency and stability, should be integrated to ensure selection of the best transgenic strains for ubiquitous expression of the fluorescent transgene. The 21 transgenic marine strains used in this study can be considered as candidate strains that fulfill the above requirements, unless exceptionally high levels of GFP expression are required, such as in the Y01C line.
In summary, diverse transgenic marine medaka strains harboring a GFP reporter construct under the regulation of an endogenous β-actin promoter were established, and their transgene copy number-based genotypes and expression characteristics were evaluated. Most of the transgenic lines established in this study displayed transgene insertion patterns typical of microinjection-based gene transfer, as characterized by the random integration of multiple transgene copies, often accompanied by formation of a concatemer. Most of the transgenic strains exhibited ubiquitous temporal and spatial expression patterns of the transgenic GFP over almost their entire body during their life cycle, from embryonic development to adulthood. However, the correlation between transgene copy number and expression strength varied across the transgenic strains. Overall, strength of expression showed a positive correlation with the absolute transgene copy number, as observed in the absolute value, whereas the relative expression efficiency tended to be inversely related to the copy number of the transgene integrants. Data from this study will guide the selection of potentially desirable transgenic strains with ubiquitous expression of a fluorescent transgene, not only in this marine medaka species but also in other related model fish species.