Olive flounder
Dietary nutrient requirements of fish must be satisfied for effective growth (Lee et al., 2000a, 2000b, 2002); they vary depending on several factors such as the fish species (Yamamoto et al., 2007), fish size (Page and Andrews, 1973; Tacon and Cowey, 1985), and water temperature (Balarin and Haller, 1982; Iwata et al., 1994; Peres and Oliva-Teles, 1999). Feeding regimes also affect fish performance largely (Chatakondi and Yant, 2001; Gaylord et al., 2001; Wu et al., 2003; Kankanen and Pirhonen, 2009). For example, in earlier studies (Cho, 2005; Cho et al., 2006a), we found that juvenile olive flounders subjected to food deprivation for 2 weeks still achieved full compensatory growth over 8-week trials.
Optimal feed allowance must be considered carefully because they are one of the most critical factors affecting fish performance and one of the highest costs components in fish farming (Cho et al., 2006b, 2007; Kim et al., 2010). The optimal daily feed allowance for juvenile olive flounder was reported to be 95% of satiation when fish were fed extruded pellets to satiation twice a day (Cho et al., 2006b). However, during restricted feeding, fish generally responded better to high protein and/or lipid diets (Li and Lovell, 1992; Lee et al., 2000b). Dietary nutrient content also affects fish performance when compensatory growth is achieved after food deprivation (Gayloard and Gatlin, 2001; Cho and Heo, 2011).
Therefore, feeding period, feed allowance, dietary nutrient content, and their interactions likely affect fish performance. In this study, we examined the effects of there three factors on compensatory growth, food use, chemical composition, and serum chemistry of juvenile olive.
>
Oliver flounder and the experimental conditions
Juvenile olive flounder were purchased from a private hatchery, brought to a laboratory, and acclimated for 1 week before the feeding trial. During the acclimation period, fish were fed twice a day with a commercial flounder feed containing 54% crude protein and 11% crude lipid (Suhyupfeed Co., Uiryeong-gun, Gyeongsangnam-do, Korea). We randomly chose 720 juvenile fish (mean initial body weight 6.3 g), and distributed them in 24 400-L flow-through round tanks (water volume 300 L, 30 fish per tank). The flow rate of water into each tank was 10 L/tank/min. We used sand-filtered natural seawater, and aeration was supplied into each tank. Water temperature was monitored daily at 1,500 h and ranged from 11.0 to 21.7°C(mean ± SD: 16.8 ± 2.10°C) and a photoperiod following natural conditions was used.
A 2 × 2 × 2 factorial design (diet: control (C) and high protein and lipid (HPL) × feeding period: 8 and 6 weeks × feed allowance: 100% and 90% of satiation) was applied to feeding trials (Table 1). The C diet was prepared to satisfy dietary nutrient requirements of olive flounder (Lee et al., 2000a; Lee et al., 2002; Kim and Lee, 2004), and the HPL diet was prepared by increasing the amount of fishmeal and squid liver oil at the expense of wheat flour and cellulose. Fish meal, soybean meal, casein and corn gluten meal were used as the protein sources. Wheat flour and dextrin were used as carbohydrate sources, and soybean and squid liver oils were used as lipid sources. The ingredients of the experimental diets were mixed well with water at a ratio of 3:1 and pelletized using a pellet extruder. The diets were dried at room temperature overnight and stored at -20°C until use. Two feeding periods were implemented after 2 weeks of food deprivation. One group of fish was fed twice daily for 8 weeks and another group twice daily for 6 weeks. Finally, one group of fish was fed to 100% satiation and a second group to 90% satiation, twice daily (08:00 and 17:00). The 90% satiation allowance was determined based on the mean amount of food consumption. We weighed all fish at the end of the 8-week trial. Each treatment was implemented in triplicate.
[Table 1.] Ingredients and chemical composition (%, DM basis) of the experimental diets
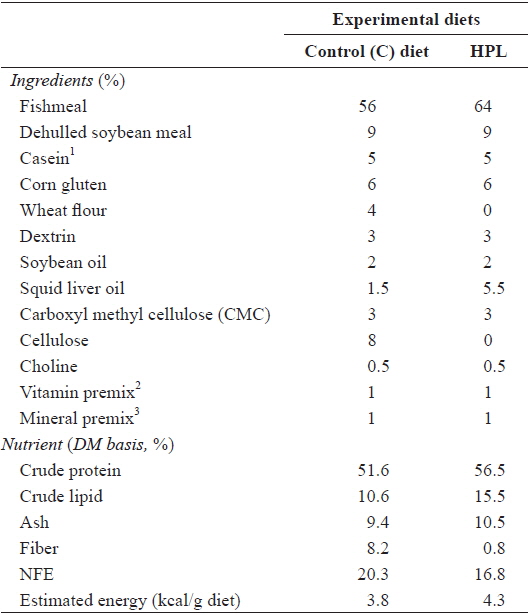
Ingredients and chemical composition (%, DM basis) of the experimental diets
>
Analytical procedures of the experimental diets and fish
Fish were starved for 1 day before sampling. Ten and five fish were sacrificed for proximate analysis at the beginning and end of the feeding trials, respectively. Crude protein was determined using the Kjeldahl method (Kjeltec 2100 Distillation Unit, Foss Tecator, Hoganas, Sweden), crude lipid was determined using an ether-extraction method (Soxtec TM 2043 Fat Extraction System, Foss Tecator, Sweden), moisture was determined by oven drying at 105°C for 24 h, fiber was determined using an automatic analyzer (Fibertec, Tecator, Sweden), and ash was determined using a muffle furnace at 550°C for 4 h; all methods were implemented according to the standards of AOAC (1990).
Blood samples were obtained from the caudal veins of three randomly chosen fish from each tan which were starved for 24 h prior to sampling. Plasma was collected after centrifugation (900 g for 10 min), and stored at -70°C as separate aliquots for analysis of total protein, glucose, glutamate oxaloacetate transaminase (GOT), glutamate pyruvate transaminase (GPT), and triglyceride; we used an automatic chemistry system (Vitros DT60 II, Vitros DTE II, DTSC II Chemistry System, Johnson and Johnson Clinical Diagnostics Inc., Rochester, NY, USA) for analysis. In addition, total plasma T3 (triiodothyronine) and T4 (thyroxine) hormones of fish were analyzed after feeding trials using a radio-immunoassay (Gamma Counter, Cobra II, Packard, USA) using Coat-A-Count kit (DPC, Los Angeles, CA, USA).
>
Calculations and statistical analysis
We calculated the following variables: specific growth rate (SGR), %/day = 100 × [(Ln final weight of fish - Ln initial weight of fish) / days of feeding]; food efficiency ratio (FER) = weight gain of fish / dry feed consumed; protein efficiency ratio (PER) = weight gain of fish / protein consumed: condition factor (CF) = body weight (g) / total length (cm)3 × 100; and hepatosomatic index (HSI) = liver weight (g) / body weight (g) × 100.
Three-way ANOVA were used to compare the effects of diet, feeding period, and daily food allowance on performance, food use, biochemical composition, and serum chemistry of olive flounder. When a significant effect was found at α = 0.05, we used Duncan`s multiple range test (Duncan, 1955) for multiple comparisons of means. All statistical analyses were conducted using SAS version 9.3 (SAS Institute, Cary, NC, USA).
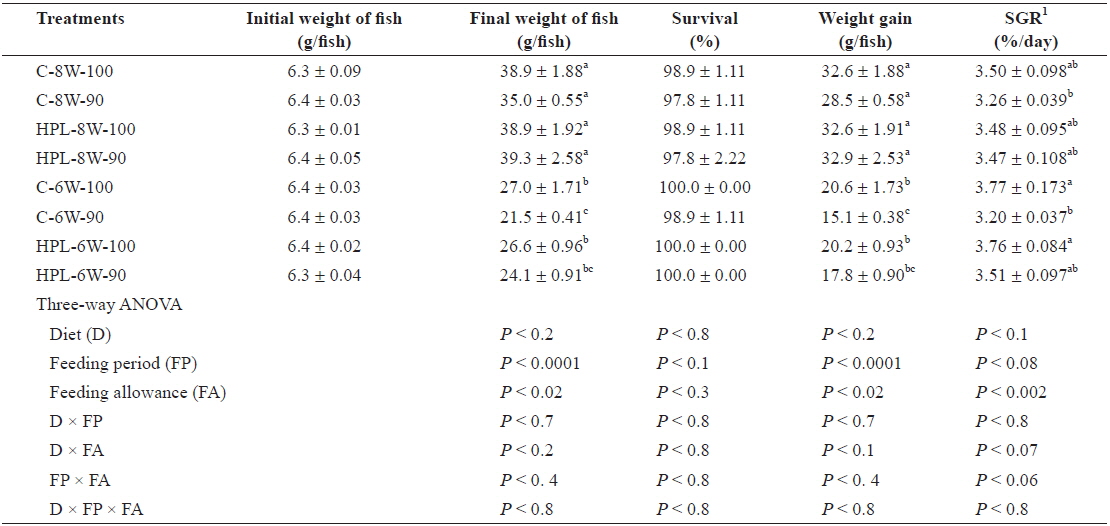
The survival rates of olive flounder ranged from 97.8% to 100% and were not affected by diet, feeding period, or feed allowance (Table 2). However, the weight gain in the fish was affected by both feeding period (

Survival (%), weight gain (g/fish), and specific growth rate (SGR) of olive flounder Paralichthys olivaceus fed the experimental diets at different feeding period and daily feeding ration
Food consumption of fish (g/fish) was significantly affected by both feeding period (
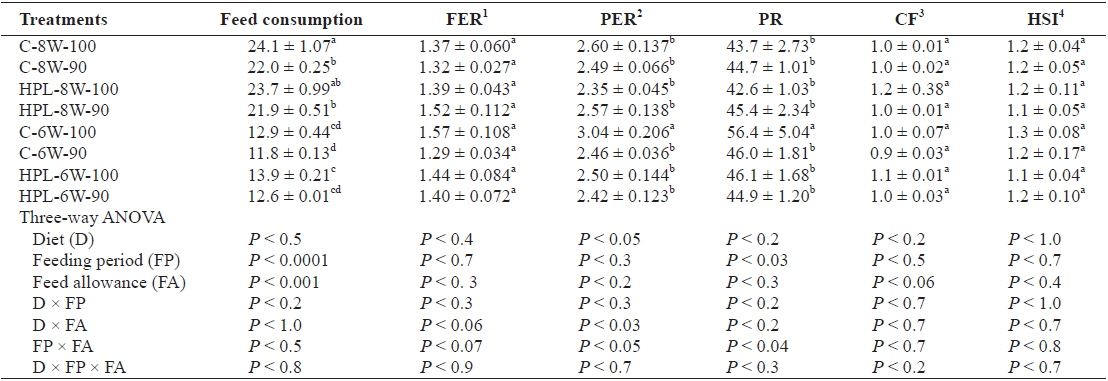
Feed consumption (g/fish), food efficiency ratio (FER), protein efficiency ratio (PER), protein retention (PR), condition factor (CF), and hepatosomatic index (HSI) of olive flounder Paralichthys olivaceus fed the experimental diets at different feeding period and daily feeding ration
FER was not affected by diet, feeding period, or feed allowance. However, PER and PR was affected by diet (
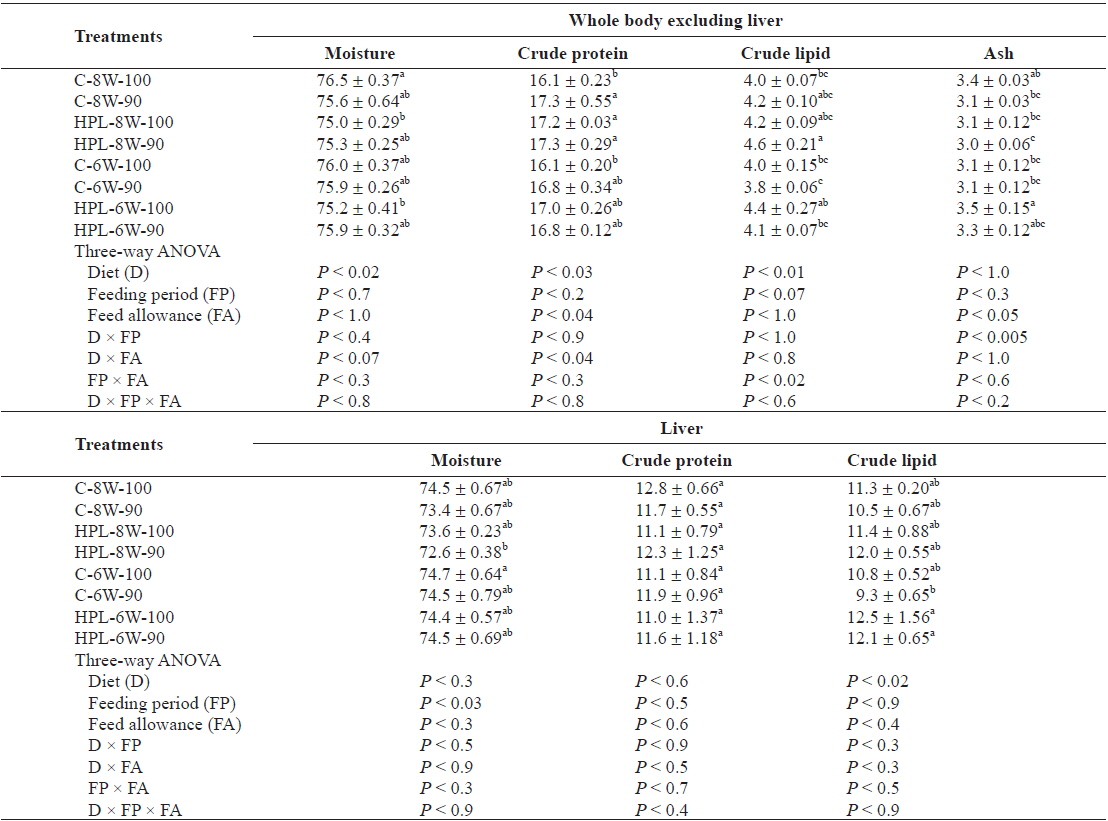
The moisture content of the whole body excluding the liver of olive flounder was significantly affected by diet (

Chemical composition (%, wet weight basis) of the whole body excluding liver, and liver of olive flounder Paralichthys olivaceus fed the experimental diets at different feeding period and daily feeding ration
Plasma total protein, glucose, GOT, GPT, triglyceride and T3 were not affected by diet, feeding period or feed allowance. However, plasma cholesterol and T4 were affected by diet (
Weight gain of fish fed for 8 weeks groups was higher than that of fish fed for 6 weeks groups after 2-week feed deprivation regardless of diet, feeding period and feeding ration in this study. However, no significant difference in weight gain of fish between C-8W-100 treatment in which fish were fed daily to satiation and C-8W-90 treatment in which fish were fed daily to 90% of satiation for 8 weeks in this study probably indicated that feeding ration could be lowered up to 90% of satiation, partially agreeing with Cho et al. (2006b)’ study showing that optimum daily feeding ratio for juvenile olive flounder averaging 17 g was estimated to be 95% of satiation when fish were fed the extruded pellet containing 51.9% crude protein and 8.1 crude lipid twice a day at various daily feeding ration (100%, 95%, 90%, 85%, 80%, 75% and 70% of satiation) at mean temperature of 23.6°C for 7 weeks. Daily feeding ratio could be lowered up to 90% of satiation for subadult olive flounder averaging 319 g fed the extruded pellet containing 49.5% crude protein and 9.2% crude lipid with various feeding ratio (100%, 95%, 90%, 85% and 80% of satiation) at mean temperature of 21.1°C for 10 weeks without growth retardation (Cho et al., 2007). SGR of fish was affected by daily feeding ration, but not by either diet or feeding period in this study. Since water temperature is one of the most important factors affecting feed consumption by fish, fluctuation of water temperature resulted from occurrence of coldwater mass could also affect feed consumption (hyperphagia) and compensatory growth of olive flounder in this study. However, unlike this study, juvenile olive flounder were able to achieve full compensatory growth regardless of temperature exposure when fish were exposed at various temperature of 8.5, 13.0, 17.5, 22 and 26.5°C for 10 days and then grew 22°C for 30 days.
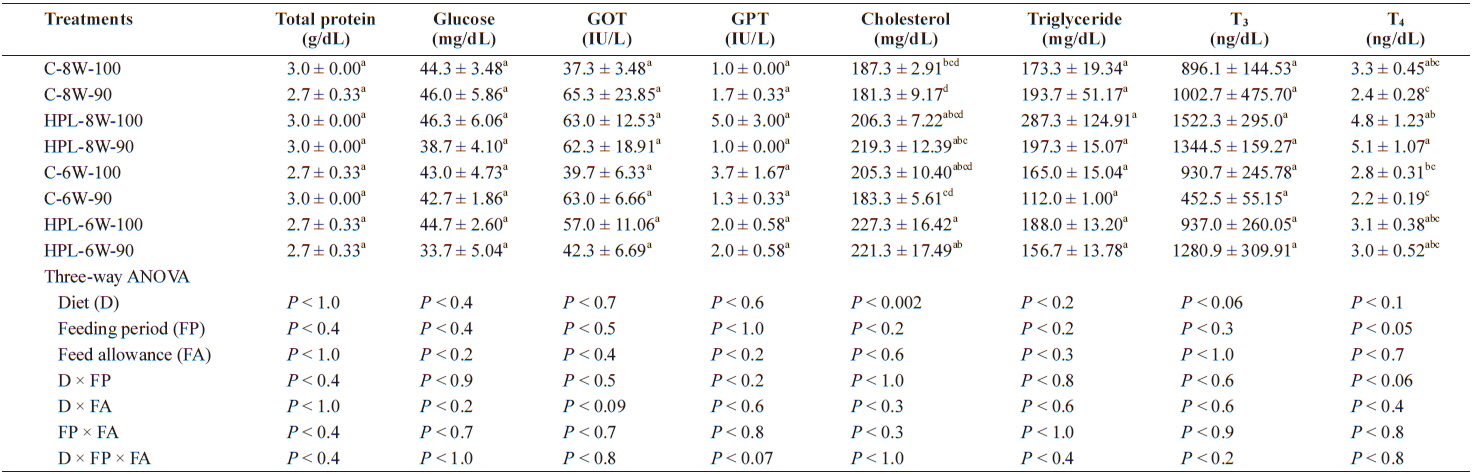
Plasma chemical composition of olive flounder Paralichthys olivaceus at the end of the 8-week trial
Poorer weight gain of olive flounder in HPL-6W-100 treatment compared to that of fish in C-8W-100 treatment contradicted with Cho and Heo (2011)’s study showing that an increased dietary protein and lipid content effectively improved compensatory growth of olive flounder refed for 6 weeks after 2-week feed deprivation. This difference was probably resulted from that in fish size. The smaller fish (6.3 g) in this study compared to 35.9 g in their study was more susceptible to feed deprivation, agreeing to Bilton and Robins (1973)’s study, so full compensation was not achieved in this study. Another reason for poor weight gain of fish in HPL-6W-100 treatment could be difference in water temperature in this study (mean temperature of 16.8°C) and Cho and Heo (2011)’s study (mean temperature of 21.8°C). Because olive flounder at low temperature consumed less feed in this study, fish refed for 6 weeks after 2-week feed deprivation could not achieve full compensatory growth.
Feed consumption was proportion to both weeks of feeding and feeding ratio. Less feed consumption of fish fed for 6 week groups compared to that of fish fed for 8 week groups regardless of diet, feeding period and feeding ration probably explained that why fish could not catch up full compensatory growth in the former in this study, unlike other studies (Chatakondi and Yant, 2001; Wu et al., 2003; Cho, 2005; Cho et al., 2006a; Kankanen and Pirhonen, 2009) showing that hyperphasia was commonly observed in fish achieving full compensatory growth after feed deprivation for a certain period of time. Fish did not show the improved feeding activity right after refeeding in this study.
FER was affected by none of diet, feeding period or feeding ration in this study. However, PER and PR was affected by diet and feeding period, respectively. Generally speaking, improvement in FER and/or PR of fish achieving full compensatory growth was observed in other studies (Gaylord and Gatlin, 2001; Cho, 2005; Kim et al., 2010; Cho and Heo, 2011). CF and HSI of olive flounder was affected by none of diet, feeding period or feeding ration in this study. However, HSI was a good index to indicate compensatory growth of fish (Gaylord and Gatlin, 2000; Cho, 2005, 2012), but it is still controversial. Bavcevic et al. (2010) proposed that one should always analyze length (or some other measure that incorporates length, such as condition) when characterizing compensatory growth because gilthead sea bream (
Body content of fish was affected by at least one of the main factors (diet, feeding period and feeding ration) except for crude protein content of the liver in this study. Crude lipid content of the whole body excluding liver in fish was affected by diet, but not by either feeding period or feeding ration. However, unlike this study, the various feeding ration did not affect body composition of olive flounder (Cho et al., 2007; Kim et al., 2007). Body lipid content of olive flounder decreased proportion to week of feed deprivation when fish were starved for 4 weeks (Cho, 2005). A high protein and lipid (HPL) diet tended to produce high body fat of fish in this study, agreeing with other studies (Hillestad and Johnsen, 1994; Catacutan and Coloso, 1995; Lee et al., 2000a, b; Cho and Heo, 2011).
Plasma cholesterol and T4 of fish was affected by diet and feeding period, respectively. Plasma cholesterol content of fish in HPL-6W-100 treatment was higher than that of fish in C-8W-100, C-8W-90 and C-6W-90 treatments. Administration of HPL diet increased serum cholesterol of fish in this study, agreeing with other studies showing that animals fed on the high fat diet increased plasma triglyceride and cholesterol (Mlekusch et al., 1991; Gray et al., 1993). Plasma T4 content of fish in HPL-8W-90 treatment was higher than that of fish in C-8W-90, C-6W-100 and C-6W-90 treatments. Unlike this study, however, the high protein diets increased plasma T3 levels of fish (Riley et al., 1993; MacKenzie et al., 1998) and plasma T3 level played a role to effectively improve compensatory growth of channel catfish (
In conclusion, weight gain of juvenile olive flounder was affected by both feeding period and ration, but not by diet. However, full compensatory growth of fish was not achieved at restricted feed allowance in this experimental condition.