Cross-linked Polyethylene (XLPE) has been widely used as an insulation material in high voltage alternating current (HVAC) power cables, and recently, has been shown to be a potential candidate for insulation material in high voltage direct current (HVDC) power cables [1,2]. However, XLPE insulation is susceptible to partial discharges, electrical trees and space charge accumulation, etc., which have a detrimental effect on its resistance to dielectric breakdown [3]. Considering the need for HVAC power cables to offer good reliability over long time periods, as well as the HVDC power cables development trend, there is a great interest in improving the dielectric properties of XLPE insulation.
Nanodielectrics, defined as composites containing nanofillers (i.e., fillers with at least one dimension less than 100 nm) embedded in a dielectric matrix (e.g., a polymer), have great potential for serving this purpose as they can present superior dielectric properties compared to conventional dielectrics and dielectric microcomposites [4-11]. XLPE-based nanodielectrics containing silica nanoparticles can present improvements in several key dielectric properties over neat XLPE, such as increased dielectric breakdown strength, enhanced voltage endurance, enhanced partial-discharge resistance and reduced space charge accumulation [12-16]. As a result, they have been suggested as a potential insulation material candidate in MV and HV power cables [17]. To facilitate a homogeneous filler dispersion and a good binding at the filler-matrix interface, modifications/functionalizations of the surface of the silica nanoparticles by dispersants or coupling agents have been widely adopted [8,18].
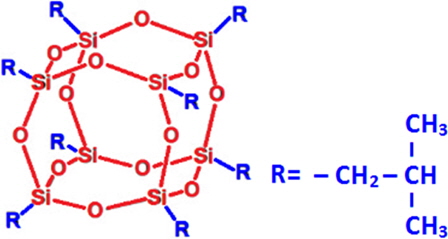
Polyhedral Oligomeric SilSesquioxanes (POSS) have the potential to enhance the dielectric properties of PE, just as do functionalized silica nanoparticles. A POSS is a nanoscaled molecule (typically 1~5 nm) composed of a small number (typically 6, 8 or 10) of silsesquioxane units, RSiO1.5, where R is one of an extremely- wide-range of functional groups, including but not limited to hydrogen, organyl and halogen. Among the known structures of POSS molecules, the cage structure is the most typical. Figure 1 presents a cage-structured OctaIsoButylPOSS (OibPOSS) molecule. As can be seen, each of the eight silicon atoms locates at a vertex of the oxygen-silicon cage and carries an exo cage functional group R (isobutyl group) tetrahedrally coordinating around the silicon vertex [19-21].
In a sense, a POSS molecule can be viewed as the smallest silica particle with a built-in layer of functionality, which can act either as a dispersant or as a coupling agent. The functionality can be readily chosen to make POSS (i) have compatibility, and thus physically mix with the PE matrix (as in the case of unreactive POSS) or (ii) react, and thus chemically bond to the PE matrix (as in the case of reactive POSS). In nanodielectrics obtained from the addition of compatible unreactive POSS, the inorganic silicon-oxygen cages disperse in PE in nanoscaled domains at a thermodynamically stable state without any part of them being chemically bonded to any part of the PE chains. In nanodielectrics obtained from the synthesis of reactive POSS, the inorganic silicon-oxygen cages are covalently bonded to the PE chains, thus tailoring the PE properties at the molecular level [22].
Unreactive POSS was chosen as the focus of this work. Many studies have been conducted on PE-based and PP-based nanocomposites containing unreactive POSS, typically Octa- MethylPOSS (OmPOSS), OibPOSS and IsoOctylPOSS (IoPOSS), regarding their crystallization behavior [23-25], rheological and viscoelastic behavior [26], and their morphological, thermal and mechanical properties [27-29]. It has been shown that in some cases, POSS can improve the thermal stability, the fire retardance, the modulus, and the tensile strength of the polymer (a detailed review can be found in [22]). Despite the potential of POSS to enhance the dielectric properties of the polymer, only few studies have been conducted on the dielectric properties of PE/POSS and PP/POSS nanodielectrics. Takala et al. showed that the AC breakdown strength of PP is increased by 22% with the incorporation of 3 wt% of OmPOSS, and by 11% with the incorporation of 5 wt% of IoPOSS [30]. Huang et al. showed that the AC breakdown strengths of LDPE/POSS composites are higher than that of neat LDPE in the low failure probability region [31]. Some previous works by the authors of this manuscript showed that the dielectric properties of PE/POSS composites are similar to those of neat PE [32-35].
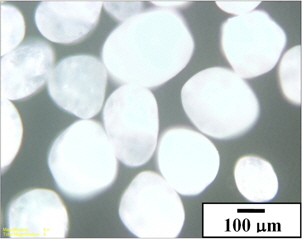
The methods used to fabricate nanodielectrics containing silica nanoparticles, such as melt blending and solution blending [18,36], generally concentrate on preventing nanoscaled silica particles from agglomerating into larger sizes. The approach used here to obtain POSS-containing nanodielectrics, however, involves a top-down strategy to break microscaled POSS into nanofillers. The reason for this is that although POSS are nanoscaled molecules, the vast majority of them exist in the form of crystalline solids [20]. For example, as can be seen in Fig. 2, the as-received OibPOSS powder is in a crystalline solid form ranging from 100~200 μm.
With the goal of (i) breaking crystalline POSS from micronscale to nanoscale and (ii) freeing POSS molecules from their crystalline structure, high-energy ball milling, which involves high-energy impact forces and friction forces [37], was tested in this work as a method for producing UHMWPE-based nanodielectrics containing 1 wt% and 5 wt% OibPOSS. UHMWPE was chosen as the matrix instead of XLPE, as it has similar dielectric properties as XLPE, but can more easily be recycled. OibPOSS was criteriously chosen as the type of POSS in this work due to its compatibility with PE, as explained in the “Basic material considerations” section. Prior to sample preparation, ball milling conditions were chosen, as discussed in the “Experimental” section. With the chosen ball milling conditions, UHMWPE powder and OibPOSS powder were ball milled in the desired mass fractions. After ball milling, UHMWPE/OibPOSS composite powders were compression-molded. The resulting plates were characterized with thermogravimetric analysis, scanning electron microscopy, broadband dielectric spectroscopy, and progressive-stress breakdown tests.
2. BASIC MATERIAL CONSIDERATIONS
The dispersion of OibPOSS within the PE matrix largely depends on the compatibility between these two materials: the higher the compatibility between OibPOSS and PE, the greater the likelihood of a nanoscaled dispersion of OibPOSS within the PE matrix. In this section, the compatibility between OibPOSS and PE is explored by qualitative and quantitative evaluations.
A qualitative evaluation was performed based on the empirical “like dissolves like” rule. It predicted that OibPOSS is compatible with PE. This is because the functional group of OibPOSS, which is a non-polar saturated hydrocarbon, has a similar polarity as PE. Moreover, the functional group locates at the periphery of the central silicon-oxygen cage, and can thus physically provide a non-polar screening to the polar cage, causing POSS to appear to be “like” PE.
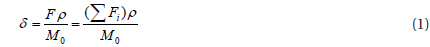
A quantitative evaluation was carried out by calculating the Hildebrand solubility parameter of OibPOSS with Hoy’s group contribution method using eq. 1 [39]:

Here, δ ((MPa)1/2), F ((MPa)1/2·cm3/mol), ρ (g/cm3), and M0 (g/mol) are respectively the solubility parameter, the molar attraction constant, the density, and the molar mass of the substance in question. F is estimated by the sum of the molar attraction constants of the groups composing the substance, i.e., F=ΣFi.
In the case of OibPOSS, the groups that compose it are Si-O, -CH2-, >CH-, and -CH3. The molar attraction constants of -CH2-, >CH-, and -CH3 can be found in Hoy’s table as 269, 176, and 303.4 (MPa)1/2·cm3/mol, respectively [39 p. 194]. The molar attraction constant of Si-O (not provided by Hoy’s table) was calculated as 148.3~306.9 (MPa)1/2·cm3/mol, using poly(dimethylsiloxane) ([-Si(CH3)2O-]n) (ρ=0.98 g/cm3, M0=74 g/mol, δ=10~12.1 (MPa)1/2 [40 p. VII/690, 41]). Substituting the molar attraction constants of Si-O, -CH2-, >CH-, and -CH3, as well as the density (1.13 g/ cm3) and the molar mass (873.6 g/mol) of OibPOSS [20] into eq. 1, the solubility parameter of OibPOSS is calculated as 15.5- 20.4 (MPa)1/2. As can be seen, it is similar to that reported for PE, which is 15.8~18.4 (MPa)1/2 [40 p. VII/704]. Based on the proposition by Hildebrand that the solubility between the two substances is high when their solubility parameters are close, it can similarly be predicted that OibPOSS is compatible with PE.
It is worth mentioning that, with the same procedures illustrated above, OmPOSS (R=methyl group) and IoPOSS (R=isooctyl group) were also evaluated as being compatible with PE. Furthermore, OmPOSS was predicted to have the lowest compatibility with PE, while OibPOSS had a medium compatibility, and IoPOSS, the highest. This is because the longer and more oblate the non-polar functional group (IoPOSS>OibPOSS>OmPOSS), the more it is able to chemically dominate the polarity of POSS as well as to physically screen the polar silicon-oxygen cage, and consequently, the higher the likely compatibility between POSS and PE. Moreover, it would appear that the solubility parameters calculated for OmPOSS (16.7~27.4 (MPa)1/2), OibPOSS (15.5~20.4 (MPa)1/2) and IoPOSS (14.9~17.8 (MPa)1/2) respectively have the narrowest, the medium, and the widest overlapping ranges with that reported for PE (15.8~18.4 (MPa)1/2).
Despite the potential of OmPOSS and IoPOSS to form nanodielectrics with PE, only OibPOSS was studied in this work. This is because OmPOSS changes its chemistry during ball milling, as confirmed by Fourier Transform InfraRed spectroscopy (FTIR) and thermogravimetry analysis (see Appendix I for details), while IoPOSS is in liquid form, and not suitable for ball milling.
UHMWPE powder (nominal average particle size ≈ 150 μm, molecular weight 3~6 million) was purchased from Alfa Aesar (Product No. 43951). OibPOSS powder (average particle size ≈ 200 μm) was purchased from Hybrid Plastics (Product No. MS0825).
As mentioned in the “Introduction” section, ball milling was attempted in order to produce nanodielectrics having nanoscaled crystalline POSS or POSS molecules embedded within the PE matrix. In this work, a high-energy shaker mill (SPEX CertPrep 8000) was used. As described in detail in [37], during the ball milling process, a vial containing sample and grinding balls is secured by a clamp and swung energetically in a ‘∞’ pattern, as a combination of back-and-forth shaking motion and lateral movements of the ends of the vial. The sample gets milled and mixed with each swing of the vial, when the balls impact the sample against the end of the vial. Considering the sufficient amplitude and the high speed of the clamp motion, the balls’ velocities are high, and consequently, the impacts are usually highenergy impacts.
Ball milling is a complex process, and thus requires the optimization of several variables, such as the vial material, the material and the size distribution of the grinding balls, the ball-to-powder weight ratio (BPR), and the milling time [37]. In this work, a type of insulation ceramic, zirconia, was chosen as the material for the vial and the grinding balls in order to diminish the threat their contamination may pose to the insulation properties of the sample. A BPR of 10 was used as it is most commonly used in a small capacity mill such as a SPEX mill. A combination of large and small balls was used as that is believed to produce the highest impact forces and friction forces. One ball 15 mm in diameter, two balls 10 mm in diameter, and five balls 5 mm in diameter were used to ensure high milling energy as well as to spare enough space for the balls and the sample to move around freely in the vial. A milling time of 30 minutes was used as the OibPOSS powder was shown, by particle size analysis, to reach its smallest possible size at this moment (see Appendix II for details).
With the milling conditions described above, as-received UHMWPE powder and as-received OibPOSS powder were ball milled according to a 100/0%, 99/1%, and 95/5% mass fraction. Consequently, UHMWPE powder (as the control group), UHMWPE/ OibPOSS (99/1) and UHMWPE/OibPOSS (95/5) composite powders were produced.
The three types of powders obtained from ball milling were respectively compression molded into an approximately-0.5 mm thick plate and an approximately-0.23 mm thick plate under a pressure of 6.3×10⁶ Pa and an average temperature of 150℃.
Samples of
3.4 Characterization techniques
Thermogravimetry analyses were conducted on UHMWPE, UHMWPE/OibPOSS (99/1), and UHMWPE/OibPOSS (95/5) to confirm whether the right amount of OibPOSS (i.e., 1 wt% and 5 wt%) had been incorporated into the relevant composite, as well as to study the thermal stability of the composites in comparison with that of UHMWPE. In order to better understand the thermogravimetric features of the materials in question, as-received OibPOSS powder was also tested. The tests were run using a TA Q50 instrument. Samples of about 12 mg were put in a platinum pan and heated from 30℃ to 600℃ at a rate of 10℃/min in nitrogen atmosphere (balance gas flux: 40 mL/min, sample gas flux: 60 mL/min). Thermogravimetric data was recorded with a sampling interval of 0.5 s/pt. In order to increase the reliability of the results, two samples were tested for each type of material.
To evaluate the size dispersion and the spatial distribution of OibPOSS within the UHMWPE matrix, the cross-sections of UHMWPE, UHMWPE/OibPOSS (99/1), and UHMWPE/OibPOSS (95/5) were observed with a Hitachi 3600N scanning electron microscope at an electron accelerating voltage of 5 kV. The crosssection of each type of material was obtained by cutting its 0.5 mm plate (cooled to around -130℃) with a diamond knife in a microtome (Leica RM2255). Furthermore, it was sputtered with a 2 nm platinum layer in a Quorum Q150T S machine prior to the microscopic observation. In order to increase the reliability of the observation, at least two cross-sections were prepared for each type of material, and several spots were observed on each cross-section.
The dielectric constant and dielectric loss of UHMWPE, UHMWPE/ OibPOSS (99/1), and UHMWPE/OibPOSS (95/5) were obtained using a Novocontrol broadband dielectric spectrometer. For each type of material, a sample with a thickness of around 0.5 mm and a diameter of 30 mm was tested. To ensure a good contact between the sample and the electrodes, the sample was first sandwiched between two soft and flexible silver foils (0.06 mm thickness, 30 mm diameter each). The silver foil-samplesilver foil structure was then placed between two round plate electrodes (2.35 mm thickness, 30 mm diameter each). To increase the accuracy of the end results, an edge compensation (= 2.41 mm) on electrode thickness was used. During the measurement, an AC voltage of Vrms=3 V was applied to the sample in a 10- 2-3×10⁶ Hz frequency range at 23℃. The equipment recorded the current and the phase shift between the current and the voltage, and then calculated the complex dielectric permittivity of the sample based on the input sample geometry and edge compensation value.
The AC progressive-stress dielectric breakdown strength of UHMWPE, UHMWPE/OibPOSS (99/1), and UHMWPE/OibPOSS (95/5) were tested according to ASTM Standard D149 [42] at 23℃ and a relative humidity of 23%-26%. For each progress-stress test, a sample with a thickness of around 0.23 mm (standard deviation: 0.009-0.01) and a diameter of 20 mm was placed between a pair of cylindrical rod electrodes (6.4 mm in diameter with edges rounded to 0.8 mm). Both the sample and the electrodes were immersed in an insulating fluid (Luminol TR-i, Type II Inhibée, Petro-Canada Lubricants Inc.). An AC voltage (60 Hz) with a constant rate of rise of 2 kV/s was then applied on the sample from zero until breakdown occurred (at an average time of 10-20 s). This was repeated for a set of 10 samples for each type of material, and the breakdown voltage of each sample was recorded. The insulating fluid was replaced with a new one after the test series for each type of material. A statistical analysis of the breakdown data was performed in accordance with [43].
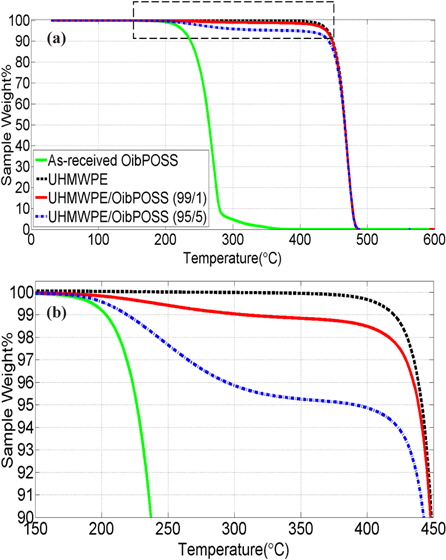
4.1 ThermoGravimetry Analysis (TGA)
The thermogravimetric behaviors of as-received OibPOSS, UHMWPE, UHMWPE/OibPOSS (99/1), and UHMWPE/OibPOSS (95/5) are shown in Fig. 3(a). A magnified view of Fig. 3(a) in the 150~450℃ range is shown in Fig. 3(b).
It can be seen from Fig. 3(a) that the weight loss of UHMWPE takes place in one step, with the maximum weight loss rate at Tmax=470℃. It can also be seen that the weight loss of Oib- POSS takes place in two steps, with the major weight loss (92%, Tmax=270℃) due to the evaporation of OibPOSS, while the minor one (8%, Tmax=311℃) is possibly related to the degradation of a more stable phase formed during the heating throughout the first step [44]. In the case of the UHMWPE/OibPOSS (99/1) and UHMWPE/OibPOSS (95/5) composites, their weight losses take place in two steps, with the first step (Tmax=241℃ and 246℃ for 1 wt% and 5 wt%, respectively) most likely corresponding to the evaporation of OibPOSS and the degradation of the more stable phase, and the second step (Tmax=470℃ for both 1 wt% and 5 wt%) related to the degradation of UHMWPE. For all types of samples, a negligible residue is left above 500℃.
It can be seen from Fig. 3(b) that a 99% weight loss plateau and a 95% weight loss plateau can be found near the end of the first step for UHMWPE/OibPOSS (99/1) and UHMWPE/OibPOSS (95/5), respectively. This confirms that the right amount of Oib- POSS has been introduced into the relevant composite.
The thermogravimetric behavior of the samples indicates that the incorporation of OibPOSS does not have any obvious effect on the thermal stability of UHMWPE in nitrogen atmosphere. This may result from the fact that OibPOSS simply evaporates and degrades at a temperature lower than the degradation temperature of UHMWPE.
4.2 Scanning electron microscopy (SEM)
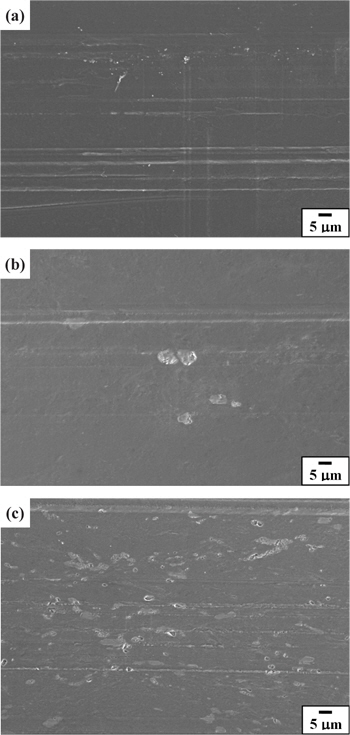
Figure 4 presents the SEM images of (a) UHMWPE, (b) UHMWPE/ OibPOSS (99/1) and (c) UHMWPE/OibPOSS (95/5). It can be seen from Fig. 4(a) that the cross-section of UHMWPE is reasonably clean, bearing a few cutting traces and zirconia impurities (as confirmed by energy-dispersive X-ray). As can be seen from Fig. 4(b), OibPOSS disperse in UHMWPE/OibPOSS (99/1) at the micron scale (2~8 μm). Moreover, they have a poor spatial distribution, and can seldom be found within UHMWPE/Oib- POSS (99/1). As can be seen from Fig. 4(c), OibPOSS disperse in UHMWPE/OibPOSS (95/5) at a submicron to micron scale, with a seemingly homogeneous spatial distribution.
The observed morphology of UHMWPE/OibPOSS (99/1) and UHMWPE/OibPOSS (95/5) indicates that ball milling is an effective method for producing UHMWPE/OibPOSS dielectric composites, but appears ineffective in dispersing OibPOSS at the nanoscale.
4.3 Broadband dielectric spectroscopy (BDS)
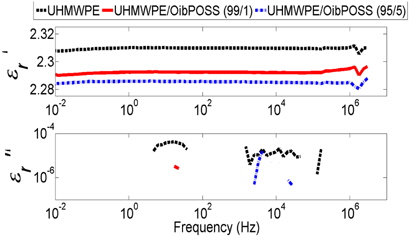
Figure 5 presents the variation of the relative real and imaginary permittivity of UHMWPE, UHMWPE/OibPOSS (99/1) and UHMWPE/OibPOSS (95/5) as a function of frequency. It can be seen that the relative real permittivity/dielectric constant (εr') of UHMWPE/OibPOSS (99/1) and UHMWPE/OibPOSS (95/5) is almost the same as that of UHMWPE, with a value of 2.3 over a wide frequency span, ranging from 10-2 to 106 Hz. The relative imaginary permittivity/dielectric loss (εr") of UHMWPE/ OibPOSS (99/1) and UHMWPE/OibPOSS (95/5) is also almost the same as that of UHMWPE, which is too low (10-6~10-4) to be measured accurately. This indicates that the incorporation of 1 wt% and 5 wt% of OibPOSS has little effect on the dielectric response of UHMWPE. This may be attributed to the compatibility between OibPOSS and PE.
4.4 Progressive-stress breakdown tests (PSB)
Many studies have suggested that progressive-stress dielectric breakdown (or short-time dielectric breakdown) is an electronic process caused by high-energy free electrons (i.e., free electrons which, in the acceleration of the electric field, gain sufficient energy to ionize the macromolecules of the polymer) [45-47]. In this aspect, measures that can decrease the
The effects micron fillers can have on the dielectric breakdown strength of PE are explored as follows: (1) Micron fillers can act as scattering sites for electrons; (2) Inorganic micron fillers (e.g., microsilica) are usually more resistant to partial discharges than PE, and can thus protect PE from erosion; (3) In the interphase region of the micron filler and the PE, there may be changes in PE chain mobility, local PE structure, and local charge distribution, which, when a critical interfacial area is reached, may result in an increase in the density and/or the depth of the charge-carrier trapping states [16]; (4) Micron fillers introduce microscopic voids at the fillermatrix interface; (5) As PE usually has a smaller dielectric constant than inorganic micron fillers (e.g., microsilica), it is exposed to a higher electrical filed.
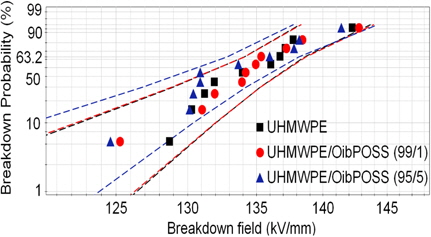
The negative effects of (4) and (5) dominate over the positive effects of (1-3), resulting in XLPE/microsilica composite with a significantly reduced dielectric breakdown strength compared to neat XLPE [13 p. 147]. However, in the case of UHMWPE/Oib- POSS microcomposites, as can be seen from Fig. 6, the Weibulll distribution of UHMWPE, UHMWPE/OibPOSS (99/1) and UHMWPE/OibPOSS (95/5), and in Table 1, which presents the experimental values of the scale parameter and the shape parameter of the Weibull distribution, the breakdown strengths of UHMWPE/ OibPOSS composites are similar to that of UHMWPE. This may due to the fact that micronscaled OibPOSS, when compared to microsilica, introduce fewer microscopic voids at the filler-matrix interface thanks to its compatibility with PE. Moreover, the dielectric constant of OibPOSS may be low due to its non-polarity (as discussed in the “Basic material considerations” section), as well as the free volumes in its Si-O-Si cage and those brought by the steric hindrance of its functional group [48,49]. Therefore, the negative effects of (4) and (5) get suppressed and no longer dominate the dielectric breakdown strength of the composite. As a matter of fact, the positive effects of (1-3) are able to counteract those negative effects, resulting in an unchanged dielectric breakdown strength.
[Table 1.] Scale and shape parameters of the Weibull distribution.
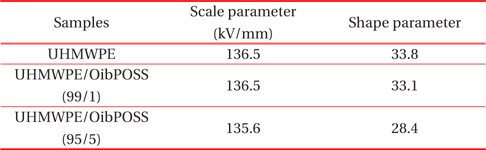
Scale and shape parameters of the Weibull distribution.
High-energy ball milling was tested as a method for producing UHMWPE-based nanodielectrics containing 1 wt% and 5 wt% OibPOSS. Both a qualitative evaluation, based on a “like dissolves like” empirical rule, and a quantitative evaluation, based on the calculation of Hildebrand solubility parameters, predicted that OmPOSS would have the lowest compatibility with PE, OibPOSS a medium compatibility, and IoPOSS, the highest. However, only OibPOSS was studied in this work as OmPOSS changes its chemistry during ball milling (as confirmed by FTIR and TGA), while IoPOSS is in liquid form, and not suitable for ball milling. Several ball milling variables were optimized in a bid to achieve UHMWPE/ OibPOSS nanodielectrics. UHMWPE (as a control group), and its composites containing 1 wt% and 5 wt% of OibPOSS were produced with the chosen milling conditions following compression molding. The morphology, as well as the thermal and the dielectric properties of the samples, were characterized by SEM, TGA, BDS and PSB. Microscopic observation showed that ball milling was an effective method for producing UHMWPE/Oib- POSS dielectric composites, but appeared ineffective in dispersing OibPOSS at the nanoscale. The thermogravimetric behavior of the samples (i) confirmed that the right amount of OibPOSS (i.e., 1 wt% and 5 wt%) had been introduced into the relevant composite, and (ii) indicated that the incorporation of OibPOSS did not have any obvious effect on the thermal stability of UHMWPE in nitrogen atmosphere. This may have been due to the fact that OibPOSS simply evaporated and degraded at a temperature lower than the degradation temperature of UHMWPE. The relative real and imaginary permittivity of the UHMWPE/OibPOSS composites were similar to those of UHMWPE. This may be attributed to the compatibility between OibPOSS and PE. Progressive- Stress tests showed that the breakdown strengths of UHMWPE/ OibPOSS composites were similar to that of UHMWPE. This may due to the counteracting of the negative effects (i.e., microscopic voids, large dielectric permittivity) and the positive effects (electron scattering, electron trapping, resistance to partial discharges) brought about by the micronscaled OibPOSS.
APPENDIX I: FTIR and TGA on ball milled OmPOSS powder
OmPOSS powder ball milled for over 5 minutes presents a darker color than as-received OmPOSS powder, as confirmed by visual observation. In order to study the cause and effect of this color change, as-received OmPOSS powder and OmPOSS powder ball milled for 5 min, 15 min, and 75 min, respectively, were tested by FTIR and TGA. FTIR was performed on a Thermo Electron Corporation Nicolet 6,700 spectrometer at room temperature in transmission mode, with a resolution of 4 cm-1. The powders of interest were mixed with KBr pellets before being subjected to the test. TGA was conducted with a TA Q50 instrument. Powder samples of about 10 mg were put in a platinum pan and heated from 30℃ to 600℃ at a rate of 10℃/min in nitrogen atmosphere (balance gas flux: 40 mL/min, sample gas flux: 60 mL/min). Thermogravimetric data was recorded with a sampling interval of 0.5 s/pt.
>
A. Fourier Transform InfraRed Spectroscopy (FTIR)
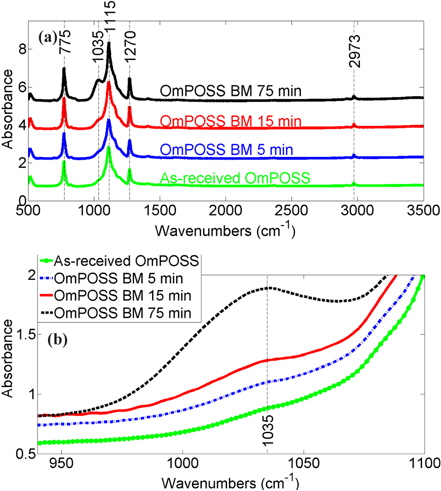
FTIR spectra of as-received OmPOSS powder, OmPOSS powder ball milled for 5 min, 15 min, and 75 min are shown in Fig. 7(a). A magnified view of Fig. 7(a) in the 940~1,100 cm-1 range is shown in Fig. 7(b). The relatively intense, broad and structureless absorption band in the 960~1,240 cm-1 wave number range arises from the skeletal vibration of the silicon-oxygen backbone (Si-OSi) of OmPOSS [48]. The absorption bands at 775 cm-1 and 1,270 cm-1 result from the vibration of the Si-CH3 bond [50]. The weak absorption band at 2,973 cm-1 is due to the asymmetric/symmetric stretch of the C-H bond in the methyl (-CH3) functional group [51].
A careful examination of the FTIR spectra in the 960~1,240 cm-1 range reveals the splitting of the Si-O-Si absorption band into two main bands, at 1,115 cm-1 and at 1,035 cm-1. The band at 1,115 cm-1 results from the vibration of the Si-O-Si
The FTIR spectrum of the as-received OmPOSS has an absorption band at 1,115 cm-1, and a very weak absorption band at 1,035 cm-1. This indicates that the as-received OmPOSS is a mixture of the cage and the network structure, with the network structure only accounting for a small proportion. Furthermore, the magnitude of the absorption band at 1,035 cm-1 increases with the increase of the ball milling time (i.e., 75 min > 15 min> 5 min). This indicates that an increasing proportion of the cage structure transforms to the network structure as ball milling proceeds. This cage-network transformation may result from the cage structure being broken by the high-energy impact in ball milling.
>
B. ThermoGravimetric Analysis (TGA)
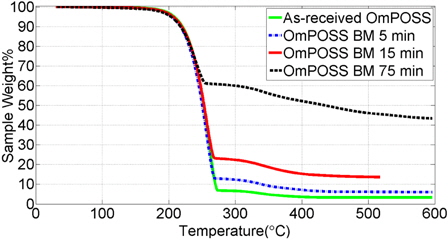
The thermogravimetric behaviors of as-received OmPOSS and OmPOSS ball milled for 5 min, 15 min, and 75 min are shown in Fig. 8. As can be seen, the weight loss takes place in two steps. Depending on how long the OmPOSS is ball milled (0, 5, 15, 75 min respectively), the major weight loss (93%, 87%, 76%, 39%) occurs with the maximum weight loss rate at Tmax= 261, 257, 256, 241℃, the minor weight loss (4%, 7%, 10%, 18%) occurs with the maximum weight loss rate at Tmax= 335, 336, 339, 342℃, and the residual left is 3%, 6%, 14%, 43% of the initial weight. This indicates that the Si-O-Si network structure, when compared to the Si-O-Si cage structure, forms a more stable phase during the heating throughout the first step.
APPENDIX II: Ball milling conditions
As mentioned in the “Experimental” section, ball milling is a complex process, and thus requires the optimization of several variables such as the vial material, the material and the size distribution of the grinding balls, the ball-to-powder weight ratio (BPR), and the milling time [37].
>
A. Material of the vial and grinding balls
Due to the high-energy impact of the grinding balls on the inner wall of the vial, some materials of the vial and the grinding balls inevitably get dislodged and incorporated into the sample, causing contamination. In order to diminish the threat this unavoidable contamination may pose to the insulation properties of the sample, as well as to prevent two types of contaminations (in the case where the material of the vial is different from that of the grinding balls), zirconia, a type of insulation ceramic, is chosen as the material for the vial and the grinding balls. With a density of 5.68 g/cm3, zirconia grinding balls are also considered to be heavy enough to produce a high impact force on the sample.
>
B. Ball-to-powder weight ratio (BPR)
The BPR affects the time required to achieve the desired product— the higher the BPR, the shorter the time required. This is because as the weight proportion of the balls increases, the energy received per unit weight of the sample increases, and consequently, the sample is milled more efficiently. A BPR of 10 is most commonly used in a small capacity mill such as a SPEX mill, and is thus chosen in this work.
>
C. Size and size distribution of the grinding balls
A large ball has a significant weight, and can thus produce a great impact force. It has the potential to break the crystalline POSS, mill them to as small as nano sizes, “knock” POSS molecules off their crystalline structure, deform the crystalline regions of PE, create more amorphous regions of PE, and pound POSS into PE (more possibly the amorphous regions of PE). A small ball has a comparatively high mobility, and is thus able to produce intense frictional forces. It has the potential to reduce the cold welding of crystalline POSS during ball milling, thus making it easier for them to be reduced to smaller sizes, “rub” POSS molecules off their crystalline structure, “rub” on the crystalline region of PE and disturb its organized pattern, therefore making it easier for POSS to settle within.
Consequently, it would be reasonable to expect that the goal of achieving nanoscaled POSS embedded in PE is most likely to be realized when using large and small balls in combination. The number of balls needs to be correctly chosen to ensure a high milling energy as well as to spare enough space for the balls and the sample to move around freely in the vial. Taking into account the volume of the vial, one 15 mm ball, two 10 mm balls and five 5 mm balls were selected for this work.
In a ball milling process, the size of the powder is continuously reduced until a steady state between the fracturing and the cold welding of the powder particles is reached. If ball milling is to continue beyond this milling time, the size of the powder starts to increase due to cold welding. Further, the longer the milling time, the higher the level of contamination.
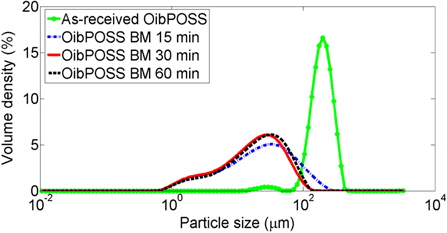
In order to determine an appropriate milling time for Oib- POSS, as-received OibPOSS powder and OibPOSS powder ball milled for 15 min, 30 min, and 60 min, respectively, were tested with a Malvern Mastersizer 3,000 laser diffraction particle size analyzer at room temperature in a methanol environment. To ensure representative and reproducible results, suspension samples were prepared by mixing the powder of interest with a small quantity of methanol in an ultrasonic bath for 1 min.
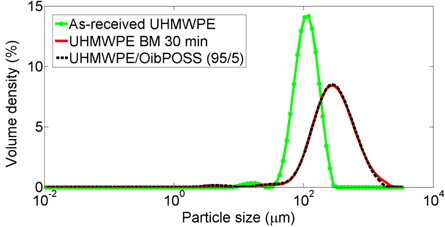
As can be seen in Fig. 9, the average particle size of OibPOSS is reduced from the as-received ~200 μm to ~20 μm after being ball milled for 15 min. The size of large particles continues to decrease as ball milling proceeds to 30 min. However, the particles move towards a larger size range when ball milling continues to 60 min. This indicates that the particle size of OibPOSS reaches a steady state between the fracturing and the cold welding at 30 min of ball milling.
Although OibPOSS powder ends up with a smallest average size of ~20 μm, it may, thanks to its compatibility with PE, still be able to disperse within the PE matrix at the nanoscale when it is ball milled together with PE. In order to check this hypothesis, the particle size of as-received UHMWPE powder, UHMWPE powder ball milled for 30 min, and UHMPWE/OibPOSS (95/5) powder were tested. However, particle size analyses were unable to lead to any conclusive results in this case, as OibPOSS powder got totally wrapped within UHMWPE during the ball milling process (Fig. 10).

![Chemical structure of an OibPOSS molecule (modified from [38]).](http://oak.go.kr/repository/journal/15709/E1TEAO_2015_v16n2_53_f001.jpg)