검색 전체 메뉴
PDF
맨 위로
OA 학술지
Thermal properties in strong hydrogen bonding systems composed of poly(vinyl alcohol), polyethyleneimine, and graphene oxide
  • 비영리 CC BY-NC
  • 비영리 CC BY-NC
ABSTRACT
Thermal properties in strong hydrogen bonding systems composed of poly(vinyl alcohol), polyethyleneimine, and graphene oxide
KEYWORD
poly(vinyl alcohol) , polyethyleneimine , graphene oxide , calorimetric thermal properties , strong hydrogen bonding
  • 1. Introduction

    Poly(vinyl alcohol) (PVA) and its blend with polyethyleneimine (PEI) have attracted great interest due to their potential application in functional membranes as well as for fibers [1-8]. The blends are also a good model system for miscible polymer blends with strong hydrogen bonding. Graphene oxide (GO) is a chemically exfoliated graphite, which is a precursor for graphene (or reduced GO) sheets [9-11]. Graphene has emerged as an ingredient for polymer nanocomposites due to its exceptional electron transport [12-14], mechanical and rheological properties [15-17], and gas barrier properties [15,18,19]. Molecular level dispersion of GO has been reported in the PVA/GO system, which may be ascribed to the hydrogen bonding interaction between the components [18,20].

    Hydrogen bonding in polymer blends has been of interest to polymer scientists for several decades [21-39]. One major characteristic in such systems is the large positive deviation of glass transition temperature (Tg) from conventional mixing rules [22,23,26,35]. It is well known that miscible binary blends exhibit a single Tg between the Tgs of their individual component polymers. Many expressions have been proposed for evaluating the Tgs of miscible binary blends, such as Fox [40], Gordon and Taylor [41], Couchman and Karasz [42], and Kwei [43] equation. Most of these expressions predict a single Tg located in between the Tgs of the component polymers. However, the Tgs of blends of polyvinylphenol (PVPh) and polyvinylpyridine (PVPy) are higher than those of both components due to the strong hydrogen bonding [37]. Two different views on the abnormal increase of Tg have been reported. Painter and coworkers [37] claimed that the abnormal increase of Tg can be ascribed to the positive enthalpy of mixing (endothermic) by strong hydrogen bonding, while the hydrogen bonding itself is exothermic. Pinal [22] have extended the classical thermodynamic approach of Couchman and Karasz [42] to the hydrogen bonding system, and reached the conclusion that the abnormal increase of Tg is due to the negative entropy of mixing. Either case, the negative entropy of mixing or endothermic enthalpy of mixing is certainly abnormal behavior induced by strong hydrogen bonding.

    At equilibrium melting temperature, the chemical potential of the crystalline phase is equal to that of the liquid phase [44,45]. If the crystalline phase sustains the pure state, a new equilibrium condition arises where the chemical potential of the crystalline phase is equal to the reduced-chemical potential of the mixedliquid phase, which leads to the depression of equilibrium melting temperature [45]. Therefore, either the negative entropy of mixing or the positive enthalpy of mixing by strong hydrogen bonding may weaken the depression of melting temperature. Unfortunately, the melting point depressions could not be examined in the amorphous blends of PVPh and PVPy by Painter and coworkers [37]. Subsequently, Painter and coworkers [46] reported the effect of hydrogen bonding on the melting point depression in polymer blends where one component crystallizes. However, the abnormal increase of Tg was not investigated in the latter case.

    Blends of PVA/PEI may be a good alternative model system for investigating both melting behaviors and glass transition temperatures, since PVA is a semi-crystalline polymer. PEI is a multifunctional aliphatic amine with strong cationic characteristics, whereas PVA is a water-soluble poly hydroxyl polymer. Amino groups in the PEI chain could also form strong hydrogen bonds with hydroxyl groups in the PVA chain.

    In this work, we have explored the thermal properties of PVA/PEI/GO blend systems. In particular, we investigated the glass transition temperatures and the equilibrium melting temperatures. We evaluated the configurational entropy of mixing from the glass transition temperatures in the strong hydrogen bonding systems. The effect of strong hydrogen bonding on the degree of depression of equilibrium melting points was also investigated. We also examined the effect of GO on the thermal behaviors of PVA/PEI blends.

    2. Experimental Section

       2.1. Materials

    PVA was purchased from Sigma Aldrich (99 mol% hydrolyzed, Mw = 89 000-98 000 g). PEI, 50 wt% aqueous solution with the low molecular weight of 2000 including amino groups (ratio of primary/secondary/tertiary amino groups was roughly 1/2/1), was purchased from Sigma Aldrich. Flake graphite powder (19 μm nominal particle size) was supplied from Asbury Carbon. GO was synthesized from purified conventional flake graphite by modified Hummers method [9] as reported in our earlier work [17,18].

       2.2. PVA/PEI/GO blend preparation

    PVA solution was prepared by dissolving pure PVA powder with distilled water at 363 K for 1 h and stirring at the same time. Then, the PVA solution was cooled to room temperature and mixed with PEI aqueous solution at a designated mixing ratio by stirring for 1 h. A homogenized solution was prepared in a bubble-free state. A colloidal solution of GO was added to the PVA/PEI solution with a designated mixing ratio and the PVA/PEI/GO solution was milled for 0.5 h at 298 K. Then, the solution was cast on glass plate at 373 K and dried in a convection oven at 373 K for 3 h followed by drying in a vacuum oven at 393 K for 3 h to ensure the removal of moisture.

       2.3. Characterization of PVA/PEI blends

    The morphology of the blends was characterized with field emission scanning electron microscopy (FE-SEM; JEOL JSM-6700F) by observation of the cryogenically fractured surface of samples. High-resolution transmission electron microscopy (HRTEM) was performed with a Hitachi HF-2000 operated at 200 kV. Samples were applied onto a 400 mesh Cu grid with lacey carbon film and dried in air before TEM imaging. X-ray photoelectron spectroscopy (XPS) was performed in a Multilab2000 with a Mg-K X-ray source using a power source of 300 W. The atomic fractions of the different elements in the 10 nm upper layer were probed by XPS and calculated from the survey spectra. X-ray diffraction (XRD) analyses were performed directly on the hybrid samples using a Rigaku (Japan)- Ultima IV (XRD; 40 kV, 40 mA) with Cu irradiation at a scanning rate of 0.02/s in the 2θ range of 2-40. The non-isothermal melting temperatures and glass transition temperatures were measured by differential scanning calorimetry (TA-DSC) from 203 to 523 K during a 2nd run with a heating rate of 20 K/min. To investigate isothermal crystallization and melting, samples were heated to 523 K, held there for 5 min, and cooled rapidly (-80 K/min) to the designated crystallization temperature. When the isothermal crystallization procedure was finished (as monitored by exothermic peaks during isothermal crystallization), the samples were heated again to 523 K with a heating rate of 20 K/min.

    3. Results and Discussion

       3.1. Glass transition temperatures (TgS) of PVA/PEI blends

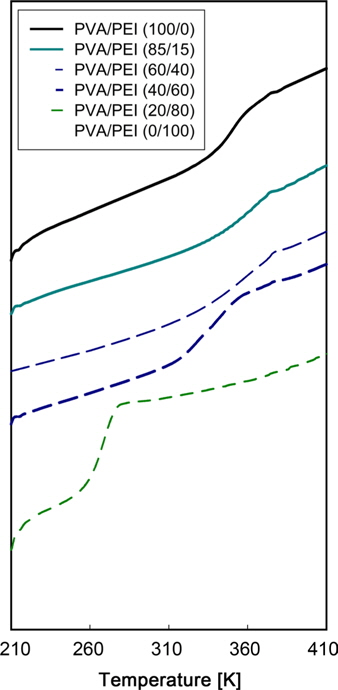
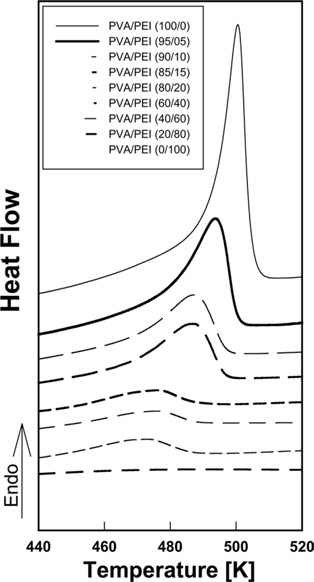
    DSC thermograms for PVA/PEI blends are seen in Fig. 1. The glass transition temperatures (Tgs), onset points (T1s) and end points (T2s) of glass transitions are listed in were obtained by DSC thermograms. The composition dependency of Tgs of the PVA/ PEI binary blend is presented in Fig. 2a. The calculation results by Couchman-Karasz equation are compared to the experimental data in Fig. 2a. The Couchman and Karasz equation [42] is

    image

    where TCK, Tg1, and Tg2 is the glass transition temperature of the mixture, PEI, and PVA, respectively. x1 and x2 are the mole fractions of PEI and PVA, respectively. ΔCpi is the difference in the heat capacity of the liquid and the heat capacity of the glass forms of component i. Molar volumes of the repeating unit of PEI (V1u= 36.11 cm3/mol) and PVA (V2u= 32.28 cm3/mol) were used to estimate mole fractions xi.

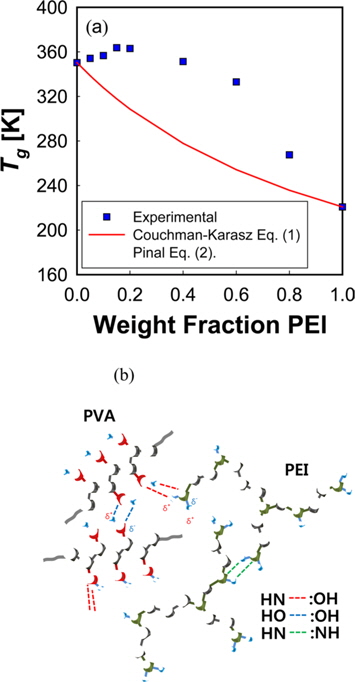
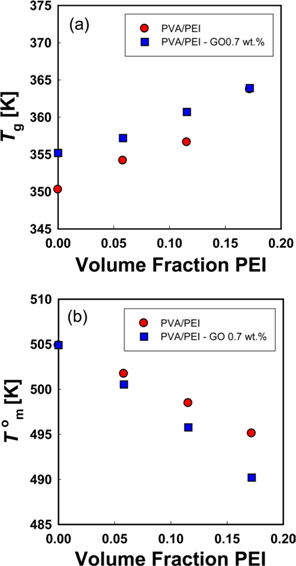
    A large positive deviation from the calculated values can be observed in Fig. 2a. Specifically, the Tgs of the PVA/PEI blends are higher than either of the component Tgs at low concentrations of PEI in Fig. 2a. These abnormal increases of Tgs may be due to the strong hydrogen bonding between PVA and PEI, which is a rarely observed behavior in polymer blend systems.

    According to Gibbs and DiMarzio [47], the glass transition temperature may be defined as the point where the configurational entropy becomes zero when a polymer in melt state is cooled down to a glassy state. OH--N bonding may be formed in PVA/PEI blends, as seen in Fig. 2b, which may be stronger than OH--O bonding in PVA itself or than NH--N bonding in PEI. So, the strengthened hydrogen bonding produced by mixing may induce a decrease of the configurational entropy in the blend at melt state. This may lead to the abnormal increase of Tgs. Pinal [22] has extended the classical thermodynamic approach of Couchman-Karasz to a hydrogen bonding system and has obtained following expression.

    image

    where Tgm is the glass transition temperature of the mixture obtained experimentally, TCK is defined in Eq. 1, and is the configurational part of the entropy of mixing. We determined by applying Eq. (2) to the experimental data in Fig. 2a. The estimated has a negative sign as seen in Fig. 3a. The abnormal increases of in Fig. 2a are ascribed to the negative configurational entropy of mixing, which may be caused by the formation of strong hydrogen bonding between PVA and PEI.

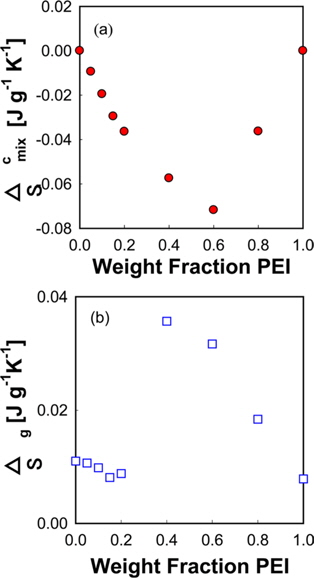
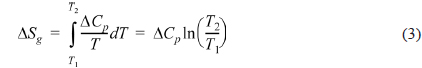
    The entropy change of the PVA/PEI blends in the glass transition region can be obtained by Fig. 3b according to the definition of entropy by Clausius [44].

    image

    ΔSg was evaluated from the experimental data in Table 1 and Fig. 2a. The ΔSg shows an S-shaped curve, as seen in Fig. 3b. The ΔSg is initially decreased by adding PEI into PVA, up to a 0.2 weight fraction. ΔSg reaches maximum value around the mid-composition range, then is decreased by the further increase of PEI weight fraction, in Fig. 4. The abnormal increase of Tgs in Fig. 2a may also be consistent with the decrease of ΔSg at low concentration range in Fig. 3b, where the weight fraction of PEI is less than 0.2.

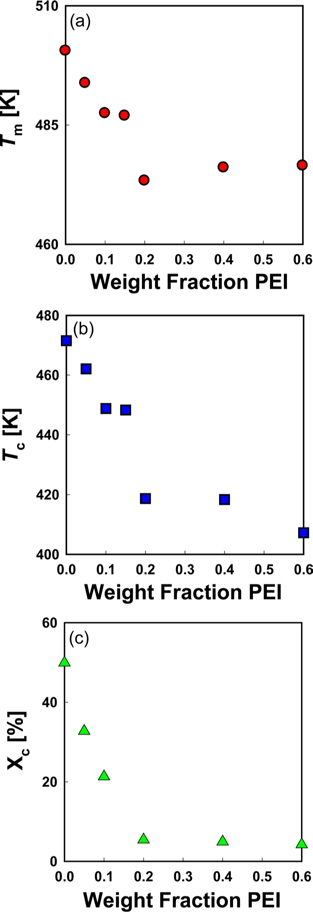
       3.2. Melting behaviors of PVA/PEI blends

    DSC thermograms for melting peaks of PVA in PVA/PEI blends are presented in Fig. 4. The non-isothermal melting temperatures (Tms) were measured from the 2nd heating with a heating rate of 20 K/min. The crystalline temperatures (Tcs) were measured with the cooling rate of 20 K/min. Crystallinity (Xc) of the blends was evaluated with the equation below.

    image

    where Xc is the crystallinity, ΔHf is the heat of fusion of the blends and is the heat of fusion of 100% crystalline polymer, PVA (138.6 J/g) [31]. In Fig. 5a-c, the Tms, Tcs, and Xcs are remarkably decreased by the addition of PEI up to 0.2 weight fraction, and are changed slightly by the further addition of PEI into PVA. When the weight fraction of PEI was higher than 0.8, melting peaks were not observed by DSC in the PVA/PEI blends. The composition range associated with the large decreases of Tms, Tcs, and Xcs in Fig. 5 is consistent with the composition range associated with the abnormal increases of Tgs in Fig. 2a.

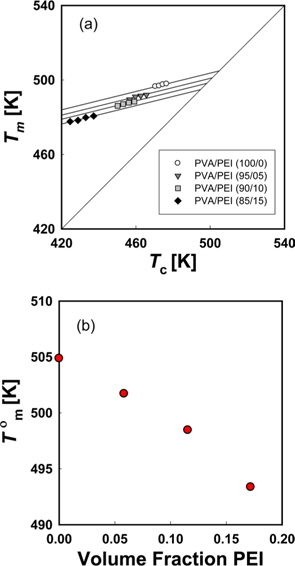
    Fig. 6a is a Hoffman-Week’s plot [48] for the estimation of equilibrium melting temperature (Tm) of PVA in blends of PVA and PEI. The composition dependency of Tm is plotted in Fig. 6b. At equilibrium melting temperature, the chemical potential of crystalline PVA (μc) is equal to those of PVA melt (μl). The μl may be reduced to μl by adding PEI into PVA, since PVA may be mixed with PEI spontaneously. Then, one can obtain the following equilibrium condition [45].

    image

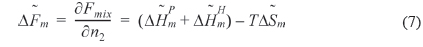
    The left hand side of Eq. (5) is the molar free energy of fusion and the right hand side is the partial molar free energy of mixing with respect to the crystalline component (). In the case of a hydrogen-bonding system, the free energy of mixing can be divided into two terms, as in Eq. (6) [37].

    image

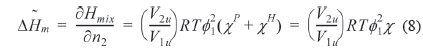
    where and is the partial molar free energy of mixing contributed by the hydrogen bonding force and by all other forces, respectively. Usually, is given by the Flory-Huggins equation. Eq. (6) can be re-written as Eq. (7).

    image

    where n2 is the number of moles of the repeating unit of PVA. According to Nish and Wang [49], the enthalpy of mixing can be given by Eqs. (8) and (9) by neglecting the effect of ϕ2 in the Flory-Huggins equation.

    image
    image

    where B is the interaction energy density characteristic of the polymer pair. The following expression can be obtained by inserting Eq. (8) into Eq. (7).

    image

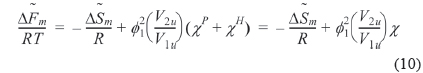
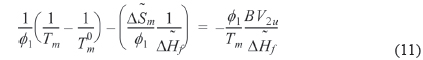
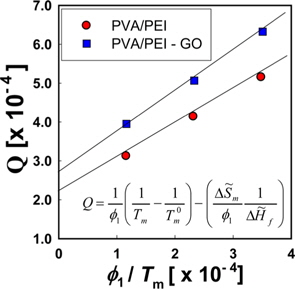
    By setting equal to the molar free energy of fusion and inserting Eq. (9) into Eq. (10), the following expressions can be obtained

    image

    where is athermal in the liquid state. We refer to the left hand side of Eq. (11) as Q as follows.

    image

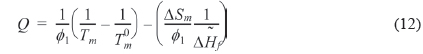
    We can refer the first term in Eq. (12) to be the degree of the depression of melting point (Dm).

    image

    The Dm is expected to be reduced in the case where the entropy of mixing has a negative sign. We obtained the empirical equation for /nT in Fig. 3a with the unit (cal/mol K) as follows.

    image

    where nT is the total number of moles; nT = n1+n2, n1 and n2 is the number of moles of PEI and PVA, respectively. A is determined to be 2.3 for PVA/PEI blends. A similar value of A is determined for PVA/PEI/GO systems. Then, the molar entropy of mixing is obtained as the following.

    image

    Since the entropy of mixing of the blends of PEI and PVA has a negative sign, it can be supposed that the Dm would be reduced by the strong hydrogen bonding. However, large depressions of melting points are observed for the blends of PEI and PVA as seen in Fig. 6b. This result points to the fact that the effect of negative entropy may be compensated by the strong enthalpic interaction, as seen in Fig.7. In Fig. 7, the melting temperatures in Fig. 6b and the entropy of mixing in Fig. 3a are re-plotted using Q and ϕ1/Tm as variables. From the slope in Fig. 7, B is determined to be -37cal (cm3 of PEI) and χ is -1.34 at 500 K. Eq. (11) reduces to the Nish-Wang equation [49], if the entropy of mixing is neglected. The χ by Nish-Wang’s plot is -0.10 at 500 K. So, the magnitude of negative χ becomes much larger when we consider the entropy term in Eq. (11). Here, it is concluded that the Dm in the strong hydrogen bonding system is not reduced by the negative ΔSm, because the magnitude of negative χ is also increased by the strong hydrogen bonding.

       3.3. Effect of GO on the thermal behaviors of PVA/PEI blends

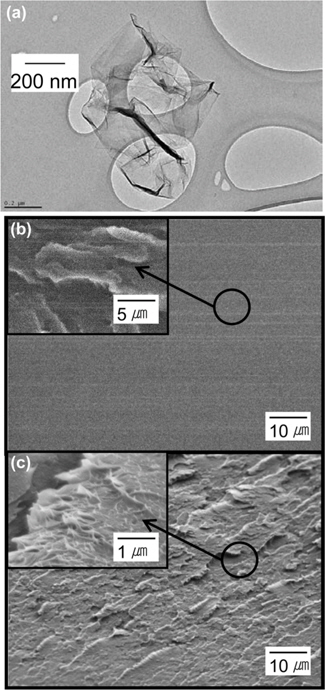
    GO was prepared from purified conventional flake graphite (19 μm nominal particle size, Asbury Carbon) by the modified Hummers method [9,17,18]. The TEM image of the reduced GO sheets suspended on a carbon grid are presented in Fig. 7a, showing the typical image of graphene with electron transparency. We investigated the degree of oxidation of the GO by XPS. The carbon to oxygen atomic ratio of GO was determined to be 1.8 from the XPS spectra. We dispersed 0.7 wt% GO into the blends of PVA and PEI. The SEM images of the surface of the blend films are presented in Fig. 7b and c. The PVA/PEI blends are thermodynamically miscible to form a single phase, therefore, no appreciable domain is observed in Fig. 7b. A rough layer-like morphology is observed on the surface of the PVA/ PEI/GO blends in Fig. 7c. The XRD patterns of the PVA/PEI/ GO blends show no GO characteristic peak at 2θ = 9.5°, indicating GO is fully exfoliated in the blends [18].

    The Tgs and of PVA/PEI/GO blends are compared to those of PVA/PEI blends in Fig. 8a and b. The Tg of PVA is increased about 5 K by adding GO into PVA. In our previous report [18], the Tg of PVA was not changed by adding GO into PVA. We used 86-89 mol% hydrolyzed PVA in the previous work [18] and 99 mol% hydrolyzed PVA in this work. Therefore, the hydrogen bonding interaction between PVA and GO may be stronger in this work compared to those in our previous work. This may be evidenced by the increase of the Tgs of PVA/PEI blends after adding 0.7 wt% GO in Fig. 8a. The depressions of are more pronounced after adding GO into PVA/PEI blends, as shown in Fig. 9. The results in Figs. 8a and 9 indicate that the hydrogen bonding in PVA/PEI/GO blend systems are pronounced compared to those in the PVA/PEI blend system. We plotted Q versus ϕ1/Tm for the PVA/PEI/GO blends in Fig. 9. It is reasonable that the mixtures of PEI and GO are treated as diluents for the crystallization of PVA in the PVA/PEI/GO blend systems. So, the χ in the PVA/PEI/GO blend systems stands for the enthalpic interaction between PVA and the PEI/GO mixture. The χ in the PVA/PEI/GO ternary blend system was determined to be -1.53, which is larger than in the PVA/PEI binary blends. The increase of the magnitude of negative χ by GO may be ascribed to the increase of hydrogen bonding interaction (χH).

    4. Conclusions

    The Tgs of PVA/PEI blends were higher than the Tgs of either of the component polymers at low concentrations of PEI. These abnormal increases of Tgs may be due to the negative entropy of mixing, which is associated with the strong hydrogen bonding between PVA and PEI. The degree of depression of was not reduced by the negative entropy of mixing, since strong hydrogen bonding also causes an increase in the magnitude of negative χ between PVA and PEI. The Tg of PVA was inceased significantly by adding 0.7 wt% GO into PVA. The magnitude of negative χ was increased by adding GO into the blends of PVA and PEI.

참고문헌
  • 1. Gao Q, Takizawa J, Kimura M 2013 Hydrophilic non-wovens made of cross-linked fully-hydrolyzed poly(vinyl alcohol) electrospun nanofibers [Polymer] Vol.54 P.120 google cross ref
  • 2. Bessbousse H, Verchere JF, Lebrun L 2012 Characterisation of metalcomplexing membranes prepared by the semi-interpenetrating polymer networks technique. Application to the removal of heavy metal ions from aqueous solutions [Chem Eng J] Vol.187 P.16 google cross ref
  • 3. Bunch JS, Verbridge SS, Alden JS, van der Zande AM, Parpia JM, Craighead HG, McEuen PL 2008 Impermeable atomic membranes from graphene sheets [Nano Lett] Vol.8 P.2458 google cross ref
  • 4. Ben Hamouda S, Nguyen QT, Langevin D, Roudesli S 2010 Poly(vinylalcohol)/poly(ethyleneglycol)/poly(ethyleneimine)blend membranes: structure and CO2 facilitated transport [Comptes Rendus Chimie] Vol.13 P.372 google cross ref
  • 5. Ben Hamouda S, Roudesli S 2008 Transport properties of PVA/PEI/PEG composite membranes: sorption and permeation characterizations [Cent Eur J Chem] Vol.6 P.634 google cross ref
  • 6. Rao PS, Sridhar S, Wey MY, Krishnaiah A 2007 Pervaporation performance and Transport phenomenon of PVA blend membranes for the separation of THF/water azeotropic mixtures [Polym Bull] Vol.59 P.289 google cross ref
  • 7. Dong C, Yuan X, He M, Yao K 2006 Preparation of PVA/PEI ultra-fine fibers and their composite membrane with PLA by electrospinning [J Biomater Sci, Polymer Ed] Vol.17 P.631 google cross ref
  • 8. Matsuyama H, Terada A, Nakagawara T, Kitamura Y, Teramoto M 1999 Facilitated transport of CO2 through polyethylenimine/poly(vinylalcohol) blend membrane [J Membr Sci] Vol.163 P.221 google cross ref
  • 9. Kovtyukhova NI, Ollivier PJ, Martin BR, Mallouk TE, Chizhik SA, Buzaneva EV, Gorchinskiy AD 1999 Layer-by-layer assembly of ultrathin composite films from micron-sized graphite oxidesheets and polycations [Chem Mater] Vol.11 P.771 google cross ref
  • 10. Dikin DA, Stankovich S, Zimney EJ, Piner RD, Dommett GHB, Evmenenko G, Nguyen ST, Ruoff RS 2007 Preparation and characterization of graphene oxide paper [Nature] Vol.448 P.457 google cross ref
  • 11. Geim AK, Novoselov KS 2007 The rise of graphene [Nat Mater] Vol.6 P.183 google cross ref
  • 12. Novoselov KS, Geim AK, Morozov SV, Jiang D, Zhang Y, Dubonos SV, Grigorieva IV, Firsov AA 2004 Electric field effect in atomically thin carbon films [Science] Vol.306 P.666 google cross ref
  • 13. Shin D, Bae S, Yan C, Kang J, Ryu J, Ahn JH, Hong BH 2012 Synthesis and applications of graphene electrodes [Carbon Lett] Vol.13 P.1 google cross ref
  • 14. Kim KS, Zhao Y, Jang H, Lee SY, Kim JM, Kim KS, Ahn JH, Kim P, Choi JY, Hong BH 2009 Large-scale pattern growth of graphene films for stretchable transparent electrodes [Nature] Vol.457 P.706 google cross ref
  • 15. Kim H, Abdala AA, Macosko CW 2010 Graphene/polymer nanocomposites [Macromolecules] Vol.43 P.6515 google cross ref
  • 16. Stankovich S, Dikin DA, Dommett GHB, Kohlhaas KM, Zimney EJ, Stach EA, Piner RD, Nguyen ST, Ruoff RS 2006 Graphenebased composite materials [Nature] Vol.442 P.282 google cross ref
  • 17. Jun SI, Lee HS 2012 Negative normal stress differences in graphene/polycarbonate composites [Appl Phys Lett] Vol.100 P.164108 google cross ref
  • 18. Kim HM, Lee JK, Lee HS 2011 Transparent and high gas barrier films based on poly(vinyl alcohol)/graphene oxide composites [Thin Solid Films] Vol.519 P.7766 google cross ref
  • 19. Nair RR, Wu HA, Jayaram PN, Grigorieva IV, Geim AK 2012 Unimpeded permeation of water through helium-leak: tight graphene-based membranes [Science] Vol.335 P.442 google cross ref
  • 20. Liang J, Huang Y, Zhang L, Wang Y, Ma Y, Guo T, Chen Y 2009 Molecular-level dispersion of graphene into poly(vinyl alcohol) and effective reinforcement of their nanocomposites [Adv Funct Mater] Vol.19 P.2297 google cross ref
  • 21. Choperena A, Painter P 2009 Hydrogen bonding in polymers: effect of temperature on the OH stretching bands of poly(vinylphenol) [Macromolecules] Vol.42 P.6159 google cross ref
  • 22. Pinal R 2008 Entropy of mixing and the glass transition of amorphous mixtures [Entropy] Vol.10 P.207 google cross ref
  • 23. Kuo SW 2008 Hydrogen-bonding in polymer blends [J Polym Res] Vol.15 P.459 google cross ref
  • 24. Zheng W, Simon SL 2007 Confinement effects on the glass transition of hydrogen bonded liquids [J Chem Phys] Vol.127 P.194501 google cross ref
  • 25. Yi JZ, Goh SH 2005 Miscibility and interactions in poly(n-propyl methacrylate)/poly(vinyl alcohol) blends [Polymer] Vol.46 P.9170 google cross ref
  • 26. He Y, Zhu B, Inoue Y 2004 Hydrogen bonds in polymer blends [Prog Polym Sci] Vol.29 P.1021 google cross ref
  • 27. Feldstein MM, Roos A, Chevallier C, Creton C, Dormidontova EE 2003 Relation of glass transition temperature to the hydrogen bonding degree and energy in poly(N-vinyl pyrrolidone) blends with hydroxyl-containing plasticizers: 3. Analysis of two glass transition temperatures featured for PVP solutions in liquid poly(ethyleneglycol) [Polymer] Vol.44 P.1819 google cross ref
  • 28. Kuo SW, Xu H, Huang CF, Chang FC 2002 Significant glass-transition-temperature increase through hydrogen-bonded copolymers [J Polym Sci B] Vol.40 P.2313 google cross ref
  • 29. Lagaron JM, Gimenez E, Saura JJ, Gavara R 2001 Phase morphology, crystallinity and mechanical properties of binary blends of high barrier ethylene: vinyl alcohol copolymer and amorphous polyamide and a polyamide-containing ionomer [Polymer] Vol.42 P.7381 google cross ref
  • 30. Park JS, Park JW, Ruckenstein E 2001 A dynamic mechanical and thermal analysis of unplasticized and plasticized poly(vinyl alcohol)/methylcellulose blends [J Appl Polym Sci] Vol.80 P.1825 google cross ref
  • 31. Hassan CM, Peppas NA 2000 Structure and morphology of freeze/thawed PVA hydrogels [Macromolecules] Vol.33 P.2472 google cross ref
  • 32. Laurence C, Berthelot M 2000 Observations on the strength of hydrogen bonding [Perspect Drug Discovery Des] Vol.18 P.39 google cross ref
  • 33. Parada LG, Cesteros LC, Meaurio E, Katime I 1998 Miscibility in blends of poly(vinyl acetate-co-vinyl alcohol) with poly(N,Ndimethylacrylamide) [Polymer] Vol.39 P.1019 google cross ref
  • 34. Schneider HA 1997 Conformational entropy contributions to the glass temperatureof blends of miscible polymers [J Res Natl Inst Stand Technol] Vol.102 P.229 google
  • 35. Coleman MM, Painter PC 1995 Hydrogen bonded polymer blends [Prog Polym Sci] Vol.20 P.1 google cross ref
  • 36. Prinos J, Panayiotou C 1995 Glass transition temperature in hydrogenbonded polymer mixtures [Polymer] Vol.36 P.1223 google cross ref
  • 37. Painter PC, Graf JF, Coleman MM 1991 Effect of hydrogen bonding on the enthalpy of mixing and the composition dependence of the glass transition temperature in polymer blends [Macromolecules] Vol.24 P.5630 google cross ref
  • 38. Feng H, Feng Z, Shen L 1993 A high resolution solid-state n.m.r. and d.s.c. study of miscibility and crystallization behaviour of poly(vinylalcohol)poly(N-vinyl-2-pyrrolidone) blends [Polymer] Vol.34 P.2516 google cross ref
  • 39. Zhang X, Takegoshi K, Hikichi K 1992 High-resolution solid-state 13C nuclear magnetic resonance study on poly(vinyl alcohol)/poly(vinylpyrrolidone) blends [Polymer] Vol.33 P.712 google cross ref
  • 40. Fox TG 1956 Influence of diluent and of copolymer composition on the glass temperature of a polymer system [Bull Am Phys Soc] Vol.1 P.123 google
  • 41. Gordon M, Taylor JS 1952 Ideal copolymers and the second-order transitions of synthetic rubbers. I. Non-crystalline copolymers [J ApplChem] Vol.2 P.493 google cross ref
  • 42. Couchman PR, Karasz FE 1978 A Classical thermodynamic discussion of the effect of composition on glass-transition temperatures [Macromolecules] Vol.11 P.117 google cross ref
  • 43. Kwei TK 1984 The effect of hydrogen bonding on the glass transition temperatures of polymer mixtures [J Polym Sci: Polym Lett Ed] Vol.22 P.307 google cross ref
  • 44. Atkins PW 1986 Physical Chemistry google
  • 45. Flory PJ 1975 Principles of Polymer Chemistry google
  • 46. Painter PC, Shenoy SL, Bhagwagar DE, Fishburn J, Coleman MM 1991 Effect of hydrogen bonding on the melting point depressionin polymer blends where one component crystallizes [Macromolecules] Vol.24 P.5623 google cross ref
  • 47. Gibbs JH, DiMarzio EA 1958 Nature of the glass transition and the glassy state [J Chem Phys] Vol.28 P.373 google cross ref
  • 48. Hoffman JD, Weeks JJ 1962 Melting process and the equilibrium melting temperature of polychlorotrifluoroethylene [J Res Natl Bur Stand A: Phys Chem] Vol.66A P.13 google cross ref
  • 49. Nishi T, Wang TT 1975 Melting point depression and kinetic effects of cooling on crystallization in poly(vinylidene fluoride)-poly(methylmethacrylate) mixtures [Macromolecules] Vol.8 P.909 google cross ref
이미지 / 테이블
  • [ Fig. 1. ]  Differential scanning calorimetry thermograms for the glass transition temperatures of the blends of poly(vinyl alcohol) (PVA) and polyethyleneimine (PEI).
    Differential scanning calorimetry thermograms for the glass transition temperatures of the blends of poly(vinyl alcohol) (PVA) and polyethyleneimine (PEI).
  • [ ] 
  • [ Fig. 2. ]  Composition dependency of the glass transition glass transition temperatures of the blends of poly(vinyl alcohol) (PVA) and polyethyleneimine (PEI); (a) the TgS with respect to the weight fraction of PEI, (b) schematic illustration for the hydrogen bondings in the blends of PVA and PEI.
    Composition dependency of the glass transition glass transition temperatures of the blends of poly(vinyl alcohol) (PVA) and polyethyleneimine (PEI); (a) the TgS with respect to the weight fraction of PEI, (b) schematic illustration for the hydrogen bondings in the blends of PVA and PEI.
  • [ ] 
  • [ Fig. 3. ]  Entropy of mixing of the blends of poly(vinyl alcohol) and polyethyleneimine (PEI); (a) configurational entropy of mixing, (b) entropy in the glass transition region.
    Entropy of mixing of the blends of poly(vinyl alcohol) and polyethyleneimine (PEI); (a) configurational entropy of mixing, (b) entropy in the glass transition region.
  • [ ] 
  • [ Fig. 4. ]  Differential scanning calorimetry thermograms for the melting temperatures of poly(vinyl alcohol) (PVA) in the blends of PVA and polyethyleneimine (PEI).
    Differential scanning calorimetry thermograms for the melting temperatures of poly(vinyl alcohol) (PVA) in the blends of PVA and polyethyleneimine (PEI).
  • [ ] 
  • [ Fig. 5. ]  Non-isothermal properties of poly(vinyl alcohol) (PVA) in the blends of PVA and polyethyleneimine (PEI) with the heating or cooling rate of 20 K/min in differential scanning calorimetry; (a) melting temperatures, (b) crystallization temperatures, (c) crystallinities.
    Non-isothermal properties of poly(vinyl alcohol) (PVA) in the blends of PVA and polyethyleneimine (PEI) with the heating or cooling rate of 20 K/min in differential scanning calorimetry; (a) melting temperatures, (b) crystallization temperatures, (c) crystallinities.
  • [ Fig. 6. ]  Equilibrium melting temperatures of poly(vinyl alcohol) (PVA) in the blends of PVA and polyethyleneimine (PEI); (a) Hoffman-Weeks plot, (b) composition dependency of equilibrium melting temperatures of PVA.
    Equilibrium melting temperatures of poly(vinyl alcohol) (PVA) in the blends of PVA and polyethyleneimine (PEI); (a) Hoffman-Weeks plot, (b) composition dependency of equilibrium melting temperatures of PVA.
  • [ ] 
  • [ ] 
  • [ ] 
  • [ ] 
  • [ ] 
  • [ ] 
  • [ ] 
  • [ ] 
  • [ ] 
  • [ ] 
  • [ ] 
  • [ Fig. 7. ]  Morphology of graphene oxide (GO) and the poly(vinyl alcohol) (PVA)/polyethyleneimine (PEI)/GO blends; (a) transmission electron microscopy image of graphene oxide, (b) scanning electron microscopy (SEM) image of the surface of the PVA/PEI (90/10) blends, (c) SEM image of the surface of the PVA/PEI (90/10) blends with 0.7 wt% GO.
    Morphology of graphene oxide (GO) and the poly(vinyl alcohol) (PVA)/polyethyleneimine (PEI)/GO blends; (a) transmission electron microscopy image of graphene oxide, (b) scanning electron microscopy (SEM) image of the surface of the PVA/PEI (90/10) blends, (c) SEM image of the surface of the PVA/PEI (90/10) blends with 0.7 wt% GO.
  • [ Fig. 8. ]  Effects of graphene oxide on the glass transition temperature and the equilibrium melting temperature of the blends of poly(vinyl alcohol) (PVA) and polyethyleneimine (PEI).
    Effects of graphene oxide on the glass transition temperature and the equilibrium melting temperature of the blends of poly(vinyl alcohol) (PVA) and polyethyleneimine (PEI).
  • [ Fig. 9. ]  A plot of quantity Q versus ? 1/Tm according to Eq. (11). PVA: poly(vinyl alcohol), PEI: polyethyleneimine.
    A plot of quantity Q versus ? 1/Tm according to Eq. (11). PVA: poly(vinyl alcohol), PEI: polyethyleneimine.
(우)06579 서울시 서초구 반포대로 201(반포동)
Tel. 02-537-6389 | Fax. 02-590-0571 | 문의 : oak2014@korea.kr
Copyright(c) National Library of Korea. All rights reserved.