Holography is a technique for recording phase modulation using interference patterns formed when light is reflected or transmitted by an object onto a photoplate. The recording requires object and reference beams, the combination of which generates the interference pattern. In the past, holographic interference patterns were recorded on film plates; presently, however, charge-coupled devices (CCDs) or complementary metal oxide semiconductor (CMOS) cameras are commonly used, and a computer reconstructs the hologram. Yaroslavskii
There are two types of digital holographic microscopes (DHMs): reflection and transmission. Typical optical components have two surfaces, front and back. However, transmission interferometers or DHMs cannot measure both three-dimensional (3D) surface profiles simultaneously, because the output from the optical components includes integrated surface information. In reflection interferometry, the phase information of each surface is measured separately and then numerically reconstructed to provide 3D information about the sample. Thus reflection interferometry is used to measure both 3D surface profiles. However, these approaches rely on movable mechanisms and accurate position determination to obtain all of the phase information. Low-coherence interferometry (LCI) could measure the surfaces by controlling the reference optical length as in optical coherence tomography, but LCI requires many images to obtain all of the phase information [11, 12].
In this paper we propose a method for simultaneously measuring the front and back surface profiles of transparent micro-optical components, using a dual-wavelength DHM [13-17] and liquids. We also propose a theoretical model for determining the surface information, and experimentally demonstrate the use of this model for an achromatic lens.
2.1. Hologram Recording and Reconstruction
In the hologram recording process, a plane reference wave

where
where
If a screen is placed at a distance
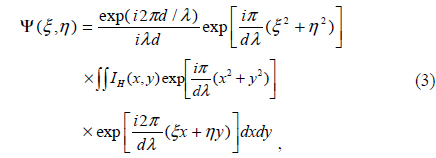
where

The quantitative phase image is obtained by calculating the argument [18-21]
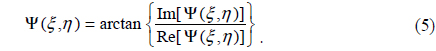
The real 3D information is acquired by phase-unwrapping the quantitative phase image.
2.2. Optical Path Difference in A Dual-Wavelength Digital Holographic Microscope with Liquids
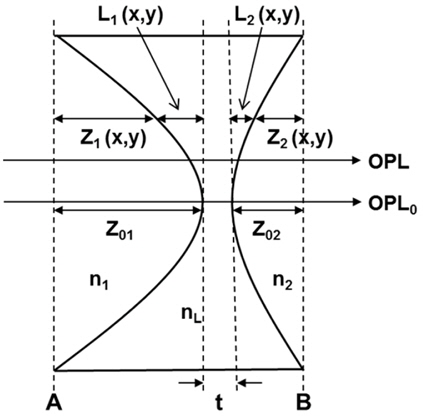
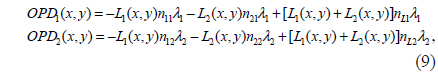
Consider the optical-path difference of a beam traveling through a transparent sample of refractive index
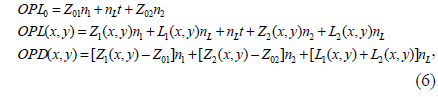
where
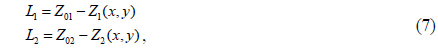
Substituting Eq. (7) into Eq. (6) gives

Equation (8) includes the integrated surface information [


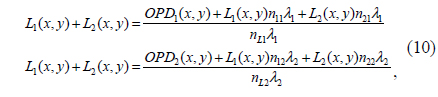
The result above is obtained from the expression for the optical-path difference with two wavelengths and two different liquids. Equation (10) presents the decoupled surface profile information, and shows that both surface profiles of a transmission optical component can be measured simultaneously using a dual-wavelength DHM and two different liquids.
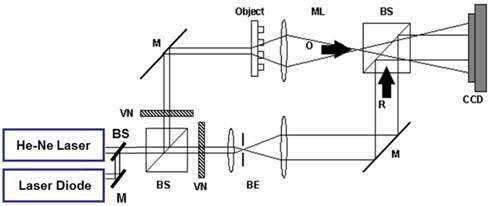
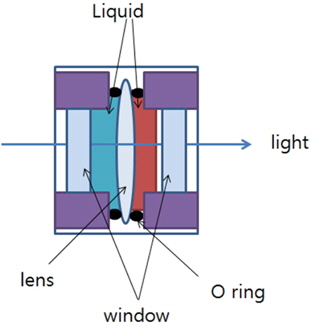
Figure 2 shows a schematic diagram of the experimental setup for a dual-wavelength transmission holographic microscope with liquids, for measuring both surfaces simultaneously. The basic experimental setup is similar to that of a Mach- Zehnder type interferometer. A 10-mW He-Ne laser (633 nm) and laser diode (532 nm) were used as the light sources. Water and a refractive index liquid (Cargille Laboratories) were used. The refractive index of the liquid was 1.6171 and 1.6317 at 633 and 532 nm, respectively, while that of water was 1.33168 and 1.33372 at 633 and 532 nm, respectively. Different liquids are filled as in Fig. 3.
We used a CCD camera (Imperx) to record the holograms. The pixel size and the number of pixels were 7.4 × 7.4 μm and 1024 × 1024, respectively. Achromatic lenses (Edmund Optics) were used as the samples, each with a different radius of curvature (ROC) 26.82 and 61.38 mm; and refractive indices of 1.51508 and 1.51947 at 633 and 532 nm, respectively.
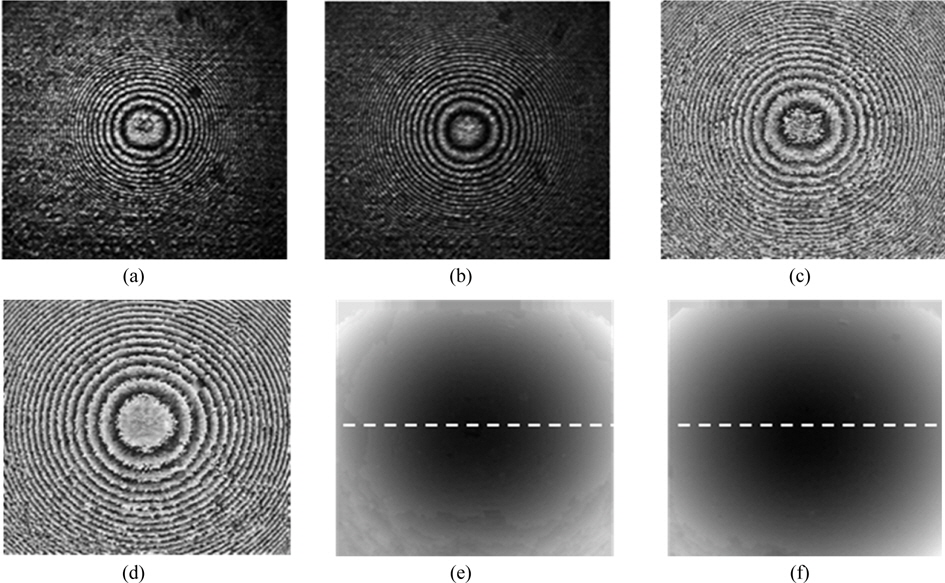
Figure 4 shows the experimental results for the achromatic lens from dual-wavelength DHM with liquids. Figures 4(a) and (b) show the holograms at 532 and 633 nm respectively. Figures 4(c) and (d) show respectively the reconstructed quantitative phase image of each hologram with 3D gray-level surface profiles of the samples shown in Figs. 4(e) and (f) for 532 and 633 nm. To acquire the 3D gray-level images, we used Flynn’s unwrapping method [23].
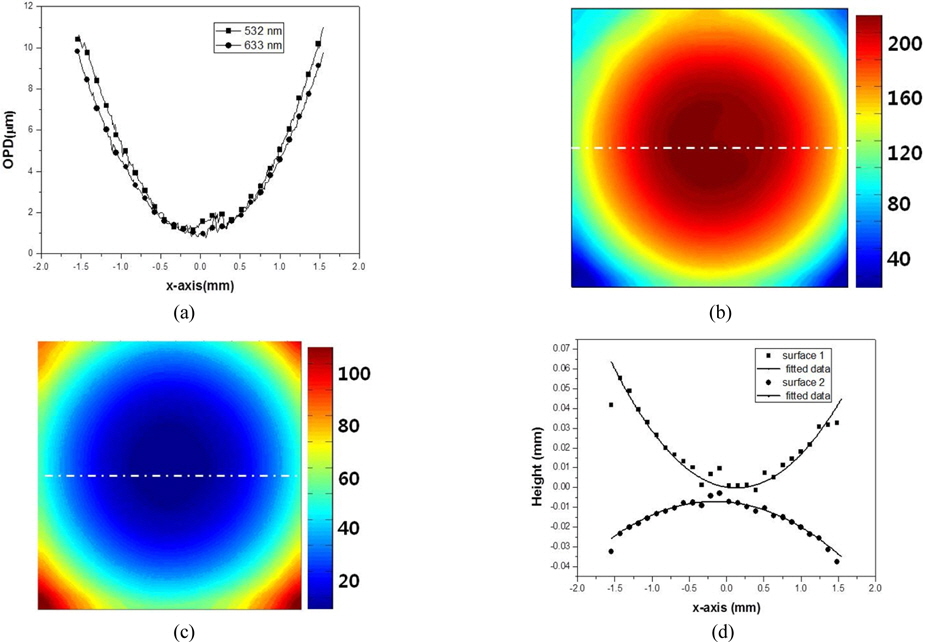
Figure 5(a) illustrates the gray levels measured along the dashed lines in Fig. 4(e) and Fig. 4(f). The squares and circles correspond to the results for wavelengths of 532 and 633 nm, respectively. The difference between the profiles for each wavelength was very small, as predicted by Eq. (9). The OPD includes information about the lens shape and refractive index; however, the OPD in Fig. 5(a) is not the actual height. The OPD difference between 532 and 633 nm is caused by the difference in the refractive indices. We calculated the front and back profiles using Eq. (10) and data from Figs. 4(e) and (f). The calculated results for the 3D color image from each surface are shown in Figs. 5(b) and (c). Note that the optical-path difference between the wavelengths, as well as noise, affected the calculated image. In Fig. 5(d) we show the spatial profiles indicated by the dashed lines in Figs. 5(b) and (c); the squares and circles correspond to the raw data, while the lines represent the fitted data. The fitted data show that the profile of each surface is different, and the surface information is decoupled. Next, we calculated the ROC from the calculated profiles. The ROC can be found from the completely reconstructed surface by fitting to a best-fit sphere using singular-value decomposition (SVD). Any spherical surface along the z-axis can be expressed as

where
Digital holographic microscopy can be used to measure optical-path differences with a high degree of accuracy. The optical-path difference depends on the refractive index and morphology of the samples. Normally optical components have a two-sided morphology, with front and back surfaces. We cannot determine the individual surface profiles with normal transmission DHM, because the output wave from the object presents integrated information. This study proposed a new experimental method and models for determining the individual surface profiles simultaneously using transmission DHM and liquids. We integrated dual-wavelength DHM with liquids and demonstrated a new method for determining the individual surface profiles of an achromatic lens, which has different ROC surfaces. The proposed method involves recording holograms at different wavelengths and then numerically reconstructing the phase information of the front and back 3D information of the sample. The proposed method can be applied to normal transmission interferometry for determining the 3D surface profiles of transmitted optical components.