Even in research, productivity as input to output is important. Research productivity indicates the capability of individuals and also the capability of institutions. In addition, research productivity is an essential issue for all R&D funding agencies, since they need efficiency in R&D investment. Song (2003) pointed out the fact that research productivity will eventually guarantee the sustainability of science and engineering colleges.
The study on the research productivity of scientists and its impact factors has been traced since the 1950s. Merton (1957) analyzed the issues related to social stratification in science, and Roe (1956) analyzed the psychology of outstanding scholars. Since then, multitudes of studies on research productivity and determinants have appeared.
As for objectives of research productivity, a specific college, department, group and institution have been analyzed. In addition, many specific research grant programs have been analyzed. As an example, there are several studies on the BK21 (Brain Korea 21) project supported by the National Research Foundation of Korea (NRF). Many studies such as Kim (2006), Shin (2009), and Kim and Byun (2012) examined the effects on participating universities and departments. However, studies on the BK21 Plus (Brain Korea 21 Plus) followed by the second stage of BK21 and the WCU project (World Class University) have yet to appear.
The purpose of this study is to analyze the research productivity of scientists who participate in the BK21 Plus Program. Unlike other studies that focus on mainly research papers, this paper analyzes papers, patents and a combination of both.
The structure of this paper is as follows: Second chapter reviews previous studies and establishes the hypotheses based on this review. Section 3 explains the data and method and basic statistics. Section 4 introduces the results of analyses. Section 5 summarizes the total hypotheses and the implication for theory and limitations.
Ⅱ. Theoretical Predictions and Hypotheses
Merton (1957) suggested that a main reason for scientific research is getting recognition from colleagues. Stephan and Levin (1992) pointed out that attractiveness of research, recognition by colleagues, and financial compensation are important motivations for research.
As for indicators of research productivity, Owen-Smith and Powell (2001) insisted that patent as well as paper are important as productivity indicators. Stephan et al. (2005) said academic disciplines are an important factor in determining the number of patents.
The studies on the relationship between papers and patents are also active. Stephan et al. (2005) showed that papers and patents have the positive correlation of 0.341 in the analysis of 10,962 USA PhDs. Carayol (2004) also proved the positive correlation between papers and patents of professors in Louis Pasteur University in France. Wong (2010) found that the quantity and quality of papers are correlated with patents in a world survey of 281 colleges during 2003 to 2005. Markiewicz and DeMinin (2004) asserted that patents of a university increase papers significantly.
However, Agrawal and Henderson (2002) insisted that papers and patents are neither complementary nor exclusive in a relationship analysis of 236 researchers from mechanical engineering, electrical engineering, and computer engineering in MIT of the USA. Blumenthal et al. (1996) analyzed 2,167 researchers in life sciences of 50 universities in USA. In his study, 19.8% experienced that patent activity delays paper publication because of patents application, idea protection, and prevention of the spread of undesirable results, or because of negotiations on patent ownership. Also, 8.9% of researchers did not publicize papers.
The study on determinants of research productivity has been done in various aspects. Carayol and Matt (2003) set determinants with individual factors (age, promotion and identity) and laboratory factors (age and ranks of fellows, scales, number of post-doctor or PhD students and full time researchers) in analyzing six labs of Louis Pasteur university in France. Chu (2012) found that productive professors have few classes and high accessibility to funds, competent doctoral students and assistants, and research resources such as enhanced facilities.
This paper sets two types of hypotheses. The first type is from the facts drawn from the discussions on the determinants of research productivity. The second type is for the hypotheses on determinants. Hypotheses 1 (H1) to hypothesis 4 (H4) belong to the first type, and H5 to H8 belong to the second type.
2.1 Hypotheses for Facts
First, this study tests whether there is a difference by sex in research productivity. Previous studies show contradictory results as follows. Males have higher productivity than females (Levin and Stephan, 1998). Larivie`re et al. (2010) showed that females over 38 are relatively less productive than males in paper, citation and funding in a study of professors in Quebec, Canada. Abramo (2008) found out that male professor show 16.8% higher productivity in quantitative aspects and 4.5% higher productivity in qualitative aspects than female researchers in the analysis of around 33,000 Italian professors. Stephan et al. (2005) found similar results in patent activities in a survey of USA PhD graduates who had underwent patent applications. The reasons for lower productivity of female researchers are due to various factors such as lack of research time from house work (Creamer, 1998), lack of network activity to expand research opportunities (Epstein, 1988), or due to more stress from work than men (Smet et al., 2005).
On the other hand, Bland et al. (2005) found that in the Medical School of Minnesota, there is no difference in productivity between men and women if the rank variable is controlled. Kim and Park (2011) found out that difference in research productivity is not shown in a group who are within three years of their PhD degree. Kim (2014) also found that there is no difference between male and female in the study of 236 PhD students under the Global Doctoral Fellowship Program of the National Research Foundation of Korea.
H1 – There is a difference in research productivity by sex.
Second, this paper set a hypothesis for the relationship between age and productivity. Mairesse and Turner (2002) insisted that research productivity increases until the age of 52 and declines after that age. Generally, professors have the highest productivity when they are in the early 40s (Dalton and Thompson, 1971; Lehman, 1966; Oberg, 1960). They explained that this is due to low motivation, low risk acceptance and the difficulty in finding new technologies after their 40s. Meanwhile, Lehman (1953) insisted that the most important scientific discoveries are by young scientists, and that the most creative ages are in the late 30s and 40s.
Bland and Berquist (1997) found that many senior researchers show good productivity just as young researchers, even though they seem to have lower productivity. The causes are not the age, but changes in workloads or interests. Reskin (1998) found out the fact that there is no relation in age and productivity, but just between motivation, health, compensation, social status, or role of non-research.
H2 – Productivity increases along with age, and then it declines after a certain level.
Third, let us check the relationship between the country of PhD acquisition and productivity. Gonzalez-Brambila and Veloso (2007) found out the fact that there is no difference in productivity by the country of PhD acquisition analyzing the papers of 4,193 scientists. However, we set this hypothesis.
H3 – There is productivity differences by the country of PhD acquisition.
Fourth, the locations of scientists’ institutions affect productivity. In Korea, 37% of universities are located near Seoul, the Capital of Korea, and 63% are in other areas. Nevertheless, the top 10 universities occupy 44.7% of the total grants of US$ 470 million (Ministry of Education, 2013). Also eight among the top 10 universities are in Seoul. Therefore Seoul has the most concentration of research funds (KAIST and POSTEC are included in the Seoul group). Papers published show a similar distribution. The productivity of professors in Seoul is expected to be much higher.
H4 – Professors in Seoul have higher productivity than professors in other areas.
2.2 Hypotheses for Determinants
Fifth, let us check the relationship between research fund and productivity. Han (2008) found a positive correlation between government funding and SCI papers in sciences and engineering during the period of 2004 to 2006 in Korea. Godin (2002) compared 15,000 researchers who got funds from the National Science and Engineering Research Council of Canada with other scientists who did not get funds from 1990 to 1999. The result was that the productivity of researchers who got funds is higher than those who did not, and young scientists produce more results if they had funds. Branstetter and Sakakibara (2002) found that government funding gives positive effect on the productivity of companies by measuring their patents. On the other hand, the impact of funding to productivity is weak for the scientists who got funds from the NIH (National Institutes of Health) of USA from 1980 to 2000 (Jacob and Lefgren, 2011).
There can be differences depending on who supports the funds. Hottenrott and Lawson (2012) said funding sources influence research subjects and presentations in papers and patents. Papers and patents decrease with the funds from big companies, and patents but not papers, are increased by funds from small businesses. Thursby and Thursby (2002) said the requirements by funding companies might delay the publication of research results. Campbell et al. (2002) suggested publication can be influenced by commercial conflicts. Under these studies, new hypothesis is as follows:
H5 – Research productivity is affected by the source of research funds.
Sixth hypothesis comes from the relationship between the number of graduate students and productivity. Dundar and Lewis (1998) state professors’ productivity increases as the number of graduate student increases. In the study of agricultural education in the USA, Kotrlik et al. (2002) found out the fact that graduate students are powerful explanatory variables for professor’s productivity. However, there is no relationship with master students. Also, Berelson (1960) said professors with high productivity have more than three graduate students compared to less productive professors. Hagstrom (1965) stated that there is a correlation between graduate students and post-doctors in productivity. Kyvik (1991) said that professors can be a co-author in students’ paper. Therefore more students mean higher productivity. Fonseca et al. (1997) got answers from interviewing 51 professors and found that graduate students improve their research productivity. Hargens (1975) confirmed the difference by academic fields among mathematics, chemistry and politics.
Isabelle (2007) and Carayol and Matt (2004) found that patent productivity has correlation with the number of post-doctors but not with doctoral students. Papers are more important for doctoral students because of their degree, so they have fewer patents than post-docs.
H6 – The greater the number of graduate students, the more research productivity.
Seventh, let us check the relationship between academic rank and produc-tivity. Existing studies show productivity gets higher as the rank rises. The professors’ rank can affect productivity and it is the result of the promotion system requiring more productivity as rank becomes higher (Bland et al., 2005). The higher rank means more time for research, research funding, and access to informal networks (Kyvik, 1991). Thursby and Thursby (2003) found a negative correlation with patent and age, but a positive correlation for full professors. That is, professors focus on papers for tenure in their early career, and activities for making money to prepare their retirements in late ages (Audretsch and Stephan, 1999; Dasgupta and David, 1994; Thursby and Thursby, 2001). Here comes hypothesis 7.
H7 – Academic rank is an important determinant of research productivity.
Eighth, it would be unnatural to not include the variable of field difference in determining research productivity. Dietz and Bozeman (2005) stated that field is a determinant for papers and patents, and Stephan et al. (2005) said field difference makes patents difference. Hargens (1975) dealt with the role of graduate students in output by field. In addition, Gonzalez-Brambila and Veloso (2007) looked at the output difference in field by sex. Joo (1993) showed the field difference in output in the analysis of 2,080 professors in physics, chemistry, mechanical engineering and electronics, by personal attributes, by university type, by location of university and the country of PhD acquisition.
H8 – Academic field is an important determinant of research productivity.
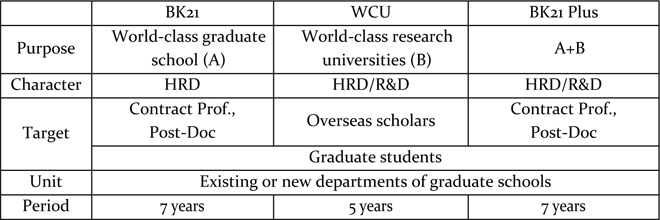
The BK21 plus, started in 2013, is the successive project of the 2nd stage of the BK21 project and WCU project. The main purposes of BK21 plus are to 1) strengthen university research, 2) strengthen local universities’ research capacity, 3) nurture graduates students who are closely related to industry and 4) support experts in convergence technology in specialized fields (Ministry of Education, 2013).
The BK21 project is the program to build world-class graduate schools and specialized local universities, improving the academic research of universities in Korea through the 1990s. Stage 1 was from 1999 to 2005 and stage 2 was from 2006 to 2012. In the second stage, government funded US$ 1.7 billion for seven years (Han et al., 2014). BK21 is evaluated as contributing to the increase of papers and graduate schools itself, and to further enhance academic exchanges with overseas countries (Seol, 2012).
NRF Projects
The WCU program targeted the invitation of outstanding foreign scholars to the department or research units of research universities and for the purpose of joint research. This program is evaluated to aid the education and research of research universities. BK21 Plus is the integrated program of BK21 and WCU projects, so it takes over the purposes of both projects.
2.1 Data
The main data is from the BK21 Plus project of the NRF, and covers the 3-year average of 1,383 professors from six fields (physics, chemistry, biology, mechanical engineering, electrical and electronics, chemical engineering) during 2010-2012. The data for sex, age, rank and country of PhD acquisition are from the Korean Research Information (KRI) DB of the NRF.
The ranks of professors are divided into full, associate and assistant professors. The countries of PhD acquisition are Korea, USA, EU and Japan. Research funds include government, industry and overseas. The locations of universities are in Seoul and other regions. However, 4 S&T research universities already regarded as different group in non-Seoul universities are treated as Seoul: Korean Institute of Science and Technology (KAIST), Gwangju Institute of Science and Technology (GIST), Pohang University of Science & Technology (POSTECH), and Ulsan National Institute of Science and Technology (UNIST). The data of some PhD countries are rearranged: 12 PhDs from Canada are included in USA, 5 PhDs (1 from Malaysia, 2 from Singapore, 2 from India) are in Japan. Besides, the acquisition of PhDs in 54 cases could not be identified and those cases were excluded from the data.
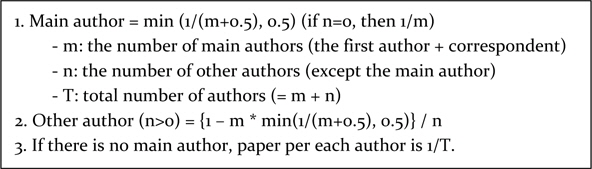
A paper can have many authors. Therefore, to compute a person’s output, a paper with many authors should be split according to the role of authors. NRF suggested a standard for calculating a person’s contribution to the paper. This standard is shown in Table 2 and summarized as follows: if there are 2 main authors such as the first and the correspondent and 1 other author, then, the two main authors get 2/5 credit per person and 1 other author get 1/5. If a paper has 2 main and 2 other authors, then, 2/5 for main authors per person and 1/10 for 2 others. Research funds are divided by the number of participating professors, since there is no detailed information on the contribution of each professor.
[Table 2.] Formula for author counting

Formula for author counting
The methods for analysis are as follows: First, we set 3 definitions of research productivity such as paper, patent and mixed unlike other studies which used only one. Second, data for personal variables and resources variables are classified into several groups. Third, the validities of these classifications are tested by one-way analysis of variance. Fourth, correlation between variables is checked by correlation analysis. Fifth, to find out the determinants of research productivity, we tried regression analysis.
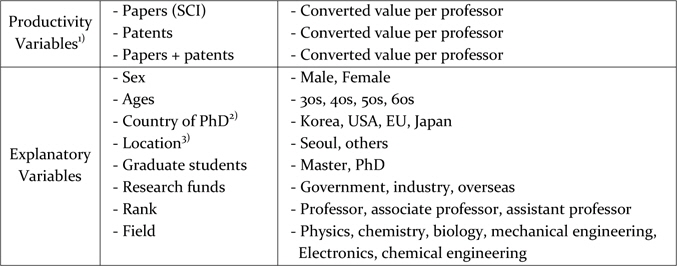
2.2 Variables Summary
This study uses papers, patents and mixed as productivity variables. Therefore, we have to put weights on various outputs. One international patent is 1 with the same scale as 1 SCI paper, but 1 domestic patent is converted to 0.5. This is the average scale used in the evaluation models of 10 universities

Variables
3.1 Distribution of Productivity Variables
The average output of 1,383 professors by papers per year during 2010-2012 are 1.6; the highest groups are chemical engineering (2.6); male (1.7); age of 50s (1.8); full professors (1.8); location of Seoul (1.8); and Japan of PhD countries (1.8) as shown in Table 4. The numbers of papers and patents equals the total output per professor per year. Also, the numbers of papers compared to patents are the ratio between paper and patent in each category.
[Table 4] Average research productivity by type per year
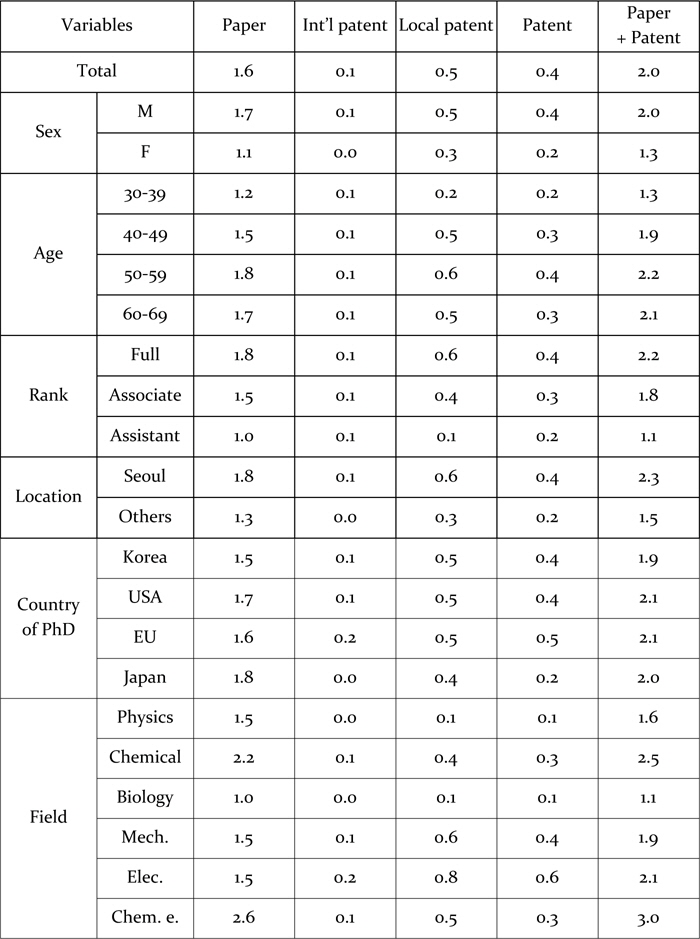
Average research productivity by type per year
3.2 Distribution of Graduate Students
There are an average of 1.4 master students and 1.5 of doctoral students per professor, so the total average is 2.8 per professor. Like research output, male professors have more graduate students than female professors. The number of students a professor has increases until their 50s and decreases in the 60s. The higher the rank, the more graduate students they have like research output. By location, professors in Seoul have more than double with 3.5 students than other areas with 1.7 students. Professors with a PhD from the USA had the highest average number of students at 3.2 and Korea is at the bottom with 2.4. In fields, chemical engineering and mechanical engineering professors had the most graduate students at 3.3 on average and physics professors had the lowest with 1.9 students.
[Table 5] Average number of graduate students
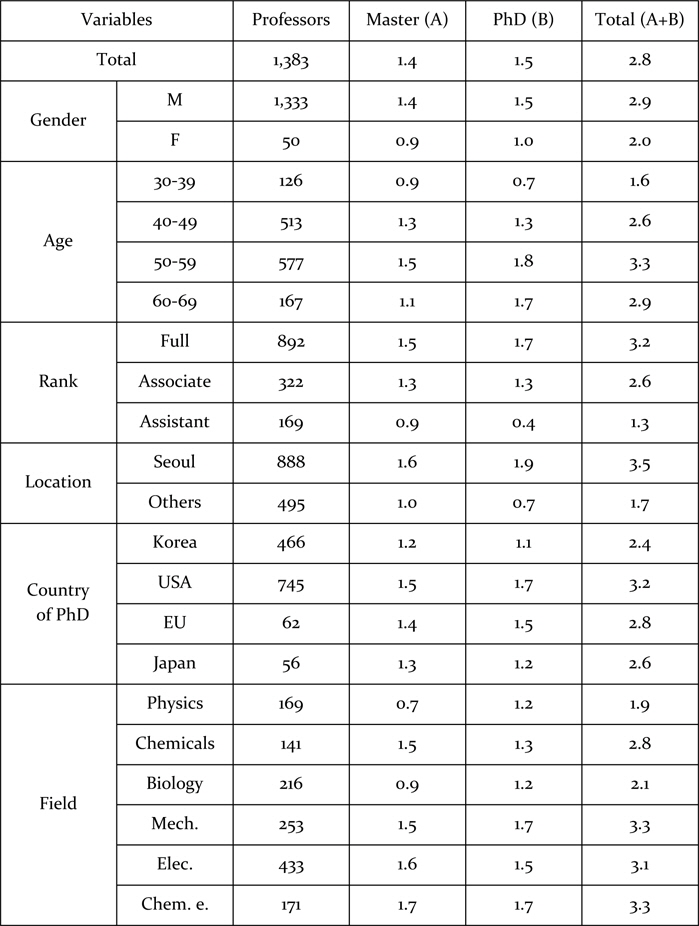
Average number of graduate students
3.3 Distribution of Research Funds
Data for research funds by groups are shown in Table 6. The total average amount of research funds per year per professor is 505 million Korean Won (about US$ a half million). Government funds are the main source of research accounting for 83% followed by industry fund with 15.5% and 1.2% from overseas. It is very interesting that the trends found in paper and patent are similar in research funds: more to males than females; increase until the 50s and decrease in the 60s; the higher in rank, the more funds; more in Seoul than other areas; the order of USA, EU, Japan and Korea in the countries of PhD acquisition; chemical engineering at the top and biology at the bottom.
[Table 6] Average research funds (Korean Won: million)
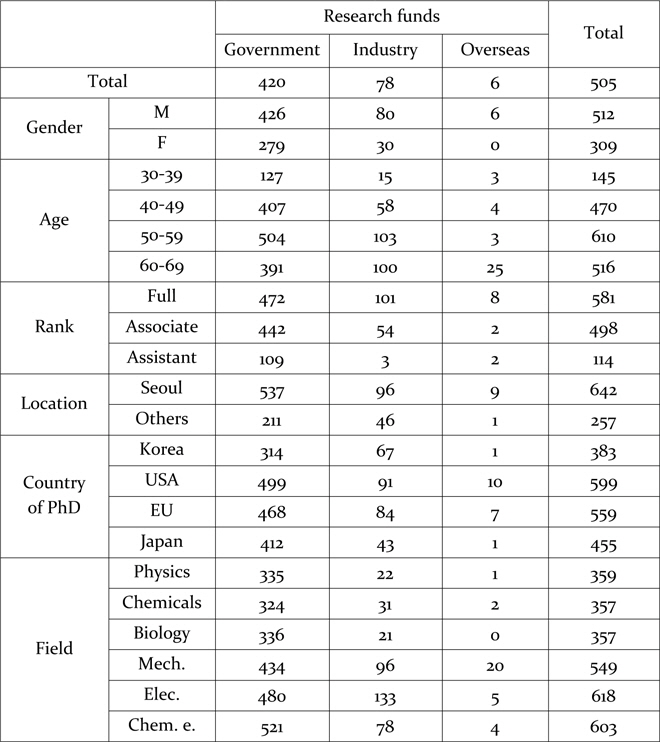
Average research funds (Korean Won: million)
1. Test on the Differences in Productivity
Table 7 shows the test results on the differences of research productivity. In most indices of productivity, statistical significances (p<0.05) exist except country of PhD in personal variables and international patents in the productivity indices. This means that there are differences between groups in sex, age, rank, location and field in the productivity indices of paper, patent, and paper + patent. As for international patent, difference exists by sex, by location and by field. The variable of country of PhD is only different in the research productivity of mixed output.
[Table 7] Test results on average productivity differences
Test results on average productivity differences
2. Test on Research Resource Differences
[Table 8] Test results of average resource differences
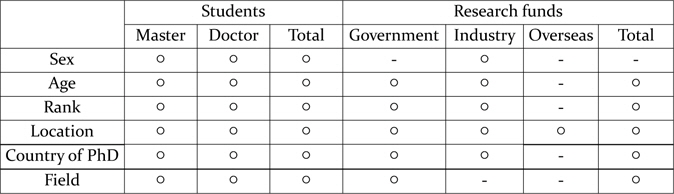
Test results of average resource differences
The average number of graduate students and funds per head are examined to confirm the resource differences. By the independent samples t-test and one-way analysis of variance (ANOVA), nearly all the personal variables have differences by several indices of research resources except overseas fund.
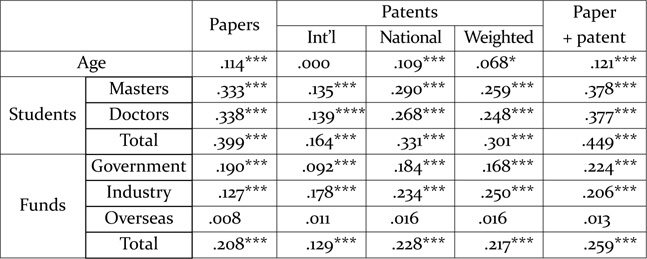
3.1 Correlation between Explanatory and Productivity Variables
The positive number of Table 9 means they are correlated positively, and all the coefficients show positive values. However, the statistical significance is more important than the coefficients. All variables, except for age and overseas fund, are correlated statistically (p<0.05). The age variable does not show any statistical significance in international patents (p<0.05).
[Table 9] Correlation between explanatory and productivity variables

Correlation between explanatory and productivity variables
3.2 Correlation between Paper and Patent
There are positive correlations (p<0.05) between papers and patents as shown in Table 10. The correlation coefficient between papers and patents is 0.250: That means, with a 1 paper increase, there is a 0.25 patent increase. This is the same result with previous studies (Carayol, 2004; Stephan et al., 2005; Wong, 2010) suggesting the positive correlation between them.
[Table 10] Correlation between paper and patent
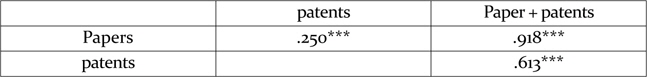
Correlation between paper and patent
The correlation analysis states the relationship and the direction of relationship between 2 variables. The regression analysis states the degree of relationship of explanatory variables to dependent variables of the productivity index, considering all the variables at the same time.
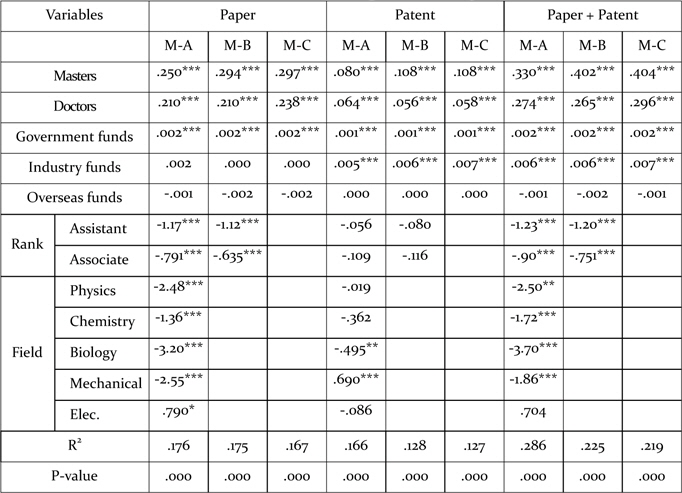
The results of various multiple regression analysis are shown in Table 11. The M-A in the table is the model with more explanatory variables, and the M-C in the table is the model for just resources variables. M-B is the model for resources variables and academic rank. Personal variables such as sex, age and country of PhD are missing in all the models under several reasons: Too many dummy variables can deteriorate the estimation result, in particular the real number variables. These variables are not statistically significant, and even if the variables are included, the explanatory powers of estimation (R2) are not considerably improved.
[Table 11] Results of regression analysis
Results of regression analysis
Three statistical indices are important in regression analysis; statistical reliance of explanatory power, the degree of explanatory power and statistical significance of each variable. As for statistical reliance of each model, fortunately, all the models in the table have statistical significance with 0.000. That means 99.99% statistical reliance. The explanatory powers are not as great and are within the range of 12.7-28.6%. This means that there are many other factors which affect research productivity beyond the variables used by the models in the table. Some variables in every model have a statistical significance below 10%, and they are the determinants.
In the table, personal variables on the left side such as rank and field lack 1 group respectively: full professor in rank and chemical engineering in field. It is a technique of regression that 1 variable in a group should be omitted for estimation, just in case that the groups are dummy variables. Therefore, the coefficients of represented variables have meanings compared to the omitted variable. For example, in papers estimation, -1.17 of assistant in the model M-A means that assistant professors had fewer papers than professors.
In the paper column, the variables having statistical significance in the model M-C are shown in model M-B and M-A at the same time. This means that the variables having statistical significance in the model M-A are the determinants of paper output. The statistical significance of the column on patent and (paper + patent) have the same meaning with the column of paper.
The coefficient of each variable means the degree of impact. For example, the coefficient of 0.250 of master students in the model M-A in paper column means if there is a 1 master student increase, then, there is a 0.250 paper increase. The coefficient of 0.002 of government funds in the same column means that for 1 unit (Korean Won 1 million) of government funds, there will be an increase of 0.002 in papers.
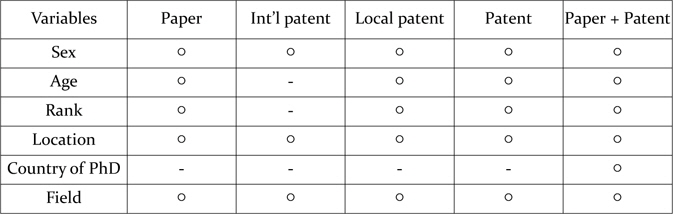
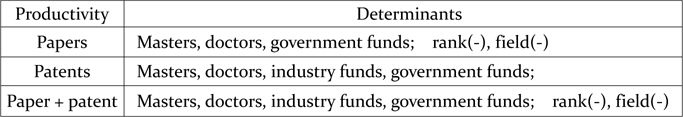
As for determinants, the estimation results of the paper column mean the determinants of paper. Those determinants are master students, doctoral students, government funds and rank and field. Like the paper column, the determinants of patent are master students, doctoral students, industry funds and government funds. The determinants of overall productivity are master students, doctoral students, industry funds and government funds in resources variables, and rank and field in personal variables. The summary of determinants is shown in Table 12.
[Table 12] Summary of determinants
Summary of determinants
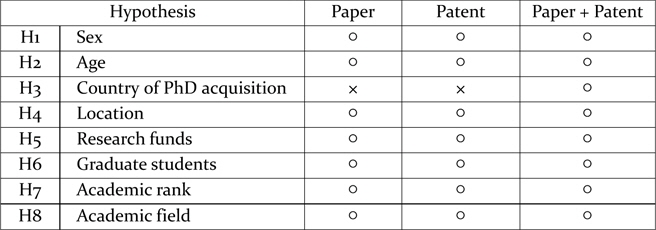
1.1 Summary of Hypotheses
Although the object of this study is to figure out the determinants of research productivity, we set eight hypotheses: 4 for facts drawn during analysis and 3 for determinants. Research productivity was measured by papers, patents and by papers and patents. The explanatory variables are personal variable of rank. The resources variables are the number of master and doctoral students, government funds, industry funds and overseas funds.
Hypotheses for Facts H1 – There is a difference in research productivity by sex. H2 – Productivity increases along with age, and then it declines after a certain level. H3 – There is productivity differences by the country of PhD acquisition. H4 – Professors in Seoul have higher productivity than professors in other areas.
Hypotheses for Determinants H5 – Research productivity is affected by the source of research funds. H6 – The more the number of graduate students, the more research productivity. H7 – Academic rank is an important determinant of research productivity. H8 – Academic field is an important determinant of research productivity.
The results are as shown in Table 13. Every hypothesis except H3 is accepted. The variable of country of PhD acquisition related to H3 is rejected in paper and patent, and only accepted in paper + patent. These results confirm previous studies. • Male is superior to female in research productivity (Abramo, 2008; Larivie`re et al., 2010). • In age, productivity increases until the 50s, but decreases in the 60s. It is similar with Cole (1979) and Levin and Stephan (1991) in paper, but different from Thursby and Thursby (2003) and Hoisl (2005) in patent. • As for H3 on the country of PhD acquisition, only overall productivity is accepted, but not in paper and patent. This is the same result as Gonzalez-Brambila (2007). • As for H4 on the location of professors, professors of Seoul have more papers, patents and overall output than other areas. It is similar to a study by NRF in 2013. • In research funds, government funds and industry funds are significant for research productivity. H5 is accepted. This is the same as shown in Benoit Godin (2002), Bland et al. (2005) and Branstetter and Sakakibara (2002). • In the number of graduate students, master and doctoral students are important factors for productivity. H6 is accepted. Kotrlik et al. (2002) and Berelson (1960) suggested the same result in previous research. • Higher the rank, higher the productivity. Therefore, H7 is accepted. This is the same with Bland et al. (2005), Kyvik (1991) and Thursby and Thursby (2003). • Academic field is an important determinant for research productivity. This is the same with Dietz and Bozeman(2005), Stephan et al. (2005), Hargens (1975), Gonzalez-Brambila and Veloso (2007) and Joo (1993).
[Table 13] Hypothesis test results

Hypothesis test results
1.2 Facts Derived during the Testing Process
The coefficients statistically significant in regression analysis are explained as follows: • If one more master student joins, then, there is an increase of 0.25-0.30 papers, 0.08-0.11 patents and 0.33-0.40 in overall productivity. One more doctoral student contributes to an increase of 0.21 papers, 0.06 patents and 0.26-0.30 overall in productivity. The impact of master students is greater than that of doctoral students. • For every KRW 100 million in government funding, there is an increase of 0.002 in papers, 0.001 in patents and 0.002 in overall productivity. However, the increase of the same amount in industry funds does not influence papers but increases patent and overall productivity by 0.006. • In rank, paper productivity of associate professors is lower than that of full professors at 0.63-0.79 and assistant professors is lower by 1.12-1.17 than that of full professors. This number increases to 0.75-0.90 and 1.20-1.23 in overall productivity. However, patent is not affected by rank. • In fields, various fields have lower output than chemical engineering from 1.36 in chemistry to 3.20 in biology in papers, and 1.72 in chemistry to 3.70 in biology for overall productivity. • The results of this study show that the relation between paper and patent is complementary which has been argued in previous papers. This is the same with Stephan et al. (2005), Carayol (2004), Markiewic-DeMinin (2004) and Wong (2010).
2. Limitations and Implications
This study is new in adopting personal variables and resource variables at the same time for analyzing research productivity, and in its use of official data. In addition, the variables for research productivity are new. Paper was the most frequently used variable for research productivity in previous studies, but we use paper, patent and a combination of the two at the same time. This might be the first attempt.
In practice, this study for the first time deals with data from the BK21 Plus Program, in which participating professors have higher output. Therefore, the results of this study cannot apply to general professors who do not participate in the Program, because the numbers dealt with in this study may be higher than those of general professors.
Finally, this study has limitations in generalization to all science and engineering fields because it deals with only six fields. Therefore, further studies will be needed to identify characteristics in the productivity variables and explanatory variables across fields.
Another limitation comes from the explanatory power (R2) of the models used in this paper ranging 21.9-28.6%. These numbers mean that even if this paper adds resources factors to personal factors frequently used in previous studies, there are many variables not included in our study. The variables for research productivity may include more resource factors, more personal factors such as psychological and attitude, and incentive and environmental factors. More studies on these factors will be the future studies.