Organic enrichment was investigated in surface sediments from the Yeoja and Gangjin Bays of Korea, which contain dense shellfish farms, in order to evaluate the contamination status and temporal changes in shellfish farming along these coasts. The degree of organic enrichment was determined using geochemical indicators (chemical oxygen demand, ignition loss, acid volatile sulfide, total organic carbon in sediments, and total nitrogen in sediments, ammonium and nitrate in pore water, and bioluminescence inhabitation for sediments). Temporal changes in organic enrichment conditions were detected by comparing our 2012 data to those previously reported from a survey conducted in 1999/2000. Organic enrichment was significantly higher in September than in May and July, in Gangjin Bay than in Yeoja Bay, and significantly higher in shellfish farms than in reference sites not used to culture shellfish. Ammonium concentrations in pore water were two orders of magnitude greater than nitrate concentrations, suggesting that these bays represent nitrogen-reducing environments.
우리나라에서 패류양식은 전체 해면 양식 생산량의 약 45%를 차지할 정도로 그 비중이 매우 높다. 천해 패류 양식은 경상남도와 전라남도 일원 해역을 중심으로 발달하였으며, 2009년 해면 양식 면허 건수와 면적은 각각 5,637건과 49,538 ha에 달하고, 패류의 양식생산량은 2007년 478,646톤으로 최고치를 보였으나 이후 점차 감소하여 2009년에는 326,544톤으로 감소한 실정이다(MIFAFF, 2010).
최근 들어 양식패류 생산량이 급격한 감소추세를 보이는 원인은 명확하게 밝혀지지 않고 있지만, 일부 연구들은 환경오염으로 인한 양식어장환경의 악화, 모패 자원의 열성화, 양식용 종패의 채묘 부진, 대량폐사 발생 등을 원인으로 보고하였다(MIFAFF, 2009). 우리나라 연안의 패류양식어장은 양식시설물 설치 및 관리의 용이성 그리고 먹이생물의 풍부에 따른 양식기간의 단축 등으로 주로 내만과 간석지를 중심으로 발달되어 왔다. 그 결과, 우리나라 연안해역의 산업화에 의한 부영양화가 증가하고, 과도하게 시설되어 장기간에 걸쳐 양식하여 왔기 때문에 성장이 지연되고 질병이 쉽게 전염되어 생산성이 낮아지고 있는 것으로 보고된다(GNDI, 2012). 따라서 지속적인 패류양식 생산성 유지를 위해서는 양식어장 환경변화를 파악하여 효율적으로 관리할 수 있는 방향 제시가 필요하다.
패류양식은 어류양식과 달리 종묘확보 후 수하연에 시설하거나 해저에 살포한 이후 최소한의 관리만 할 뿐 양식장 해역의 자연생태계에 전적으로 의존한다. 그러므로 생태계의 생물생산을 위한 부양능력 즉 환경수용능력이 생산의 중요한 제한요인이다. 패류는 여과식자(filter feeder 또는 deposit feeder)로서 수층에 존재하는 입자유기태(유기물, 클로로필 등)를 섭이하여 수질정화도 하지만, 많은 양의 배설물(faeces)와 의분(pseudofaeces)이 양식장 퇴적물로 퇴적되면서 표층퇴적물내 분해되기 쉬운 유기물(labile organic matter)의 유입이 증가해 저서환경의 물리화학적 특성을 변화시킨다(Danovaro et al., 2004). 과도한 패류양식은 먹이생물 부족(phytoplankton depletion), 생물학적 침적물(biodeposition) 증가, 생태계 변화와 같은 어장환경의 잠재적인 위해도를 높여왔다(Ogilvie et al, 2000; Jie et al., 2001; Beadman et al., 2004; Giles et al., 2006; Zhou et al., 2006). 지금까지 국내 패류양식에 대한 연구들은 패류양식어장의 환경오염 및 영향에 대해서 조사해 왔지만 대부분 굴, 진주담치 등을 생산하는 수하식 양식을 중심으로 진해만, 거제연안, 가막만에서 비교적 많은 연구가 수행되었다(Park and Yi, 2002; Hyun et al., 2003; Noh et al., 2006; Yoon et al., 2007; Lee et al,. 2008; Cho et al., 2009; Lee et al., 2011). 반면, 바지락, 고막류 등 퇴적층내 서식하는 패류의 양식어장환경에 대한 연구는 미흡한 실정이다(Choi et al., 2005, 2007). 본 연구는 남해안 대표적인 고막류(ark shell) 양식어장인 여자만과 남해 강진만에서 패류양식해역과 비양식해역을 구분하여 유기물 축적에 따른 저서환경의 오염현황을 비교하였다. 또한 과거 조사자료(1999/2000년)와 비교하여 여자만과 강진만에서 시간적 저서환경의 변화를 평가하였다. 이를 위해 퇴적물내 유기물축적지표(화학적 산소요구량, 강열감량, 산휘발성황화합물, 총유기탄소, 총질소)와 공극수중 암모니아와 질산 질소를 조사하였고, 퇴적물의 독성도를 파악하기 위해 발광미생물의 발광저해도도 함께 조사하였다.
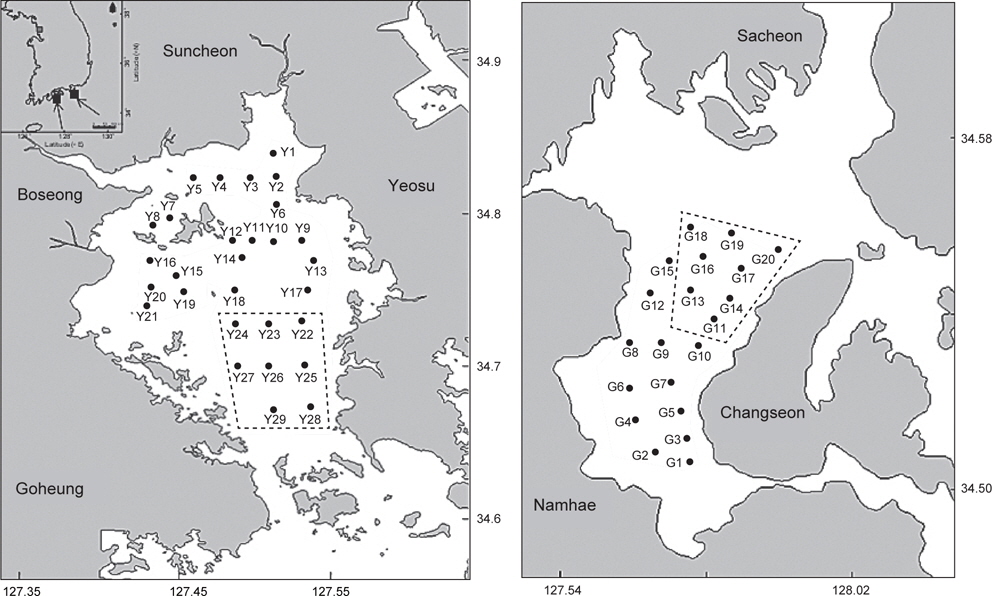
여자만(Fig. 1)은 남해안 중앙에 위치하고 있으며, 고흥반도, 여수반도로 둘러 싸여 있는 반 폐쇄성 내만으로 평균수심은 약 5.4 m, 남북길이는 30 km, 동서길이는 22 km에 달한다. 여자만은 남해안의 다른 만들에 비해 면적이 넓은 반면 외해수와의 교환은 남쪽 만 입구의 좁은 수로를 통해서 이루어 진다. 여자만에 허가된 양식면허는 465건, 7,056 ha이며, 주요 생산품종은 피조개, 고막과 새고막이고, 고막류의 면허는 351건, 4,712 ha로 전체 양식면의 67%를 차지한다(Lee, 2012).
강진만(Fig. 1)은 경상남도의 남서부에 남해군, 사천시, 하동군에 의해 둘러싸여 있는 반폐쇄성 내만으로 평균수심은 약 3.6 m, 남북길이 약 18 km, 동서길이 약 15 km에 달한다. 강진만은 총 168건에 1,028 ha의 어업권이 허가되어 있고, 양식어업은 피조개 양식(109건, 623 ha)이 가장 많고, 바지락 (27건, 202 ha), 굴(25건, 147 ha), 새고막(7건, 55ha)순이었다. 강진만 해면중 5,290 ha는 수출용 패류생산해역(7호 해역)으로 지정되어 관리되고 있다(Park et al., 2010).
여자만은 2012년 5월과 9월에 각각 29개 정점에서, 강진만은 7월과 9월에 각각 20개 정점에서 표층퇴적물(~4 cm)을 채취하였다. 패류양식어장(farm)과 양식활동이 없는 해역(reference)을 구분하여 시료를 채취하였고, 여자만은 고막류 양식해역(Y1-Y21)과 비양식해역(Y22-29), 강진만은 고막류 양식해역(G1-G11), 굴 양식해역(G12, G15), 비양식해역(G13, G14, G16-G20)으로 구분하였다. 퇴적물 시료는 표면적 0.05 m2의 van Veen grab을 사용하여 채집한 후 polyethylene병에 넣은 후 냉동보관하였다. 저서환경 특성을 파악하기 위해 표층퇴적물에 대해 입도(grain size), 화학적 산소요구량(chemical oxygen demand; COD), 강열감량(ignition loss; IL), 산휘발성황화합물(acid volatile sulfide; AVS), 총유기탄소(total organic carbon; TOC), 총질소(total nitrogen; TN)를 분석하였고, 공극수중 암모니아 질소(NH4+-N)와 질산 질소(NO3--N)도 분석하였다. 퇴적물의 독성도를 파악하기 위해 퇴적물의 유기용매추출액에 대해 발광미생물의 발광저해도를 조사하였다. 입도, COD, IL, AVS, 발광미생물의 발광저해도의 분석은 해양환경공정시험기준(MLTM, 2010)에 따라 수행하였다.
퇴적물내TOC 및 TN은 냉동 건조시킨 퇴적물 시료 0.5 g을 유리 vial에 넣고 1 N HCl 10 mL를 첨가하여 탄산염을 제거하고, 70℃에서 24시간 동안 수분과 잔류염소를 날려 보냈다. 전처리된 시료는 105℃에서 2시간 건조시키고, 상온에서 2시간 방치한 후 주석박막으로 3-5 mg의 시료를 CHN 원소분석기(Perkin Elmer, model 2400)로 분석하였다(Yoon et al., 2009a; Jung et al., 2011, 2012).
공극수시료는 표층퇴적물 채취와 동시에 현장에서 Rhizon sampler를 이용하여 퇴적물내 공극수를 추출하고 분석전까지 냉동보관하였다(Hwang et al., 2012). 공극수는 증류수로 희석한 다음 영양염 자동측정기(Seal Analytical GmbH, Model Quatro)를 사용하여 질소계 영양염류인 NH4+-N와 NO3--N를 측정하였다.
여자만과 강진만의 조사자료의 정규분포 검정은 Kolmogorov-Smirmoff와 Shapiro-Wilk test를 이용하여 추정하였고, 조사자료에 대한 농도값의 차이는 Mann-Whitney U test를 이용하여 추정하였다. 조사항목들간의 상관성은 데이터의 로그변환 후 Pearson correlation coefficient로 계산하였다. 통계적 유의수준은
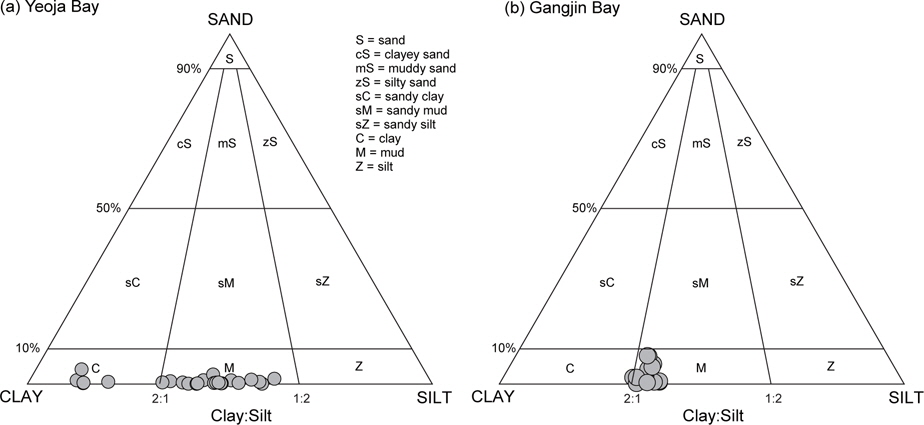
2012년 5월에 여자만 29개 정점에서 채취한 표층퇴적물의 퇴적상은 Fig. 2에 나타내었다. 여자만에서 니질(clay+silt)함량은 95.8-100%(평균 99.2%)이었으며, 평균입도는 7.61-10.1 Ø (평균 8.75 Ø)를 보였다. 여자만의 서부해역(Y15, Y16, Y19-Y21)에서 8.00 Ø이하의 평균입도(7.61-7.99 Ø)를 나타내었고, 만 입구인 남부해역(Y25-Y29)에서 10.0 Ø 정도 평균입도(9.93-10.1 Ø)로 극 세립질 퇴적물이 우세하였다.
2012년 7월 강진만 20개 정점에서 채취한 표층퇴적물의 니질함량은 82.7-99.9% (평균 95.8%)이었고, 평균입도는 7.54-9.12 Ø (평균 8.70 Ø) 보였다. 강진만의 서부해역(G6, 7.54 Ø)과 만내측(G1, 9.12 Ø)을 제외하고, 평균입도는 8.00-9.00 Ø 범위로 균일하였다 (Fig. 2). 두 해역은 비교적 세립질 퇴적물이 우세하게 분포하는 저에너지 환경으로 생각할 수 있다. 고막류에 대한 해수양식장 적지조사의 입도 기준은 니질함량 80%이상으로 고막류는 세립질 퇴적물을 선호하며(NFRDI, 2008), 여자만과 강진만의 퇴적물 입도는 적지조사기준을 모두 만족하는 수준이었다.
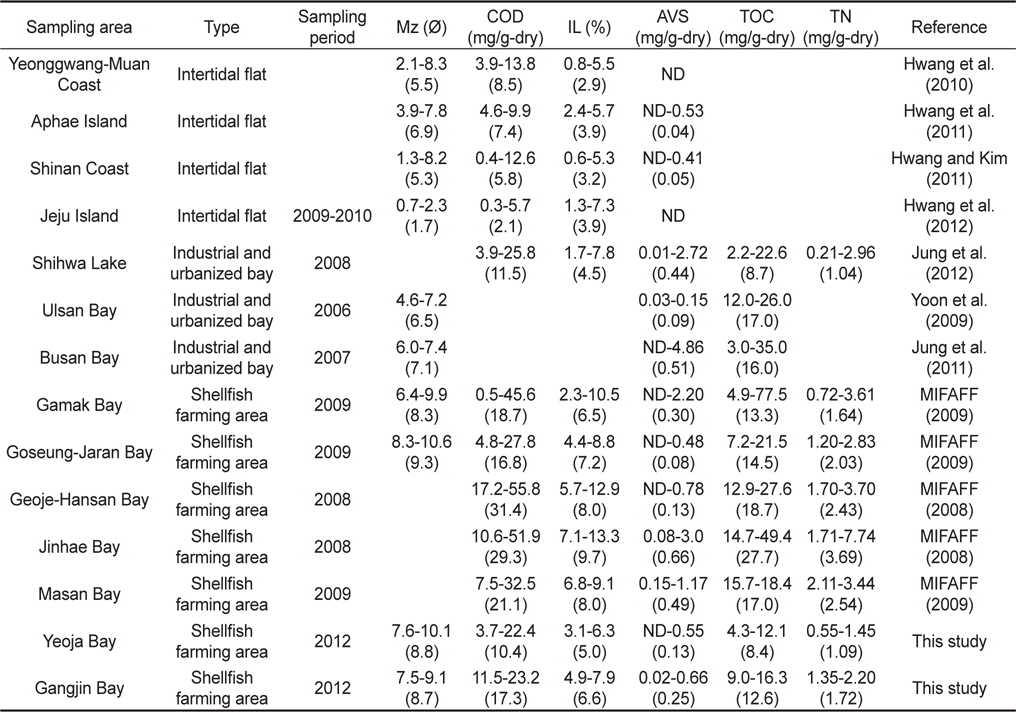
Table 1은 패류양식어장을 포함한 우리나라 연안에서 퇴적물의 평균입도를 나타내었다. 여자만과 강진만은 굴, 진주담치 등 수하식 패류양식어장이 형성되어 있는 가막만과 고성-자란만(MIFAFF, 2009)에서 조사된 결과와 유사한 수준이었다. 반면, 서해안 조간대인 영광-무안(Hwang et al., 2010), 압해도(Hwang et al., 2011), 신안(Hwang and Kim, 2011)과 제주도(Hwang et al., 2012)에 비해 여자만과 강진만은 세립질이었고, 산업적으로 발달되어 산업폐수와 생활하수의 유입이 많은 시화호(Choi et al., 2010a), 울산만(Yoon et al., 2009a), 부산항(Jung et al., 2011)보다도 세립질 퇴적물로 이루어져 있었다. 이와 같은 결과는 여자만과 강진만이 세립한 퇴적물을 공급할 수 있는 하천이 발달되어 있고, 반폐쇄성 내만의 특성을 가지고 있어 세립한 퇴적물이 외해로 빠져 나가지 않기 때문으로 판단된다(Choi et al., 2007; Kim et al., 2011).

Comparison of concentrations of mean grain size (Mz), COD, IL, AVS, TOC, and TN in sediments from Korean coastal waters
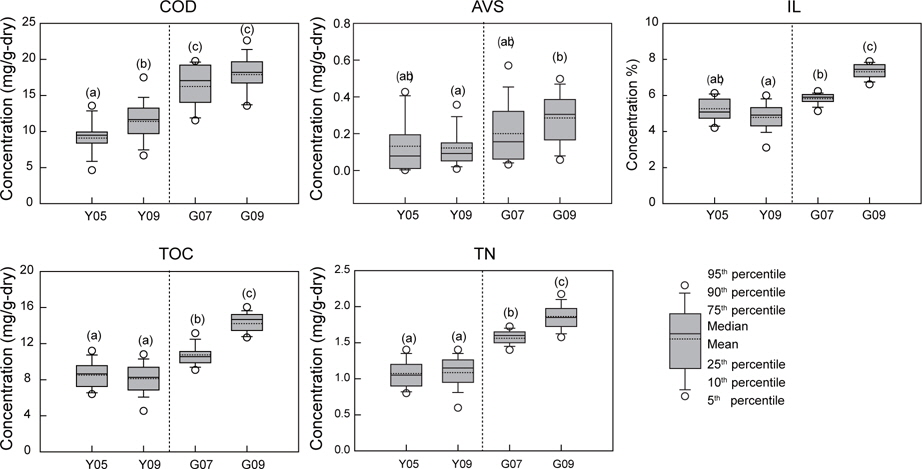
저서환경에서 퇴적물에 유기물 축적을 나타내는 지표인 COD, IL, AVS, TOC, TN를 조사하여 Fig. 3에 나타내었다. 표층퇴적물내 COD농도는 여자만에서 3.67-22.4 mg/g-dry (평균 10.4 mg/g-dry), 강진만에서 11.5-23.2 mg/g-dry (평균 17.0 mg/g-dry)이었다. 일본의 퇴적물 오염기준 20 mg/g-dry (Lee and Yu, 2000)를 초과하는 농도는 여자만 Y24 정점과 강진만 G4, G5, G7, G9로 대부분 만 중앙해역에서 조사되었다. 여자만에서 COD는 5월(평균 9.30 mg/g-dry)에 비해 9월(평균 11.6 mg/g-dry)에 크게 증가한 반면(
표층퇴적물내 AVS 농도는 여자만에서 불검출-0.55 mg/g-dry (평균 0.13 mg/g-dry), 강진만에서 0.02-0.66 mg/g-dry (평균 0.22 mg/g-dry)이었다. 일본의 퇴적물 오염기준 0.2 mg/g-dry(Lee and Yu, 2000)를 초과한 농도는 여자만 58개 시료중 12개, 강진만은 40개 시료중 21개에서 조사되었고, 2회 조사에서 모두 초과한 정점은 여자만 Y1, Y2, Y3, Y10, 강진만 G1, G2, G3, G4, G5, G7, G9, G10 정점으로 만 내측에서 조사되었다. 여자만의 표층퇴적물에서 AVS는 5월(평균 0.13 mg/g-dry)과 9월(평균 0.12 mg/g-dry)에 유사한 수준이었고, 강진만에서 AVS도 7월(평균 0.21 mg/g-dry)과 9월 (평균 0.29 mg/g-dry)에 유사한 수준이었다(Fig. 3). 9월 퇴적물내 AVS의 평균농도는 여자만(0.12 mg/g-dry)보다 강진만(0.29 mg/g-dry)에서 두 배나 높았다(
표층퇴적물내 IL함량은 여자만에서 3.10-6.34% (평균 5.00%), 강진만에서 4.93-7.94% (평균 6.67%)이었다. IL 평균값 이상을 보인 정점은 여자만에서 Y1-Y5, Y10, Y13, Y22, Y23, Y26이었고, 9월 강진만에서 거의 모든 조사정점 20개중 19개에서 IL 평균값이상을 초과하였다. 여자만의 표층퇴적물에서 IL은 5월(평균 5.15%)과 9월(평균 4.84%)에 유사한 수준이었지만, 강진만에서 IL은 7월(평균 5.82%)에 비해 9월(평균 7.37%)에 크게 증가하였다(
표층퇴적물내 TOC 농도는 여자만에서 4.25-12.1 mg/g-dry (평균 8.38 mg/g-dry), 강진만에서 8.95-16.3 mg/g-dry (평균 13.0 mg/g-dry)이었다. Hyland et al. (2005)가 제안한 대형저서동물군집에 영향을 줄 수 있는 TOC 35 mg/g-dry와 Yokoyama et al. (2004)가 제안한 어류양식장 주의구역(warning zone) 농도 20 mg/g-dry를 초과하는 정점은 본 연구에서 조사되지 않았다. 반면, 캐나다 온타리오주의 표층퇴적물중 TOC의 악영향 최소농도 10 mg/g-dry (Lee and Yu, 2000)을 초과한 시료는 여자만 내측(Y1, Y2, Y3)에서, 강진만은 거의 모든 정점(40개 시료 중 34개)에서 조사되었다. 여자만의 표층퇴적물에서 TOC는 5월(평균 8.56 mg/g-dry)과 9월(평균 8.19 mg/g-dry)에 유사한 반면, 강진만에서 TOC는 7월(평균 10.8 mg/g-dry)에 비해 9월(평균 14.4 mg/g-dry)에 크게 증가하였다(
표층퇴적물내 TN 농도는 여자만에서 0.55-1.45 mg/g-dry (평균 1.09 mg/g-dry), 강진만에서 1.35-2.20 mg/g-dry (평균 1.73 mg/g-dry)이었다. 여자만의 표층퇴적물에서 TN은 5월(평균 1.07 mg/g-dry)과 9월(평균 1.10 mg/g-dry)에 유사한 수준이었지만, 강진만에서 TN은 7월(평균 1.58 mg/g-dry)에 비해 9월(평균 1.86 mg/g-dry)에 증가하였다(
퇴적물에서 높은 COD, IL, TOC, TN 농도값을 보인 정점들은 높은 AVS 값을 나타내었다(
이러한 결과들을 종합해 볼 때, 여자만과 강진만 퇴적물에서 유기물 축적은 5월, 7월보다 9월에 크게 증가하고, 만 외측보다 내측에 그리고 여자만보다 강진만에 높은 경향을 보였다. 여자만과 강진만의 유기물 축적도는 서해안 조간대 해역보다 높은 수준이었고, 패류양식시설 밀집 해역중 가막만, 고성-자란만과 유사하였고, 거제-한산만, 진해만, 마산만보다는 낮은 수준이었다. 유기물 축적의 계절변화는 전복양식장에서 입자상유기물과 암모니아, 황화수소의 농도변화를 보인 Kim et al. (2011)의 연구와도 일치하는 것으로, 수온이 증가하여 양식생물의 배설량이 증가함에 따라 배설물의 퇴적(biodeposition)이 증가하여 혐기성 유기물 분해가 활발해진 것을 의미한다(Callier et al., 2006). 여자만에 비해 강진만의 퇴적물내 유기물 축적이 더 높은 경향은 1999/2000년 국립수산과학원의 조사결과와도 일치한다(NFRDI, 2002). 여자만에 비해 강진만 퇴적물내 유기물의 높은 축적은 높은 유기물 유입량, 조류 소통 등의 차이로 사료된다. 특히, 강진만은 풍수기에 남강댐의 영향으로 만 전체가 저염분 현상이 나타날 정도로 담수 유입량이 많고, 수심이 비교적 낮은 해역에서 발생하는 퇴적물의 재부유 등에 의해 높은 부영양상태가 나타난다(NFRDI, 2001).
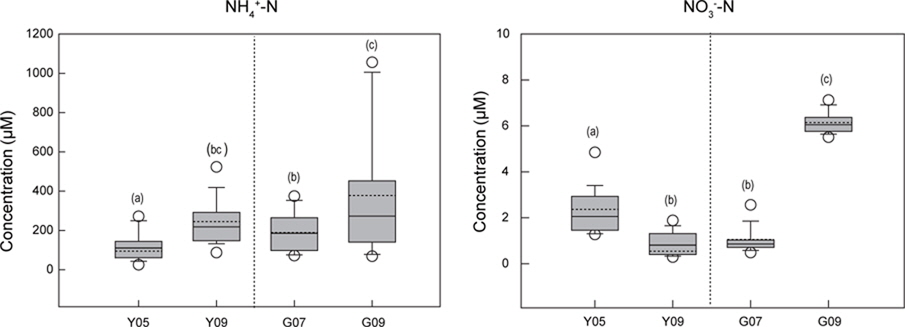
퇴적물내 박테리아는 공급된 유기물을 공극수에 들어있는 산화제(용존산소, 질산염, 황산염, 철-망간 산화물)를 이용하여 분해하고 이산화탄소, 암모니아, 황화수소, 인산염, 메탄 등을 만들어낸다. 이렇게 생성된 물질은 공극수에 남아 있어 퇴적물내에서 용존하는 화학성분의 분포와 퇴적물내 서식하는 저서미세조류나 저서동물의 분포에 매우 중요하게 작용한다(Kelderman, 1984; Hwang et al., 2008; Waska and Kim, 2011). 본 연구에서는 공극수내 질소성 영양염류의 분포를 조사하여 Fig. 4에 나타내었다.
공극수내 NH4+-N는 여자만에서 24.1-631 μM (평균 176 μM), 강진만에서 64.3-1101 μM (평균 278 μM)이었다. 여자만의 공극수내 NH4+-N는 5월(평균 111 μM)에 비해 9월(평균 242 μM)에 농도가 두 배 정도 증가하였고(
공극수중 NH4+-N 농도는 NO3--N농도보다 크게 높았으며, 여자만에서 24-781배(평균 246), 강진만에서 10-178배 (평균 153) 높은 수준을 보였다. NO3--N는 환원환경에서 유기물 분해과정에서 산소대신 산화제로 소비되어 감소하고 탈질산화에 의해 NH4+-N 농도를 증가시킨다. 반면, 퇴적물내 NH4+-N는 산화환경에서 산소를 소비하면서 질산화과정을 통해 감소하고 NO3--N 농도를 증가시킨다(Slomp and Cappellen, 2004; Giles et al., 2006). 따라서, 여자만과 강진만에서 NH4+-N의 높은 농도는 환원퇴적환경으로 NO3--N가 소비되어 NH4+-N가 크게 증가한 결과로 판단된다. 여자만과 강진만은 이미 언급한 것과 같이 매우 세립한 퇴적물을 가지고 있으며, 이것은 또한 표층퇴적물내 탈질산화율을 증가시키는 것으로 알려진다. Na and Lee (2005)는 강화도 갯벌에서 퇴적물의 입도가 세립할수록 퇴적물내 산소투과율이 낮아져 탈질산화율의 증가를 보고하였다. 본 연구에서 공극수내 NH4+-N는 퇴적물중 유기물 축적 지표(COD, AVS, IL, TOC, TN)와 양의 상관성을 보이고(
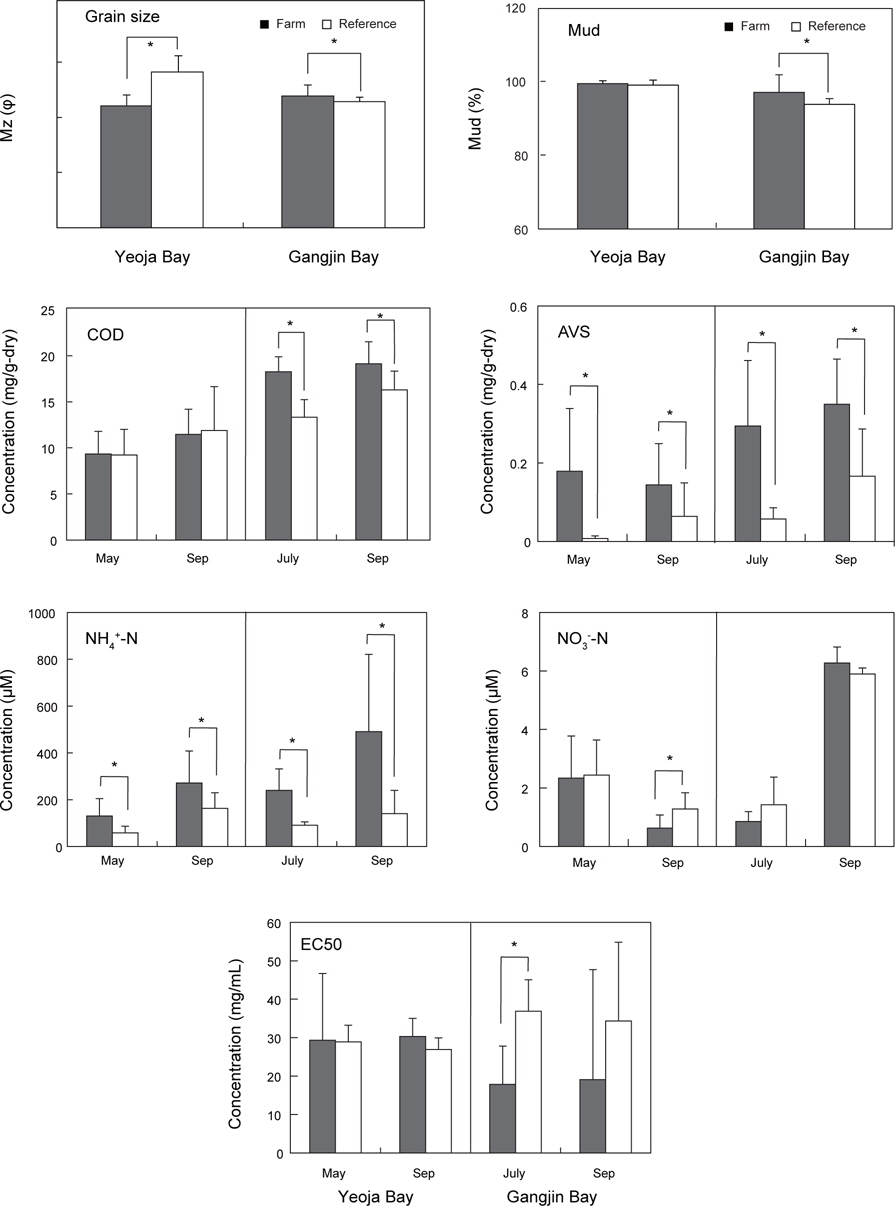
표층퇴적물내 유기물 축적이 생물에 미치는 영향을 평가하기 위해 퇴적물의 유기용매 추출액에 대한 발광미생물의 발광저해도를 조사하였다. 발광미생물에 대한 50% 영향농도 (effective concentration 50; EC50)는 여자만 10-85 mg/mL (평균 29 mg/mL), 강진만 0.7-70 mg/mL (평균 26 mg/mL)로 두 해역에서 유사한 수준의 독성도를 보였고, 월별로도 유사한 수준이었다(
퇴적물 독성도와 퇴적물내 유기물 축적 지표(COD, AVS, IL, TOC, TN), 공극수중 NH4+-N, NO3--N과의 상관계수를 Table 2에 나타내었다. 퇴적물 독성도(EC50)는 모든 성분들과 음의 상관성(
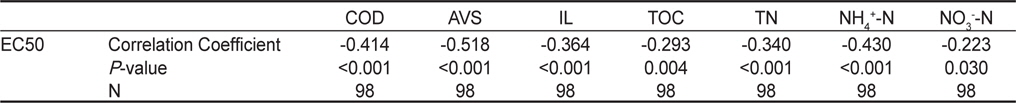
Correlation of EC50 with COD, IL, AVS, TOC, and TN in sediments, NH4+-N and NO3--N in pore water from Yeoja Bay and Gangjin Bay
여자만과 강진만내 패류양식해역과 비양식해역간 저서환경의 비교결과를 Fig. 5에 나타내었다. 여자만의 패류양식해역(Y1-Y21)과 비양식해역(Y22-Y29)에서 평균입도는 각각 8.42 Ø와 9.64 Ø로 비양식해역이 패류양식해역에 비해 더 세립한 퇴적물이었고(
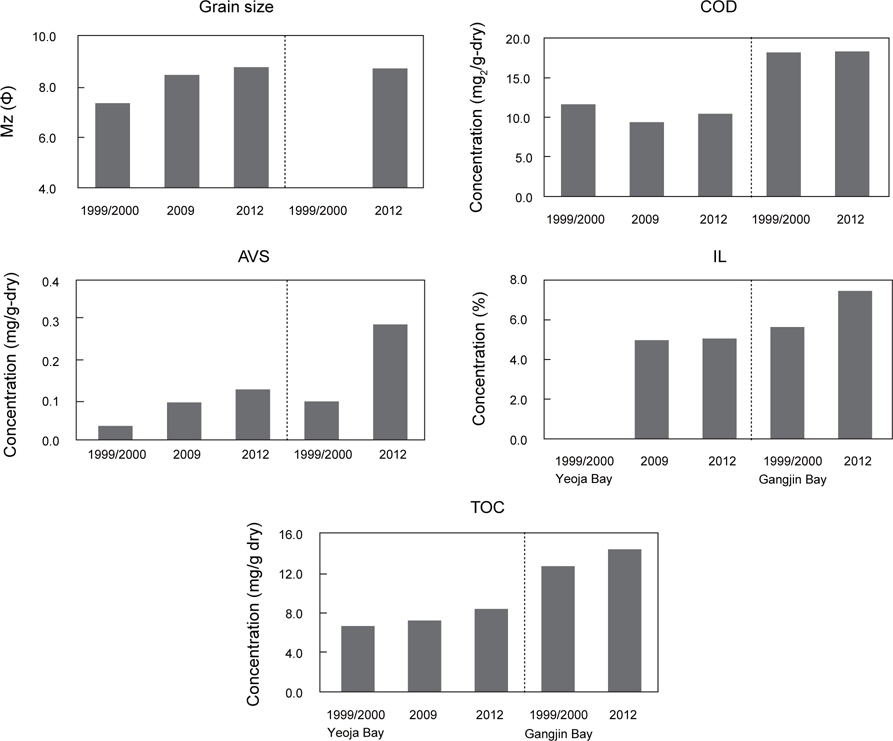
여자만과 강진만의 퇴적물 특성의 시간적 경향변화를 파악하기 위해 본 연구와 과거 조사자료(NFRDI, 2002; MIFAFF, 2009)와 비교한 결과를 Fig. 6에 나타내었다. 여자만에서 평균입도는 7.34 Ø (1999/2000년), 8.45 Ø (2009년), 8.75 Ø (2012년)로 증가하고 있었으며, 이는 여자만 퇴적물이 점점 세립화되고 있음를 의미한다. 여자만에서 퇴적물내 AVS도 0.04 mg/g-dry (1999/2000년), 0.09 mg/g-dry (2009년), 0.13 mg/g-dry (2012년)로 지속적으로 증가하였고, IL과 TOC도 유사한 경향을 보였다. 강진만의 경우, 1999/2000년 조사결과에 비해 2012년의 AVS, IL, TOC의 농도는 각각 200%, 32%, 14% 증가하였다. 따라서 2012년 여자만과 강진만 퇴적물내 유기물 함량이 점점 증가하고 있는 것으로 보인다. 이러한 결과는 연간 17,000톤의 담치(