검색 전체 메뉴
PDF
맨 위로
OA 학술지
기후변화에 따른 제주도 주변 해역 수산 어종 변화(1981-2010) Multi-decadal Changes in Fish Communities Jeju Island in Relation to Climate Change
  • 비영리 CC BY-NC
  • 비영리 CC BY-NC
ABSTRACT
기후변화에 따른 제주도 주변 해역 수산 어종 변화(1981-2010)

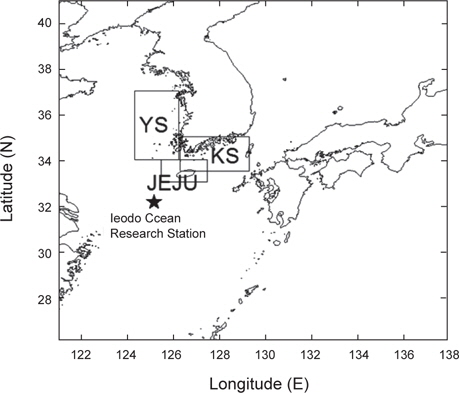
We compiled and analyzed long-term time-series data collected in Korea to evaluate changes in oceanographic conditions and marine ecosystems near Jeju Island (33°00'-34°00' N, 125°30'-127°30' E) from 1981 to 2010. Environmental data included depth-specific time series of temperature and salinity that have been measured bimonthly since 1961 in water columns at 175 fixed stations along 22 oceanographic lines in Korean waters by the National Fisheries Research & Development Institute, and time series of estimated volume transport of the Tsushima Warm Current (TWC) and Korea Strait Bottom Cold Water (KSBCW) for the period from 1961 to 2008. We analyzed the species composition in terms of biomass of fish species caught by Korean fishing vessels in the waters near Jeju Island (1981-2010). Data were summarized and related to environmental changes using canonical correspondence analysis (CCA). The CCA detected major shifts in fish community structure between 1982 and 1983 and between 1990 and 1992; the dominant species were a filefish during 1981-1992 and chub mackerel from 1992 to 2007. CCA suggested that water temperature and salinity in the mixed layer and the volume transport of the TWC and the KSBCW were significantly related to the long-term changes in the fish community in the waters off Jeju Island. Fish community shifts seemed to be related to the well-established 1989 regime shift in the North Pacific. Further studies are required to elucidate the mechanisms driving climate change effects on the thermal windows and habitat ranges of commercial species to develop fisheries management plans based on reliable projections of long-term changes in the oceanographic conditions in waters off Jeju Island

KEYWORD
Climate change , Jeju , Korea , File fish , Fish community
  • 서론

    우리나라가 속해있는 북서태평양(FAO Fishing Area 61)은 세계적으로 어획 생산고가 가장 높음은 물론 인구 밀도와 인구, 그리고 일인당 수산물 소비량도 세계에서 가장 높은 곳이다(Kim, 2010). 그러나 우리나라 연근해에서는 1970년대 이후 한국과 주변 국가들 어업기술 발전에 따라 남획이 진행중이고 산업화에 따라 수질이 악화되고 서식지가 파괴됨에 따라 전체 수산자원이 줄어들고 있는 것으로 일단 평가되고 있다(Kim et al., 2007; PICES, 2004). 그러나 북서태평양 어획고는 1990년대 들어 안정된 상태를 보여주는 반면 양식 생산은 크게 증가하고 있다(Kim, 2010; Kim et al., 2007). 어획과 함께 기후변화에 따른 생태계 변화로 수산업 부문에 많은 피해가 예상되며 수산물에 의존하는 우리나라 국민들 식생활 문화를 보았을 때 수산업 분야에 큰 피해가 예상된다. 기후변화는 일부 어종과 업종에는 긍정적인 영향을 줄 수도 있을 것으로 낙관할 수도 있으나 대부분 어종과 업종에서는 예측하여 대응하기 힘든 큰 변화를 수반할 것이기 때문에 수산 분야에서는 전반적으로 부정적인 영향을 많이 미칠 것으로 보인다(Brander, 2007; deYoung et al., 2008; Lehodey et al., 2006; Roessig et al., 2004).

    기후변화가 우리나라 수산업에 미치는 영향을 평가하고 전망하기 위해서는 기후 변화와 관련하여 1) 모니터링과 생태계 영향 평가, 2) 수산어종과 수산업 변화 예측과 전망, 3) 수산업 분야 취약성 평가와 적응 방안 마련의 순서로 관련 연구자들과 정부 정책 개발자들이 협력하여 로드맵을 만들고 적응 종합계획을 마련해왔다. 이 3가지 단계에서 우리나라 관련 연구 수준은 1번 모니터링과 과거 자료에 기반한 영향 평가는 어느 정도 이루어지고 있는 실정이나, 2번 예측과 전망, 3번 취약성 평가는 초보적인 수준에 머물고 있다. 따라서 앞으로는 예측과 전망에 기반한 취약성 평가에 집중적인 연구와 투자를 할 필요가 있다. 기후변화에 대비한 수산자원관리 방안 마련을 위해서 최근 해양 생태계의 상태와 기능을 대표할 수 있는 지표들이 개발되고 있는 중이며(Koo et al., 2005; Lee et al., 2008; Zhang et al., 2009), 이런 지표에 기반한 각 해역별, 업종별로 취약성을 평가할 필요가 있다 (Cochrane et al., 2009; Lehodey et al., 2006).

    기후연구는 주로 UNEP (United Nations Environment Programme) 와 WMO (World Meteorological Organization)가 공동한 설립한 IPCC (Intergovernmental Panel on Climate Change)가 중심이 되어 이루어지고 있다. IPCC는 각 국의 기후 연구 결과를 종합하여 인간의 활동이 기후 변화에 미치는 위험을 평가하고 있고, 2007년에 전 세계 2,00여명의 과학자 및 전문가가 참여해 제4차보고서(AR4)를 완성하였다(IPCC, 2007). 4차 평가보고서까지는 대부분 육상과 대기에 초점을 맞추고 지구 표면적의 2/3을 차지하고 지구 기후를 조절하는데 가장 중요한 해양을 본격적으로 다루지 않았지만, 기후 변화에서 해양의 중요성이 점점 강조되면서 5차 평가보고서에서는 해양을 본격적으로 다루고 있는 중이다.

    제주도 주변해역은 고등어와 갈치 등 대표적인 우리나라 수산업 어종이 가장 많이 어획되어왔던 곳이며, 기후변화에 가장 민감한 해역으로 알려져 있다. 또 이곳은 기후변화와 관련하여 우리나라 해양생태계에 가장 큰 영향을 미치는 해류인 쓰시마 난류가 본류인 쿠로시오 해류로부터 갈라져 대한해협으로 들어오는 길목이다(Kang et al., 2012). 따라서 이곳 생물종다양성과 생물상 변화는 제주도민은 물론 전 국민의 관심사이며, 기후변화에 따른 새로운 생물종 출현이나 서식지 이동, 산호의 확장 등은 레져(낚시)와 관광 분야 종사들도 큰 관심을 가지고 있다. 또 지역 언론은 물론 중앙 언론에서도 제주도 주변 해역 생태계 변화에 대해서 보도하고 싶어하나, 이에 대한 구체적인 정보를 제공할 수 있는 생태계 장기 모니터링 연구가 거의 전무한 실정이다. 따라서 이 연구에서는 지난 30년 동안 우리나라 정부와 연구기관에서 축적한 해양 모니터링 자료와 수산통계 자료를 분석하여 제주도 주변 해역에서 일어난 어류 군집 변화를 정리하고 이 변화가 기후변화에 따른 해양환경 변화와 어떤 관련을 보였는지를 보고한다.

    재료 및 방법

    기후 변화와 지구 온난화에 따른 제주 주변 해역 해양환경과 생태계 변동을 평가하기 위해 우리나라에서 과거 약 40년 동안 제주 주변해역(북위 33°00'~34°00', 동경 125°30'~127°30', Fig. 1)에서 수행해왔던 관련 모니터링 자료를 발굴 정리하여 분석하였다.

    해양 환경 자료로는 국립수산과학원에서 수행해오고 있는 격월 수심별 정선관측 자료(1962-2010)를 제주 주변해역, 황해, 대한해협, 3 해역으로 구분하여 정리하였으며 (Jung, 2008), 서울대 해양연구소에서 잠정 추정한 대한해협 수송량 자료(1968-2007)와 (Lyu and Kim, 2003) 대한해협저층냉수의 경년 변동지표 (1968-2007)를 (Na et al., 2010) 포함시켰다. 대한해협을 통과하는 해류는 관성 주기보다 긴 주기에서 지형류 평형 (geostrophic balance) 를 이루고 있기 때문에, 해협을 가로지르는 방향에서 보았을 때 해수면 높이 차(한국 부산과 일본 모지)는 대한해협 수송량과 선형상관 관계를 보이게 된다. 모지쪽 해수면이 부산쪽 해수면보다 상대적으로 높을 때 대한해협에서 동해로 유입되는 해류의 흐름이 강해지고, 반대의 경우 동해에서 대한해협을 통해 빠져 나가는 흐름이 강해지는 것이다. 따라서 해수면 높이 차와 대한해협 수송량 사이의 선형 관계식을 구할 수 있다. 대한해협 수송량 관측 자료가 1990년대 말부터 얻어진 반면, 해수면 높이는 1960년대부터 관측되어 왔기 때문에, 이 선형관계성을 이용하면 수송량을 1960년대부터 추정할 수 있게 된다. 이렇게 추정된 대한해협 월별 수송량을 쓰시마 난류의 월별 유입량으로 사용하였다. 대한해협저층냉수는 대한해협에서 관측되는 수온 10도 미만의 수괴를 가리키며, 1960년대부터 관측된 대한해협을 가로지르는 단면의 수온 자료를 이용하여 추정된 대한해협저층냉수 세력의 경년변동 지표를 계산하였다.

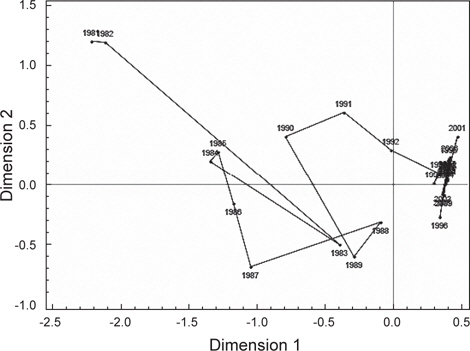
    제주 주변 해역 생태계 변동자료로는 국립수산과학원 어업대상 어종 어황자료(1981-2010)를 분석하였다. 어황자료에서는 표준화된 어획 노력량과 각 어종의 절대 생체량이나 생산량을 알기는 힘들지만, 각 어종별 어획량의 상대적인 비율 변화를 통해서 대상해역 어류 군집 종구성은 비교적 잘 나타내어 주므로 이 상대적인 비율을 가지고 어류 군집 변화를 대응분석(correspondence analysis)을 통해 분석하고 연도별로 요약하였다(Hwang and Jung, 2012). 정선관측 수온과 염분 자료에서 생태계 체제 변이를 감지하기 위해서 자기상관관계를 고려한 STARS (sequential t-test analysis of regime shift)를 적용하였다(Rodionov, 2006). 수산생물 군집 변동, 그리고 그 변동과 환경과의 관계는 정준대응분석(cannonical correspondence analysis)으로 요약하였다(ter Braak, 1986). 해역별 여러가지 환경 요인중에서 정준대응분석에서 95% 신뢰수준에서 상관관계가 유의하다고 나온 요인들만 골라서 STARS를 적용시키고 그림으로 나타내었다.

    결과 및 고찰

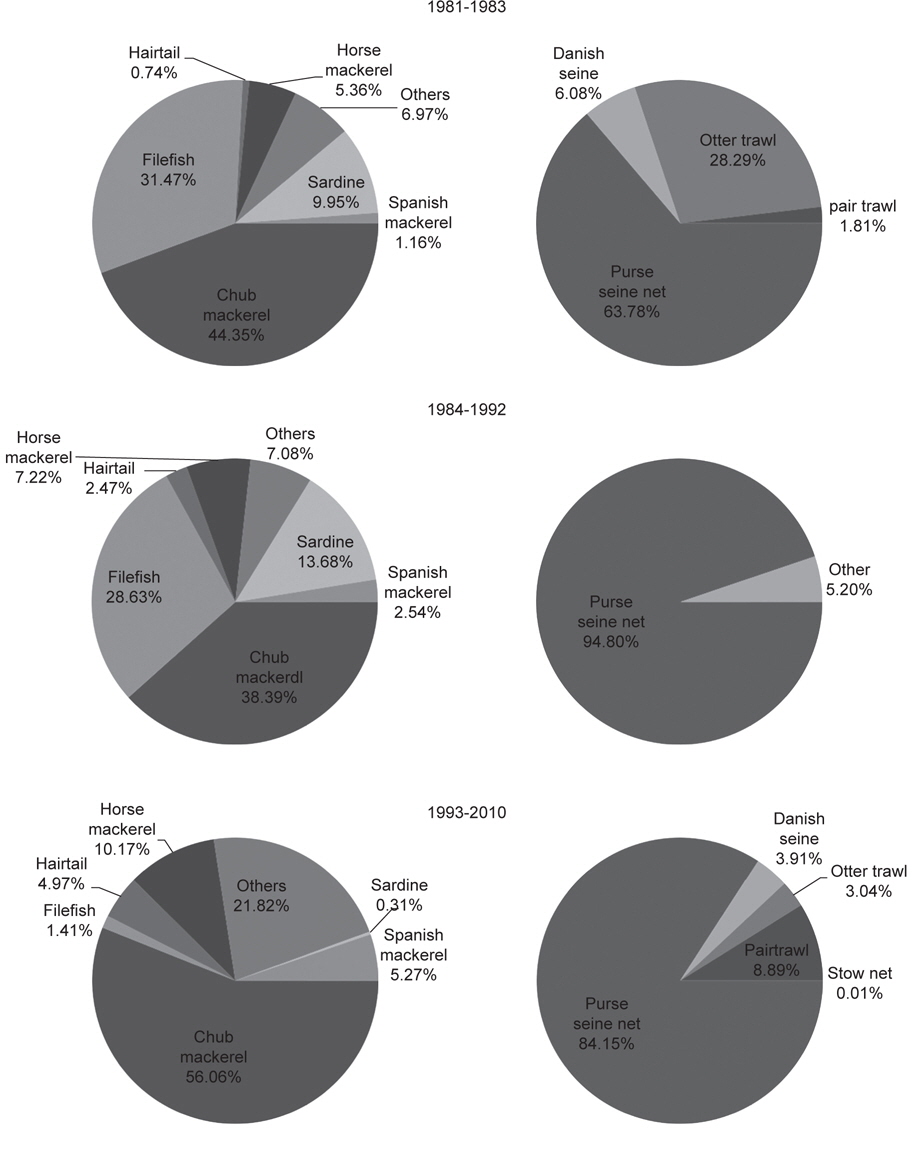
    대응분석은 제주 주변 해역 수산생물 군집이 1982-1983년과 1990-1993년 사이에 유의한 체제 변이를 겪었음을 보여주었다(Fig. 2). 우점종을 보면 1981-1992년은 말쥐치(Thamnaconus modestus), 고등어(Scomber japonicus), 참조기(Larimichthys polyactis) 정어리(Sardinops sagax) 순이었으나 1993-2007은 고등어, 갈치(Trichiurus lepturus), 참조기, 전갱이(Trachurus japonicus) 순으로 바뀌어, 1990년대 들어와서 말쥐치가 거의 사라진 것이 뚜렷한 특징이었다(Fig. 3). 단위노력당 어획량(CPUE)을 보면 고등어는 장기적으로 일정하였으나, 말쥐치가 1990년대 이후 크게 줄어들면서 최근에는 우점종을 유지하고 있다. 갈치, 살오징어(Todarodes pacificus), 방어(Seriola quinqueradiata)는 장기적으로 CPUE가 증가하고 있으나, 말쥐치, 꽃게(Portunus trituberculatus), 참조기, 정어리, 삼치(Scomberomorus niphonius) 등은 감소하고 있는 추세로 나타났다. 주요 어종별 어업 구성을 보면, 고등어는 전량 대형선망어업이 차지했고, 말쥐치는 대형선망어업이 75.1%, 대형트롤어업이 21.1를 차지했으며, 갈치는 대형선망어업이 56.2%, 중형쌍끌이어업이 31.3%, 대형트롤어업이 11.4%를 차지했다. 그 밖에 정어리와 삼치는 99% 이상이 대형선망으로 잡혔다.

    어업별 어획량을 전체적으로 보면 대형선망어업(purse seine net)이 대부분 어획량을 차지했으나 말쥐치를 주로 잡았던 대형 트롤어업(otter trawl)이 1984년 많은 감소를 보인 것이 특징이었다(Fig. 3, 오른쪽). 이는 제주도 주변 해역 어류 군집 변화에서 가장 큰 변화는 1990년 이후 말쥐치가 크게 줄어들면서 이를 주요 어획대상어종으로 삼았던 대형트롤어업이 제주도 주변해역에서 거의 사라진 점이다.

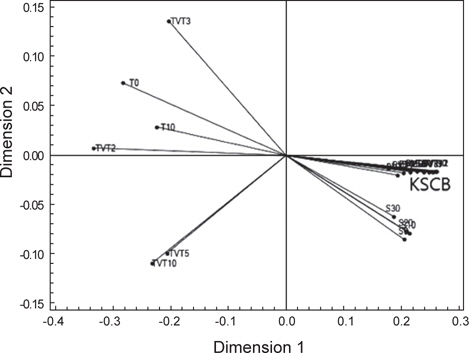
    이런 제주 주변 해역 수산 대상 어종 종구성 변화에 어떤 해양환경 요인이 영향을 미쳤는지 평가하기 위해 해역별 (동지나해, 대한해협, 황해) 수온과 염분, 그리고 대한해협 쓰시마 난류와 저층 냉수 월별 수송량과 종구성 변화의 상관관계를 정준대응분석으로 분석하였는데, 먼저 대한해협 환경 요인에 대한 정준대응분석 결과는 Fig. 4와 같다. 대한해협 수온의 경우 0-10 m, 염분의 경우 0-30 m에서 제주주변 해역 수산생물 종구성과 유의한 상관관계를 보여, 저층보다는 표층 환경 요인이 수산생물 변화에 더 중요함을 알 수 있었다. 쓰시마 난류의 영향도 받는 것으로 나타났는데 2, 3, 5, 10월 유입량과 유의한 상관관계를 보였다. 또 동해 저층에서 대한해협으로 유입되는 저층 냉수 유입량은 모든 달에 걸쳐서 유의한 상관관계를 보였는데, 이는 본 연구에서 사용한 저층 냉수 유입량 지표가 경년변동성을 대표하는 모드에서 계산되었기 때문에 연변동은 상대적으로 크게 나타내주나 월변동은 잘 나타내지 못하고 희석시켰기 때문으로 본다 (Na et al., 2010). 앞으로 좀더 정교한 해수순환모델을 통해서 추가적인 저층 냉수 유입량 복원 연구가 필요하다.

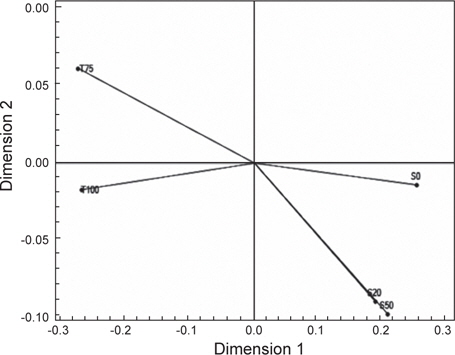
    동중국해의 수심별 수온과 염분을 가지고 똑 같은 방법으로 분석한 정준대응분석 결과는 Fig. 5와 같다. 이 경우 수온은 75-100 m와 염분은 0-50 m까지 제주 주변 해역 수산생물 종구성과 유의한 상관관계를 보였는데, 이는 염분 자체의 영향이라기 보다는 염분이 서로 다른 수괴가 섞이는 지표, 다른 말로는 쓰시마 난류나 황해에서 내려오는 수괴의 변화를 나타내는 지표이기 때문에 나타나는 현상으로 보인다.

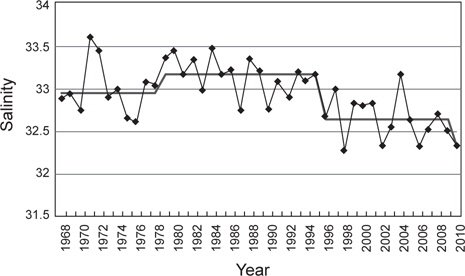
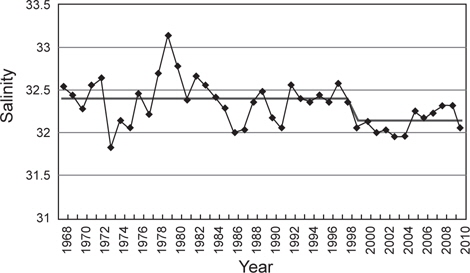
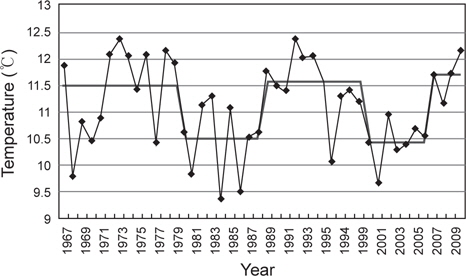
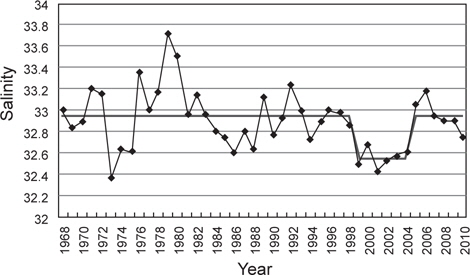
    제주 주변 해역 수산생물 군집이 1990-1993년 사이에 유의한 체제 변이를 겪었음을 보여주었으므로(Fig. 2), 이에 대응하는 환경 요인이 어떤지를 해역별 수온과 염분, 그리고 대한해협을 흐르는 쓰시마 난류와 저층냉수의 월별 유입량과 비교해보았다. 먼저 제주 주변 수산생물에 직접적인 영향을 미칠 것으로 보이는 같은 해역(Fig. 1, JEJU) 수온과 염분은 1990-1993이나 그 이전 2-3년 동안에는 유의한 변화가 감지되지 않았다(Figs. 6 and 7).

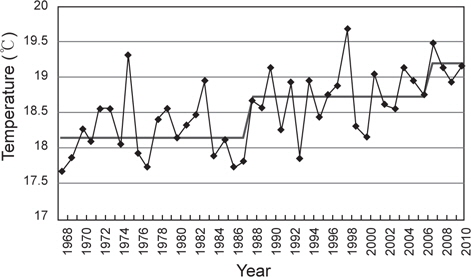
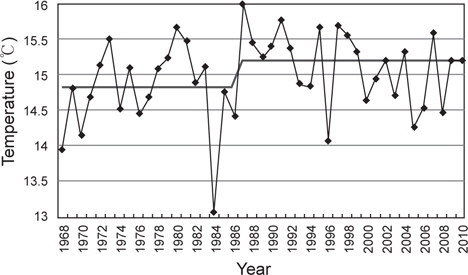
    10 m, 그리고 75 m 수심에서 1989년 유의한 변화가 감지되었으나(Figs 9 and 10), 20-50 m 수심에서는 1989년에 유의한 변화가 감지되지 않았다.

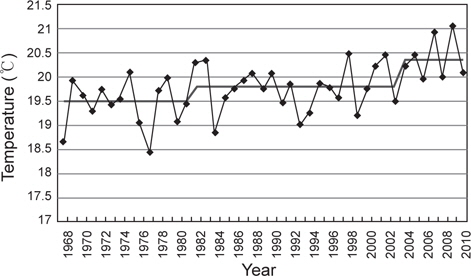
    대한해협 수온의 경우 0-75 m에서 1987년 또는 1988년에 유의한 변화가 감지되었으나(Figs. 10 and 11) 100 m에서는 감지되지 않았다.

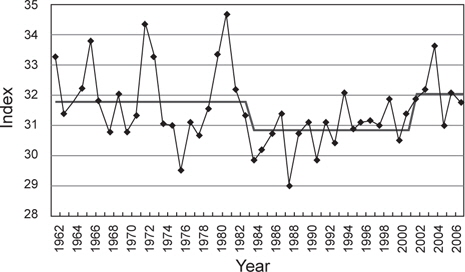
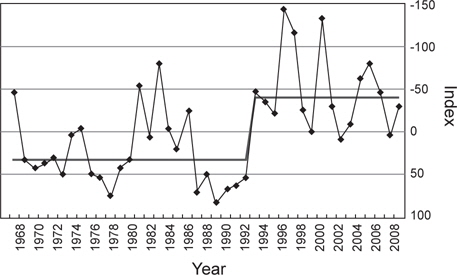
    대한해협을 통과하는 쓰시마 난류 유입량 연평균은 1984년과 2002년에 유의한 변이가 일어난 것으로 나타나, 역시 1989년에 대응하는 변이는 감지되지 않았다(Fig. 13). 반대로 동해에서 대한해협으로 들어오는 대한해협 저층냉수 유입량은 1993년 이후 크게 증가한 것으로 나타났다(Fig. 14).

    정준대응분석과 STARS 분석 결과를 정리해보면, 제주 주변해역 수산생물 군집 변동에는 제주 주변 동지나해, 대한해협, 황해 상층부(0-50 m) 수온과 염분 변화가 유의한 상관관계를 보였으며, 특히 대한해협 표층(0-10 m) 수온과 대한해협 저층수 유입량 변화가 중요한 것으로 나타났다. 해양환경에서는 1989년 생태계 체제 변이가 가장 뚜렷하게 나타났는데 이는 지난 20년 동안 이루어진 많은 북태평양 생태계 체제 변이 연구 결과와 잘 일치한다(Chiba and Saino, 2002; Kang et al., 2012; Rebstock and Kang, 2003; Tian et al., 2008; Zhang et al., 2004). 제주도 주변 어류 군집은 1989년 변화에 즉각적으로 반응하지 않고 2-4년의 시간 지연을 두고 반응한 것으로 보이는데, 이는 대상 해역 주요 어종들이 이런 생태계 변화에 가장 민감한 시기는 난자치어 시기이므로 이들이 가입되어 어획대상으로 자라는 데 걸리는 2-4 년의 기간을 반영한 것으로 짐작할 수 있다(Houde, 1987). 또 1989년 체제 변이와 대한해협 저층 냉수 유입량 변화 사이에도 3-4년의 시간 지연이 나타났는데 이 부분은 앞으로 기상학과 해양물리학 분야 연구자들이 공동으로 검토하여 연구해 볼 수 있을 것으로 본다.

    이번 연구에서 나타난 제주도 주변 해역 어류 군집의 가장 큰 변화는 1990년 이후 말쥐치가 제주도 주변 해역을 비롯한 우리나라 연근해에서 거의 사라지게 된 점이다. 말쥐치 어획량이 크게 준 이유는 관련 연구가 부족하여 알기 힘드나, 국내 일부 수산학자들은 남획을 그 중요 또는 부분적인 원인으로 꼽아왔다(Kim et al., 2007). 어종의 가입이나 어류 군집 구조 변화에 대해서는 남획과 함께 기후와 같은 환경 변화가 중요할 수도 있으나, 이 ‘남획’ 가설과 ‘기후’ 가설 효과를 구분해내는 것은 대단히 어려운 일이다(Lehodey et al., 2006; Murawski, 2000; Rose, 2004). 그러나, 남획 때문에 말쥐치 가입이 줄어들었다는 것을 정량적으로 분석한 관련 연구 논문은 거의 전무하여 이런 남획 가설을 지금 직접 검정할 수는 없다. 한편, 말쥐치에 대한 어획강도가 우리나라와 비교했을 때 그렇게 높지 않다고 볼 수 있는 일본 태평양 연안쪽인 도쿄만에서도 본 연구와 비슷하게 1979-1988년에는 말쥐치가 우점하였으나, 1989년 이후 거의 사라졌다고 보고되었다(Kodama et al., 2010). 일본에서도 말쥐치가 어획되어왔으나 통계보고체계가 잡힌 것은 1995년 이후로 보인다(일본 서해구수산연구소, 2010 년도 말쥐치 동해·동중국계군 자원평가, http://abchan.job.affrc.go.jp/digests22/details/2267.pdf). 세계식량기구(FAO) 어획량 통계를 보면, 대부분이 말쥐치일 것으로 보이는 쥐치과(Monacanthidae) 어획량은 우리나라와 중국이 대부분을 차지하고 대만에서 소량을 보고해오고 있는데, 우리나라에서는 1990 년 이후 쥐치과 어획고가 크게 감소하였으나, 중국에서는 1984-1991년 기간에서는 30만 톤 수준을 보이다가 1992-1995년 사이에 10만 톤 수준까지 큰 폭으로 줄었다가 다시 1996년 이후로는 약 20 만 톤 내외의 어획고를 유지하고 있다(http://www.fao.org/fishery/statistics/en). 즉, 제주도 주변해역과는 달리 남중국해와 동중국해에서는 중국 어선에 의한 말쥐치 어획이 1990년대 이후에도 활발히 지속되고 있는 것으로 보인다. 만약 우리나라 주변해역에서 말쥐치 어획고가 줄어든 중요한 이유가 남획 때문이었다고 한다면 1990년대 이후 중국측 말쥐치 어획고도 크게 줄어 들었을 것이고, 남획이 일어났다고 보기 힘든 일본 도쿄만에서는 적어도 말쥐치가 1990년 이전 수준은 유지하고 있어야 할 것이다. 그러나 우리가 보아온 현상은 이런 남획 가설에 따른 기대와는 정반대이다. 즉, 중국측 말쥐치 FAO 어획고 통계자료를 보면 1990년대 이후 이전에 비교해서 약간 줄어들었지만 여전히 지속적인 어업이 이루어지고 있으며, 오히려 어업강도가 훨씬 낮을 것으로 보는 일본 도쿄만에서는 제주 주변해역과 똑 같이 1990년대 이후 말쥐치가 거의 사라졌다. 남중국해, 동중국해, 대한해협, 동해, 류큐 열도에서 혹카이도까지 일본 연안을 따라 분포하는 것을 감안한다면 1990 년 이후 우리나라와 일본연안에서 말쥐치가 크게 줄어든 것은 한 때 동해 북쪽(Beamish et al., 1999; Epur, 2009)까지 이르렀던 그 분포범위가 1990년대 이후 남쪽으로 수축되었음을 시사하고 있다. 기후 변화에 따른 말쥐치 분포 범위 수축과 확장은 앞으로 더 많은 연구가 필요할 것으로 보인다(Maekawa, 1989). 특히 쓰시마 난류 변동이나 대한해협 저층 냉수의 확장 수축(Kim et al., 2006)과 관련하여 말쥐치를 비롯한 주요 수산어종의 생태와 가입, 그리고 그 분포 변화 메커니즘을 밝히는 데는 해양물리학자들과 수산학자들 사이에 학제간 협동 연구가 필수적이다.

    이번 연구 결과 대한해협 저층냉수 유입량과 쓰시마 난류 변동이 제주 주변해역 생태계에 가장 중요한 환경 요인임을 시사하고 있어, 앞으로 일반해수순환 모델을 활용하여 지난 40년 동안 대한해협 저층냉수 유입량과 쓰시마 난류 변동과 그 유입량 시계열 자료를 복원하는 것이 이 해역 생태계 변화 메커니즘을 밝히는 첫 단계임을 보여주고 있다. 따라서 이어도 해양과학기지를 활용하여 제주도 주변 해역을 포함하는 동중국해와 대한 해협 해양 생태계 장기 모니터링은 과거 기후변화가 우리나라 해양에 미쳤던 영향을 진단 평가하고 또 앞으로 미칠 영향을 전망하는데 시금석이 될 것으로 보인다(Hwang and Jung, 2012). 또 제주 해안지역 해양생태계가 제주 연근해 주요 상업 어종의 산란장이나 성육장으로 어떤 역할을 하는지 정량적인 평가가 필요하며, 이를 위해서는 제주도 해안 해역을 망라하는 장기적이고 지속적인 난자치어 조사와 정치망 모니터링도 필요하다. 특히 제주도 연안어업은 기후변화에 따른 대상 어종 잠재어획량 분포 변화에 빨리 적응하기 힘들므로 경쟁에서 기업형 근해 어업에 밀릴 것으로 전망한다(Roessig et al., 2004). 따라서 관련 정부 부처와 제주특별자치도에서 할 수 있는 사회 경제적 대처 방안도 함께 개발될 필요가 있다.

참고문헌
  • 1. Beamish RJ, Leask KD, Ivanov OA, Balanov AA, Orlov AM, Sinclair B 1999 The ecology, distribution, and abundance of midwater fishes of the Subarctic Pacific gyres [Prog Oceanogr] Vol.43 P.399-442 google cross ref
  • 2. Brander KM 2007 Global fish production and climate change [Proceedings of the National Academy of Sciences] Vol.104 P.19709-19714 google cross ref
  • 3. Chiba S, Saino T 2002 Interdecadal change in the upper water column environment and spring diatom community structure in the Japan Sea: an early summer hypothesis [Mar Ecol Prog Ser] Vol.231 P.23-35 google cross ref
  • 4. Cochrane K, De Young C, Soto D, Bahri T 2009 FAO Fisheries and Aquaculture Technical Paper P.212 google
  • 5. deYoung B, Barange M, Beaugrand G, Harris R, Perry RI, Scheffer M, Werner F 2008 Regime shifts in marine ecosystems: detection, prediction and management [Trends Ecol Evol] Vol.23 P.402-409 google cross ref
  • 6. Epur IV 2009 Ecological and zoogeographic characterization of the ichthyofauna of Sivuch'ya Bay (Peter the Great Bay, Sea of Japan) [Russian Journal of Marine Biology] Vol.35 P.117-126 google cross ref
  • 7. Hwang K, Jung S 2012 Decadal Changes in Fish Assemblages in Waters near the Ieodo Ocean Research Station (East China Sea) in Relation to Climate Change from 1984 to 2010 [Ocean Science Journal] Vol.47 P.83-94 google cross ref
  • 8. 2007 Climate change 2007. The physical science basis. Summary for policymakers. Contribution of working group to the fourth assessment report of the intergovernmental panel on climate change P.18 google
  • 9. Jung S 2008 Spatial variability in long-term changes of climate and oceanographic conditions in Korea [J Environ Biol] Vol.29 P.519-529 google
  • 10. Kang YS, Jung S, Zuenko Y, Choi I, Dolganova N 2012 Regional differences in response of mesozooplankton to long-term oceanographic changes (regime shifts) in the northeastern Asian marginal seas [Prog Oceanogr] Vol.97-100C P.120-134 google
  • 11. Kim S 2010 Fisheries development in northeastern Asia in conjunction with changes in climate and social systems [Mar Policy] Vol.34 P.803-809 google cross ref
  • 12. Kim S, Zhang CI, Kim JY, Oh JH, Kang S, Lee JB 2007 Climate Variability and Its Effects on Major Fisheries in Korea [Ocean Science Journal] Vol.42 P.179-192 google cross ref
  • 13. Kim YH, Kim YB, Kim K, Chang KI, Lyu SJ, Cho YK, Teague WJ 2006 Seasonal variation of the Korea Strait Bottom Cold Water and its relation to the bottom current [Geophys Res Lett] Vol.33 google
  • 14. Kodama K, Oyama M, Lee J, Kume G, Yamaguchi A, Shibata Y, Shiraishi H, Morita M, Shimizu M, Horiguchi T 2010 Drastic and synchronous changes in megabenthic community structure concurrent with environmental variations in a eutrophic coastal bay [Prog Oceanogr] Vol.87 P.157-167 google cross ref
  • 15. Koo BJ, Kwon KK, Hyun JH 2005 The Sediment-Water Interface Increment due to the Complex Burrows of Macrofauna in a Tidal Flat [Ocean Science Journal] Vol.40 P.221-227 google cross ref
  • 16. Lee DI, Choi JM, Lee YG, Lee MO, Lee WC, Kim JK 2008 Coastal environmental assessment and management by ecological simulation in Yeoja Bay, Korea [Estuar Coast Shelf Sci] Vol.80 P.495-508 google cross ref
  • 17. Lehodey P, Alheit J, Barange M, Baumgartner T, Beaugrand G, Drinkwater K, Fromentin JM, Hare SR, Ottersen G, Perry RI, Roy C, van der, Lingen CD, Werner F 2006 Climate variability, fish, and fisheries [J Clim] Vol.19 P.5009-5030 google cross ref
  • 18. Lyu SJ, Kim K 2003 Absolute transport from the sea level difference across the Korea Strait [Geophys Res Lett] Vol.30 P.1285 google cross ref
  • 19. Maekawa C 1989 Relationship between water temperature and catch quantity of filefish Thamnaconus modestus (in Japanese) [Bulletin of the Kanagawa Prefectural Fisheries Experiment Station] Vol.89 P.27-30 google
  • 20. Murawski SA 2000 Definitions of overfishing from an ecosystem perspective [ICES Journal of Marine Science: Journal du Conseil] Vol.57 P.649-658 google cross ref
  • 21. Na H 2011 Seasonal to decadal variability of the upper-ocean hydrography and circulation in the East Sea. School of earth and environmental sciences. Ph.D. Thesis P.115 google
  • 22. Na H, Kim K-Y, Chang K-I, Kim K, Yun J-Y, Minobe S 2010 Interannual variability of the Korea Strait Bottom Cold Water and its relationship with the upper water temperatures and atmospheric forcing in the Sea of Japan (East Sea) [Journal of Geophysical Research: Oceans] Vol.115 P.C09031 google
  • 23. 2004 Marine ecosystems of the North Pacific P.280 google
  • 24. Rebstock GA, Kang YS 2003 A comparison of three marine ecosystems surrounding the Korean peninsula: responses to climate change [Prog Oceanogr] Vol.59 P.357-379 google cross ref
  • 25. Rodionov SN 2006 Use of prewhitening in climate regime shift detection [Geophys Res Lett] Vol.33 P.L12707 google cross ref
  • 26. Roessig JM, Woodley CM, Cech JJ, Hansen LJ 2004 Effects of global climate change on marine and estuarine fishes and fisheries [Rev Fish Biol Fish] Vol.14 P.251-275 google cross ref
  • 27. Rose GA 2004 Reconciling overfishing and climate change with stock dynamics of Atlantic cod (Gadus morhua) over 500 years [Can J Fish Aquat Sci] Vol.61 P.1553-1557 google cross ref
  • 28. ter Braak CJF 1986 Canonical correspondence analysis: A new eigenvector technique for multivariate direct gradient analysis [Ecology] Vol.67 P.1167-1179 google cross ref
  • 29. Tian Y, Kidokoro H, Watanabe T, Iguchi N 2008 The late 1980s regime shift in the ecosystem of Tsushima warm current in the Japan/East Sea: evidence from historical data and possible mechanisms [Prog Oceanogr] Vol.77 P.127-145 google cross ref
  • 30. Zhang CI, Kim S, Gunderson D, Marasco R, Lee JB, Park HW, Lee JH 2009 An ecosystem-based fisheries assessment approach for Korean fisheries [Fish Res] Vol.100 P.26-41 google cross ref
  • 31. Zhang CI, Lee JB, Seo YI, Yoon SC, Kim S 2004 Variations in the abundance of fisheries resources and ecosystem structure in the Japan/East Sea [Prog Oceanogr] Vol.61 P.245-265 google cross ref
이미지 / 테이블
  • [ Fig. 1. ]  The study area (JEJU), waters off Jeju Island, Korea (33°00'~34°00' N, 125°30'~127°30' E), and its adjacent seas: YS: Yellow Sea, KS: Korea Strait. Ieodo Ocean Research Station is also marked with the star symbol.
    The study area (JEJU), waters off Jeju Island, Korea (33°00'~34°00' N, 125°30'~127°30' E), and its adjacent seas: YS: Yellow Sea, KS: Korea Strait. Ieodo Ocean Research Station is also marked with the star symbol.
  • [ Fig. 2. ]  Annual variation of the two major components extracted from correspondence analysis of biomass-weighted species composition in fishery catch from waters off Jeju Island, Korea, from 1981 to 2010. Column variable was year and row variable was fish species. Points of fish species are not shown.
    Annual variation of the two major components extracted from correspondence analysis of biomass-weighted species composition in fishery catch from waters off Jeju Island, Korea, from 1981 to 2010. Column variable was year and row variable was fish species. Points of fish species are not shown.
  • [ Fig. 3. ]  Changes of biomass composition of fi shery catch from waters off Jeju Island, Korea, by period from 1981 to 2010, by species (left) and by fi shery type (right).
    Changes of biomass composition of fi shery catch from waters off Jeju Island, Korea, by period from 1981 to 2010, by species (left) and by fi shery type (right).
  • [ Fig. 4. ]  Canonical correspondence analysis on fish species composition in biomass in waters off Jeju Island and oceanographic variables in the Korea Strait (this figure can be overlapped with Fig. 2). T and S denote water temperature and salinity, respectively, and the suffix number denotes water depth (m); TVT and KSCB denote monthly volume transport of Tsushima warm current and the Korea Strait Cold Bottom Water, respectively, and the suffix number denotes month (1-12). The oceanographic variables that were not significantly correlated at 5% significance level are omitted.
    Canonical correspondence analysis on fish species composition in biomass in waters off Jeju Island and oceanographic variables in the Korea Strait (this figure can be overlapped with Fig. 2). T and S denote water temperature and salinity, respectively, and the suffix number denotes water depth (m); TVT and KSCB denote monthly volume transport of Tsushima warm current and the Korea Strait Cold Bottom Water, respectively, and the suffix number denotes month (1-12). The oceanographic variables that were not significantly correlated at 5% significance level are omitted.
  • [ Fig. 5. ]  Canonical correspondence analysis on fish species composition in biomass in waters off Jeju Island and oceanographic variables in the East China Sea (this figure can be overlapped with Fig. 2). T and S denote water temperature and salinity, respectively, and the suffix number denotes water depth (m). The oceanographic variables that were not significantly correlated at 5% significance level are omitted.
    Canonical correspondence analysis on fish species composition in biomass in waters off Jeju Island and oceanographic variables in the East China Sea (this figure can be overlapped with Fig. 2). T and S denote water temperature and salinity, respectively, and the suffix number denotes water depth (m). The oceanographic variables that were not significantly correlated at 5% significance level are omitted.
  • [ Fig. 6. ]  Annually-averaged sea surface temperature in the waters off Jeju Island, Korea, from 1968 to 2010. The step changes detected by STARS were overlaid with the solid bold line.
    Annually-averaged sea surface temperature in the waters off Jeju Island, Korea, from 1968 to 2010. The step changes detected by STARS were overlaid with the solid bold line.
  • [ Fig. 7. ]  Annually-averaged sea surface salinity in the waters off Jeju Island, Korea, from 1968 to 2010. The step changes detected by STARS were overlaid with the solid bold line.
    Annually-averaged sea surface salinity in the waters off Jeju Island, Korea, from 1968 to 2010. The step changes detected by STARS were overlaid with the solid bold line.
  • [ Fig. 8. ]  Annually-averaged water temperature at 30-m depth in the Yellow Sea from 1968 to 2010. The step changes detected by STARS were overlaid with the solid bold line.
    Annually-averaged water temperature at 30-m depth in the Yellow Sea from 1968 to 2010. The step changes detected by STARS were overlaid with the solid bold line.
  • [ Fig. 9. ]  Annually-averaged salinity at 10-m depth in the Yellow Sea from 1968 to 2010. The step changes detected by STARS were overlaid with the solid bold line.
    Annually-averaged salinity at 10-m depth in the Yellow Sea from 1968 to 2010. The step changes detected by STARS were overlaid with the solid bold line.
  • [ Fig. 10. ]  Annually-averaged salinity at 75-m depth in the Yellow Sea from 1968 to 2010. The step changes detected by STARS were overlaid with the solid bold line.
    Annually-averaged salinity at 75-m depth in the Yellow Sea from 1968 to 2010. The step changes detected by STARS were overlaid with the solid bold line.
  • [ Fig. 11. ]  Annually-averaged temperature at 0-m depth in the Korea Strait from 1968 to 2010. The step changes detected by STARS were overlaid with the solid bold line.
    Annually-averaged temperature at 0-m depth in the Korea Strait from 1968 to 2010. The step changes detected by STARS were overlaid with the solid bold line.
  • [ Fig. 12. ]  Annually-averaged temperature at 75-m depth in the Korea Strait from 1968 to 2010. The step changes detected by STARS were overlaid with the solid bold line.
    Annually-averaged temperature at 75-m depth in the Korea Strait from 1968 to 2010. The step changes detected by STARS were overlaid with the solid bold line.
  • [ Fig. 13. ]  Annual volume transport in the Korea Strait (an index of the strength of the Tsushima Warm Current), estimated by sea-level difference along the Busan-Moji line in the Korea Strait, from 1962 to 2007 (Na, 2011)
    Annual volume transport in the Korea Strait (an index of the strength of the Tsushima Warm Current), estimated by sea-level difference along the Busan-Moji line in the Korea Strait, from 1962 to 2007 (Na, 2011)
  • [ Fig. 14. ]  Annual index of the Korea Strait Bottom Cold Water, estimated by temperature section along the Busan-Moji line in the Korea Strait from 1968 to 2008 (Na et al. 2010).
    Annual index of the Korea Strait Bottom Cold Water, estimated by temperature section along the Busan-Moji line in the Korea Strait from 1968 to 2008 (Na et al. 2010).
(우)06579 서울시 서초구 반포대로 201(반포동)
Tel. 02-537-6389 | Fax. 02-590-0571 | 문의 : oak2014@korea.kr
Copyright(c) National Library of Korea. All rights reserved.