In recent years, CCD is commonly used for photometric observation. A photomultiplier tube, which was used for photoelectric photometry, consists of a single pixel that detects light, while CCD consists of a number of pixels that have a two-dimensional arrangement. To use CCD images for research purposes, it is important to remove unwanted signals and noises that are included in each image. A telescope, a CCD chip, and a filter can let incident light pass through, but also can block the incident light. The factors affecting this action include the dust and fingerprints on the path of the light and the accompanying shadows. Also, the pixels of a CCD chip respond differently to incident light, which could induce the inhomogeneity of an observation image. Therefore, these unwanted phenomena on a CCD observation image should be corrected.
The most efficient method for correcting these phenomena is to use flat images. One of these methods is to install a screen within the dome, and to distribute a specific wavelength of light evenly on a CCD surface. However, the screen installed within the dome could be inhomogeneous, and it is very difficult to distribute light evenly on a CCD surface. Thus, an observer corrects an image by observing the sky where light is evenly shone, such as the twilight sky.
Emerson & Little (1999) proposed a flat image observation method that can be used at any time (i.e., day time and night time) for the convenience of AAVSO CCD users. They mentioned that a good flat image could be obtained using a diffusing screen that consists of simple white plexiglass, not only in the twilight environment but also in an observatory equipped with an illumination screen. In addition, the factors that deteriorate the precision of photometry (e.g., vignetting, spatial sensitivity variations, interference fringes, and charge traps) could be removed using the hybrid flat fielding method (Pedersen 1987).
Zhou et al. (2004) suggested that the status of the night sky on the day of observation determines the flatness of a CCD image, as the result of the two-dimensional variation of CCD quantum efficiency and optical transfer efficiency, and pointed out that the correction of flatness should be performed. They also reported that a good flat field image could be easily and effectively obtained by installing an isotropic diffuser in front of the Schmidt corrector plate, for the color survey of the Schmidt telescope. Boyle (2007) pointed out that an accurate flat field calibration is very important for CCD stellar photometry, and proposed a flat image correction method which can eliminate linear and nonlinear effects by reshaping an initial flat image after performing the differential photometry of a well-populated star field by varying the exposure time.
Chromey (1996) pointed out that the image of stars could be included in a sky brightness image because CCDs are too sensitive and record the image of stars even in the twilight sky. This problem could be improved by observing a lot of flat images at various filter bands. However, in many cases, it is difficult to reach the twilight brightness needed for the best correction. To resolve this issue is the starting point of the present study.
In the twilight flat method, the start time for observing the twilight flat image changes because the sunset and sunrise times vary depending on season, and the time for obtaining flat images is limited because the twilight time is very short. Thus, an observer has to judge the start time and the exposure time for each filter, within a short observation time. From this practical standpoint, a program was developed in this study, which can supplement the entire process of acquiring the twilight flat images that has been conducted by the judgment of an observer, and which can obtain stable twilight flats regardless of the change in season.
In this paper, the program for the automated acquisition of twilight flat images in the automated observation system at the Jincheon Station of the Chungbuk National University Observatory was introduced, and the results of the test observation using the automated observation program were presented. Also, the results of the observations using a 1.5 K × 1 K CCD camera and a 4 K × 4 K CCD camera were compared. In the concluding remarks, the applicability of the program developed in this study was described.
2. DEVELOPMENT OF AN AUTOFLAT OBSERVATION PROGRAM
2.1 Determination of the exposure time
The observation equipment used in this study includes a wide field telescope with a 0.6 m aperture installed at the Jincheon Station of the Chungbuk National University Observatory, ST-8 CCD, 4K × 4K CCD, and
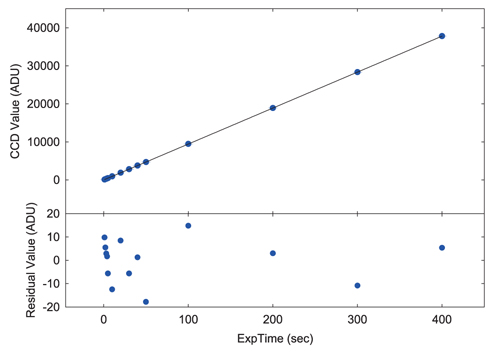
To use CCD images for photometry, a precision of at least 1% (0.01 magnitudes) is required (Buil 1991). Also, there is a specific range in which CCD pixels have a linear relation proportional to the detected photons for a given exposure time. Thus, for the flat observation, each pixel is exposed to a light source with a uniform brightness, and values within the linear range of CCD pixels are obtained.
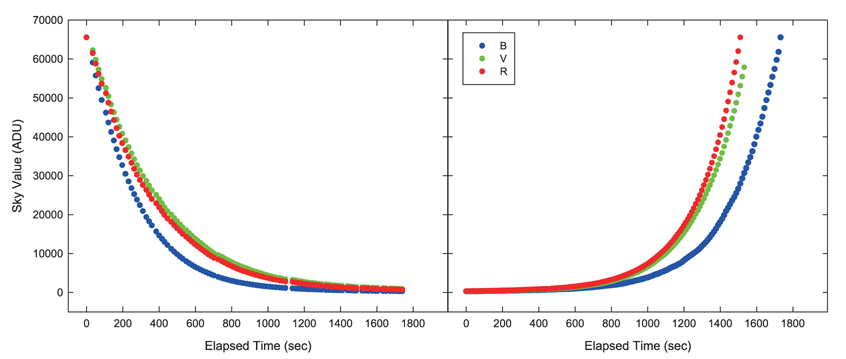
When performing the dusk twilight flats in this study, we took the first flat image of 25,000 ADU with a 5-second exposure time. Then, in successive images, the time required for the next image with 25,000 ADU was measured. As it gets darker with time at dusk, the time required for satisfying 25,000 ADU increases accordingly. For each filter, observation results were obtained more than 10 times, and they were fitted to a quintic function shown in Eq. (1). With this equation, the exposure time for obtaining the data that satisfies 25,000 ADU at a given time was acquired.
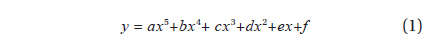
where
2.2 Configuration of the AutoFlat program
A program(AutoFlat) was developed using Visual Studio 6.0, which is an automated observation program that considers the sunrise and sunset times that vary depending on the day of observation when obtaining dusk and dawn twilight flat images, and the code for performing the AutoFlat was added to Obs Tool II (Yoon et al. 2006), which is the automated observation system at the Jincheon Station of the Chungbuk National University Observatory.
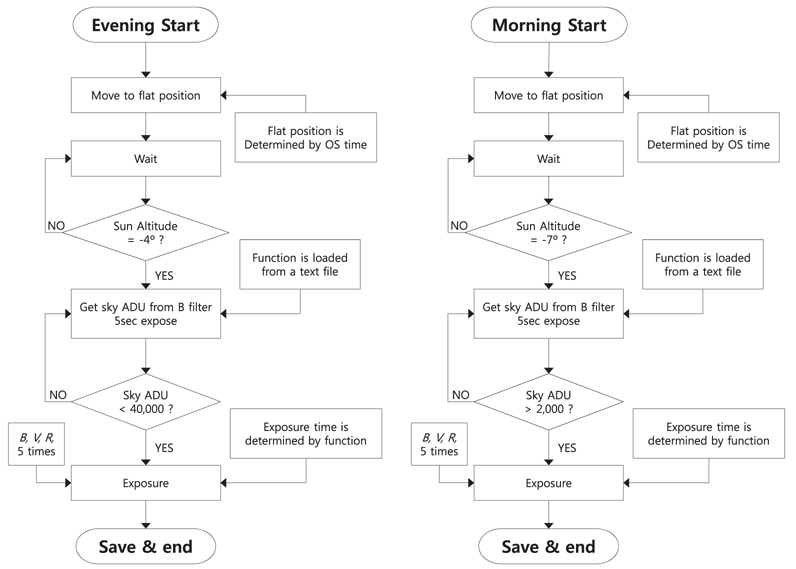
The observation of the dusk twilight flats was made by the procedure presented in Fig. 1. If an observer selects AutoFlat Start, the telescope is moved to the dusk twilight flat observation position. At this position, the observation of the sky with a uniform brightness should be available, avoiding the stepwise brightness variation of the sky that occurs at sunset. This position should be selected so that the effect of atmospheric extinction is small and the effect of the Moon is relatively small was selected. For Jinchon station, we took the position with azimuth of 72° and altitude of 72°. This position is in the opposite side of the Sun, and is in the northeast direction to minimize the effect of the Moon. Then the program checks whether the altitude of the Sun is -4°. If it is higher than -4°, the program waits until it becomes -4°. As time passes and the altitude of the Sun becomes -4°, a test image is obtained by a 5-second exposure at the
For the dawn twilight flats, if an observer selects AutoFlat Start, the telescope is moved to the dawn twilight flat position similar to the dusk twilight flats. At this position, the observation of the sky with a uniform brightness should be available, avoiding the stepwise brightness variation of the sky that occurs at sunrise. In our case, the azimuth of 290° and the altitude of 72° has been stored as dawn twilight position. This position is in the northwest direction where the effect of atmospheric extinction is small and the effect of the Moon is relatively small. Unlike the dusk twilight flats, the program checks whether the altitude of the Sun is -7°. If it is lower than -7°, the program waits until it becomes -7°. As time passes and the altitude of the Sun becomes -7°, a test image is obtained by a 5-second exposure at the
The developed AutoFlat program can stably and efficiently perform the flat field observation even though an observer does not manually carry out flat field observation by making a judgment considering observation condition each time. Therefore, the AutoFlat program is expected to be useful for photometric observation using CCD.
3.1 Determination of the exposure time
To investigate the changes in sky brightness in the course of the twilight time, the dusk flat field images at the
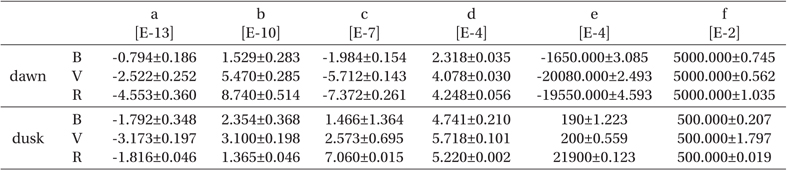
Coefficients of function to decide the exposure time (Eq. (1)) in the dawn twilight flat and the dusk twilight flat.
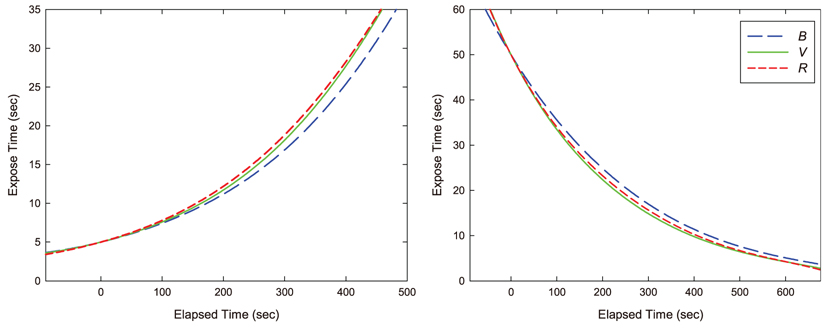
Under the same assumption, using the brightness variation function for a 5-second exposure, the brightness variations at dawn for 6-, 7-, 8-, 9-, 10-, 15-, 20-, 25-, 30-, and 50-second exposures were calculated, and for each case, the elapsed time to reach 25,000 ADU was determined. To interpolate the exposure time for a given filter at each observation, these 11 exposure times and the elapsed times were fitted to Eq. (1), and the coefficients of the function are summarized in Table 1. This function is then used to determine exposure time when the AutoFlat program performs automated observation at dawn twilight. Fig. 4 shows the expected exposure time curve for 25,000 ADU on the twilight time.
3.2 Automated observation of twilight flat images using the AutoFlat program
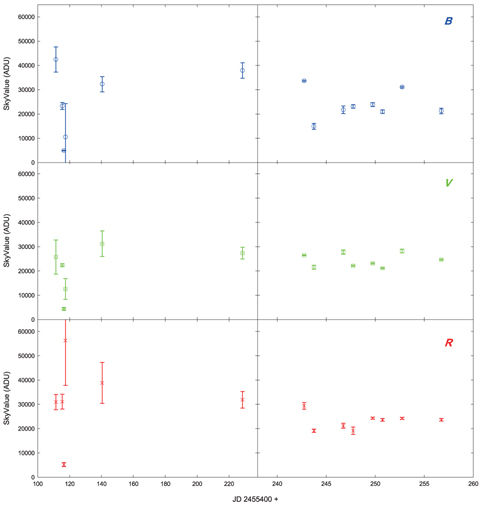
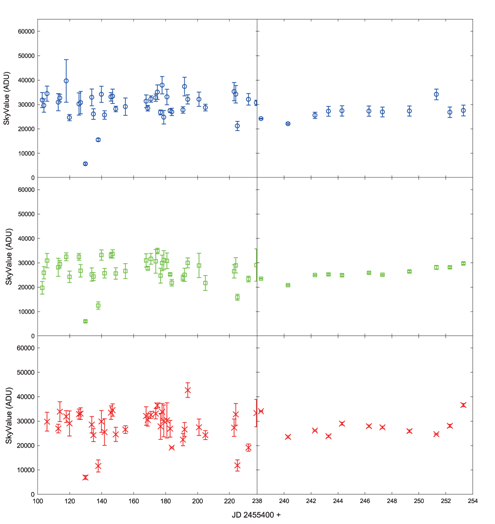
The developed AutoFlat program was applied to Obs Tool III, which has been used for the astronomical observation at the Jincheon Station of the Chungbuk National University Observatory, in order that twilight flats could be performed automatically. In order to test the precision of the program, the median values of flat images using AutoFlat from March 17 to April 5, 2011 were compared with the median values of flat images observed from October 16, 2010 to March 16, 2011 without the AutoFlat program. Fig. 5 shows the median values of the dusk twilight time flat images before and after the use of the AutoFlat program.
The flat images before the AutoFlat program were obtained with the traditional method for twilight flat. The median values before the AutoFlat program in Fig. 5 are generally distributed in wide region between 10,000 and 40,000 ADU, and we can find 1 day with the median value under 10,000ADU. At this night, the observer has probably missed the start time for the flat observation. On the other hand, the flat images observed using the AutoFlat program show the median values generally evenly distributed between 10,000 and 30,000 ADU, which do not exceed the linear limit of the CCD pixels. The standard deviations of the values obtained at the
It is also to be noted in Fig. 5 that there are some high ADU values in the first day and the eleventh day at the
Fig. 6 shows the median values of the dawn twilight flat images before and after the use of the AutoFlat program for the same period. The flat images before the AutoFlat program were obtained with the traditional method for twilight flat. The median values before the AutoFlat program in Fig. 6 are generally distributed in wide region between 20,000 and 50,000 ADU, and we can find 1 day with the median value with 65,000ADU. At this night, the observer seems to have missed the start time for the flat observation. On the other hand, the flat images observed using the AutoFlat program show the median values generally distributed between 10,000 and 30,000 ADU, which do not exceed the linear limit of the CCD pixels. The standard deviations of the median values at the
It is also appreciable in the Fig. 5 and Fig. 6 that the dawn twilight flats was less evenly distributed than that of the dusk twilight flats. One reason of this phenomenon seems to be the fact that the brightness of the Moon was included in the general sky brightness when obtaining the dawn flat field images for a 5-second exposure. Another cause could be the effect of the variable fog as an unexpected factor. The humidity during the test period of the dawn twilight observation was 82.5±7.7% according to the data from the Korea Meteorological Administration.
3.3 Applicability of the AutoFlat program
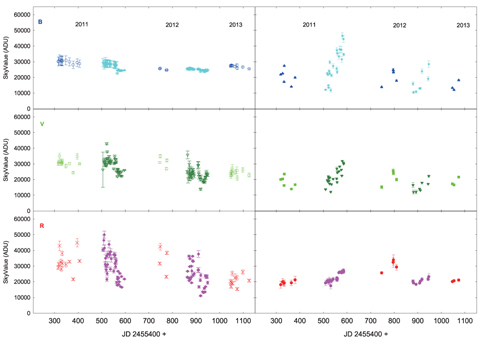
Since March 2011, the developed AutoFlat program is being applied to the automated observation program at the Jincheon Station of the Chungbuk National University Observatory, and operates with no problem in spite of the seasonal variations all year round. The median values of the flat images for each season were examined from the summer of 2011 to the summer season of 2013 to examine whether the AutoFlat program works quite well in all seasons.
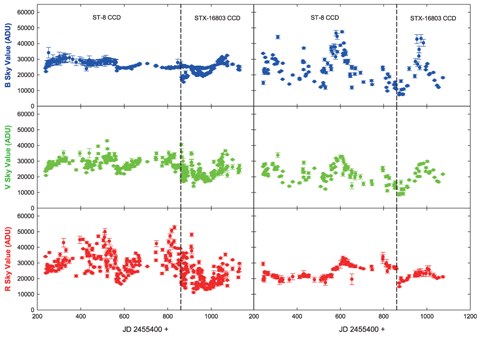
Fig. 7 shows the median values of the flat images for the dusk and dawn twilight during the above period. As shown in the figure, the median values did not change significantly, and were stabilized between 10,000 and 30,000 ADU in summer and winter for the three years. However, a flat image at the B filter exceeded 30,000 ADU in the winter season of 2011, which seems to be the weather effect at that time. The sky brightness gets brighter when scattered reflection occurs due to smog, etc.
In the Jincheon Station of the Chungbuk National University Observatory, ST-8 CCD was replaced with STX-16803 (4K CCD) on November 28, 2012. It was highly interesting to check whether the AutoFlat program also operates properly with the new CCD. The flat images observed using the AutoFlat program after the replacement were compared with the flat images before the replacement.
Fig. 8 shows the median values of the flat images observed using the AutoFlat program from the summer season of 2011 to the summer season of 2013. The median values were generally between 10,000 and 30,000 ADU, indicating the acceptable range which do not exceed the linearity of the CCD. Based on the above two tests, it is to be concluded that the flat images with the developed AutoFlat at the Jincheon Station of the Chungbuk National University Observatory can be used for the pre-processing of the observation data.
In the traditional twilight flat observation, start time varies according to the season, and observation is depended highly on the judgment of an observer within a limited observation time. Especially, if an observer fails to adjust exposure time or misses start time, flat images cannot be obtained. In this study, to supplement the existing twilight flat method, an AutoFlat program was developed, and tested using a wide field telescope with a 0.6 m aperture and ST-8 CCD at the Jincheon Station of the Chungbuk National University Observatory from January 24 to January 29, 2011.
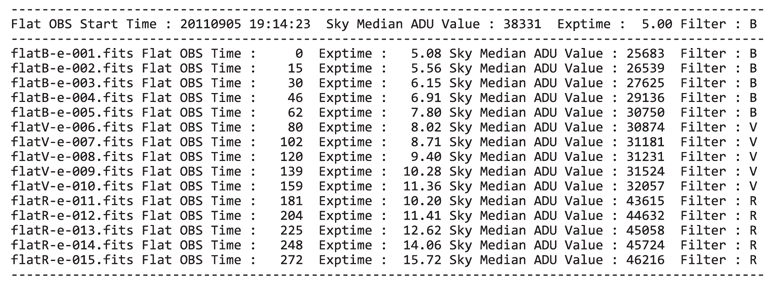
In order to assure the usefulness of the developed AutoFlat program to a real observing system, it was was tested from March 17 to April 5, 2011. The testing process can be explained as follows: When an observer selects the AutoFlat Start button, the computer moves the telescope to a pre-determined position by choosing the dusk twilight flats or the dawn twilight flats according to the date and time. The starting time is calculated from the solar altitude and the expose time for the next image is determined from the sky ADU of the first flat image for 5-second exposure at the given filter. When the twilight flats are finished, the obtained data are stored in a log file of the observation date. Also, the function for determining exposure time can be easily used just by exchanging the text file when this function is used in other location. Especially, after finishing the flat observation, the status of the observed images is recorded in a log file so that it can be used for data analysis (refer to Fig. 9).
The dusk twilight flats were generally evenly distributed between 10,000 and 30,000 ADU for observed 11 days among a total of 20 days, which do not exceed the linear limit of the CCD pixels. The standard deviations of the values obtained at the B, V, and R filters shows that the average of 5 flat images at the V filter are uniform, whereas the average at the B filter are not uniform, as shown in Fig. 5. The dawn twilight flats generally distributed between 10,000 and 30,000 ADU for observed 8 days among a total of 20 days, which do not exceed the linear limit of the CCD pixels. The standard deviations of the values obtained at the B, V, and R filters were small, which means the uniform flat images at each filter.
For the dusk twilight flats, uneven distributions were observed in the first day and the eleventh day at the R filter, and in the the ninth day at the B filter. The lack of the correlation among each function can be thought as a possible cause because data at the first day could not be simultaneously obtained at each filter when obtaining the brightness variation of the twilight for a 5-second exposure. The cause of the high R filter value of the eleventh day could not be identified. Moon or the weather condition were considered as a possible explanation, but a direct cause of this phenomenon could not be found. The B filter value of the ninth day turned out to be the observer’s fault. The observer at that night took the flat image without turning off the light inside of the dome. The flat images obtained after turning off the light later at the V and R filters stable values. The dawn twilight flats showed an uneven distribution. One reason of this phenomenon seems to be the fact that the brightness of the Moon was included in the general sky brightness when obtaining the dawn flat field images for a 5-second exposure. Another cause could be the effect of the variable fog as an unexpected factor. The humidity during the test period of the dawn twilight observation was 82.5±7.7% according to the data from the Korea Meteorological Administration.
The comparison of the results obtained by the traditional twilight flat method with the results obtained by the developed AutoFlat program showed that the flat images with the AutoFlat program are more stably and evenly distributed between 10,000 and 30,000 ADU, which do not exceed the linear limit of the CCD pixels, and have no cases where twilight flat images could not be obtained due to missed start time.
In future studies, the program will be supplemented so that it can perform more precise twilight flats, by analyzing the relation between the changes in the sunrise and sunset positions due to the differences in the altitude of the Sun according to season and the accompanying changes in sky brightness.