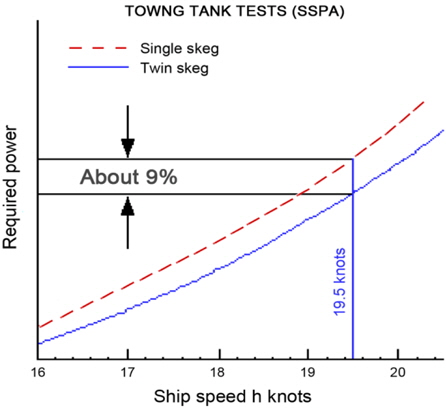
SSPA experiences a growing interest in twin skeg ship as one attractive green ship solution. The twin skeg concept is well proven with obvious advantages for the design of ships with full hull forms, restricted draft or highly loaded propellers. SSPA statistics, based on over 400 different twin skeg configurations in 200 projects, show that twin skeg hull forms in general require 6% lower propulsion power compared with a single screw ship with the same cargo capacity. For the best quartile of the same statistics the twin skeg hull forms still require 2-3% less propulsive power than the corresponding single screw designs. In addition, the maneuverability and lateral stability are improved, redundancy is added and the risk of excessive propeller induced pressure pulses can be reduced. Some of SSPA research works have been reported by Williams (1975; 1980) and Berlekom (1985).
In recent years large LNG ships with cargo capacity of 150,000
As part of our first dimensional parametric study, LNG ships with payloads between 150-250,000
After selecting the main hull parameters, an optimization was carried out in the second phase. The key to design good twin skeg hull forms is the optimum selection and combination of all relevant design parameters, for instance skeg shape, skeg vertical and toe angle as well as distance between the skeg by taking advantage of the balance between pre-rotation, resistance and propulsion efficiency. However, designing an optimum twin skeg hull form still is a difficult task because a clear understanding of the influence of all design parameters discussed above on ship propulsion performances has not been available. SSPA has a long experience in developing twin skeg hull forms since the first design was tested in 1943 and SSPA has also been involved in many commercial/research projects in designing and testing twin skeg hull form designs. Until recently, however, the design of twin skeg hull form has been based on model tests together with accumulated knowledge and experiences. This approach cannot guarantee to obtain a globally optimal twin skeg hull configuration since the number of design parameter variations in model tests are limited due to cost and time. CFD is then considered a good complementary tool to help evaluating more variants in a cost effective manner at design stage.
Along with continuous development of the RANSE solver of SHIPFLOW (CHAPMAN) by FLOWTECH (2009), extensive commercial/research works have been performed making use of the full functionalities of resistance computations as well as self-propulsion simulation for twin skeg hull configurations either by zonal or global approach and at model or full scale Reynolds number.
The first CFD work presented here is a model scale performance predictions in order to select the best twin skeg design among 11 different skeg configurations designed through a systematic variation of design parameters. Optimum rudder angles were also investigated in combination with propeller turning directions. This type of CFD computation is very challenging since it requires the full simulation of propeller open water characteristics, resistance and self-propulsion tests with a high level of accuracy that is capable of predicting small differences in flow characteristics, as well as the relative ranking of propulsion efficiency due to small variations in design parameters for the twin skeg shape.
Based on the evaluation of the power demand, detail analysis of flow characteristics and considering all design constraints, the most promising and suitable twin skeg design was selected for the comparison of the power performance with a single screw ship.
Full scale simulations were made for a twin skeg and a single screw LNG having the same Lpp, B and draft. The ships were then built and tested at SSPA (Lundström, 2011a; 2011b) in order to confirm the achievable power saving with the twin skeg design when compared to the conventional single screw hull.
The optimized twin skeg hull form showed 13% lower propulsion power compared with a single screw ship with the same cargo capacity.
The present paper includes only the design development of a 170,000
MAIN DIMENSION PARAMETER STUDY
SSPA has an extensive hull data base with over 7000 models tested, including over 400 twin skeg hull forms. The data bank contains information about every single hull form tested such as main dimensions, hull characteristics and – most importantly - resistance/propulsion performance, to which the results of an actual test can be compared, thereby establishing a sort of resistance and propulsion quality of the hull.
Every single model test from those of slender high-speed ships to highest blockage and slowest running tankers has been taken into the data bank from which samples of similar ships can be collected around combinations of hull characteristics that are of interest at the moment. A data output contains frequency distributions of resistance and propulsion quality figures of the sample ships. Accordingly it will be possible to statistically judge the model test results of a new project, the probability of further improvement and to help finding a better performing hull form. Alternatively the data bank can be used to perform statistical speed power predictions and analyze the probability to reach a certain performance.
Another application is to perform main dimension variations according to SSPA’s systematic model series, applying the quality figures and other propulsion characteristics from the data bank, as analyzed vs. the same basis. This will give statistical expectation of the power variation in relation to main dimensions and fullness. Conoco Phillips Co. was our first client to realize the value of such investigations; they commissioned SSPA in 2003 to perform parametric studies for single and twin skeg LNG vessels of various size and fullness. In 2005 investigations for BP Shipping Co. started within their hydrodynamic development program concerning parametric propulsion studies for two types of vessels. Today we are working on the 8th study for BP, on as many ship types. Other clients have followed.
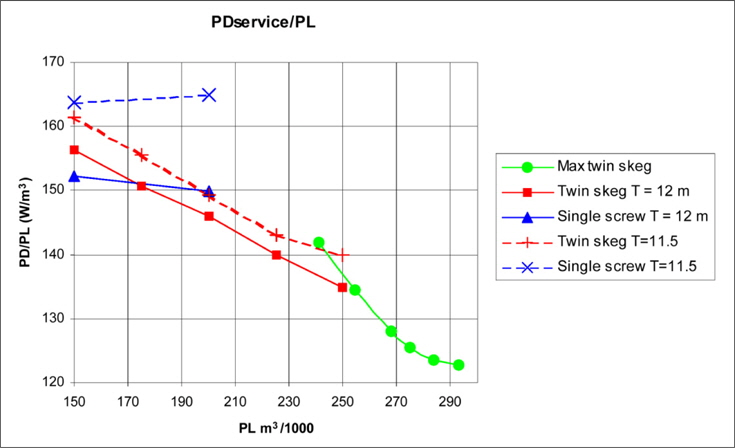
In Fig. 1, an output from one of SSPA parametric studies, based on the LNG model test data, is shown. The figure shows a comparison of the required delivered power per unit payload of single and twin skeg LNGCs for an optimum combination of hull parameters (as LPP, B and CB) at constant draught (T) and speed (Vs). It is interesting to see that the performance advantages of the twin skeg concept increase as the cargo capacity grows, but also that there is a break-even point where the single screw concept gets more beneficial. For ship sizes of 150,000
The main hull dimensional parameters selected for 170,000
HULL DESIGN PARAMETER OPTIMIZATION STUDY
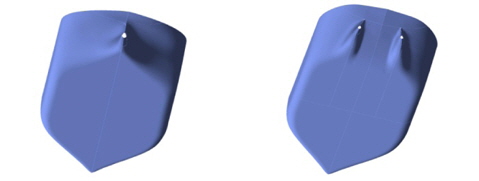
Starting from an initial design, further optimizations of the hull and the skeg shape were carried out. The design of a twin skeg aft body is a difficult task as can be seen in Fig. 3. The shaping of the skegs, their inclination, fore and aft direction, the distance between them as well as the slope of the bottom between the skegs increases the complexity of balancing flow separation against propulsive properties and resistance.
The design parameter optimizations were performed throughout a variation of the following five design parameters:
• Distance between skegs• Longitudinal slope between skegs• Vertical skeg inclination• Longitudinal skeg inclination• Skeg form
The twin skeg hull form was modeled by means of a fully parametric model by using the modeling and optimization software FIENDSHIP- Framework allowing an easy variation of various design parameters (see Tillig’s thesis work in 2010 for more details). All variations were analyzed using full viscous CFD solver SHIPFLOW making use of the tight coupling between the modeling program FRIENDSHIP-Framwork and the simulation software SHIPFLOW. The results of the parameter variation study are discussed in the following sections:
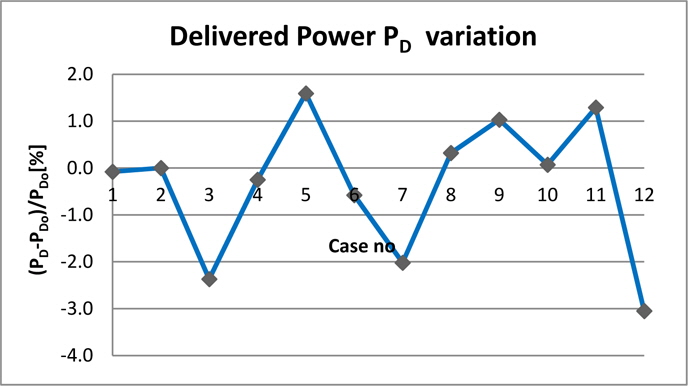
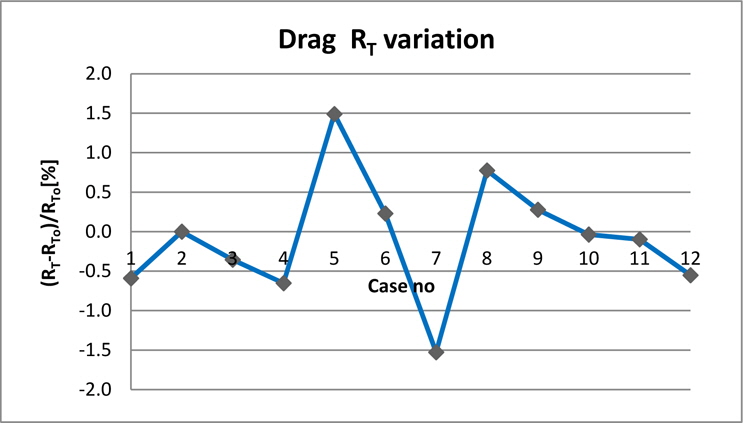
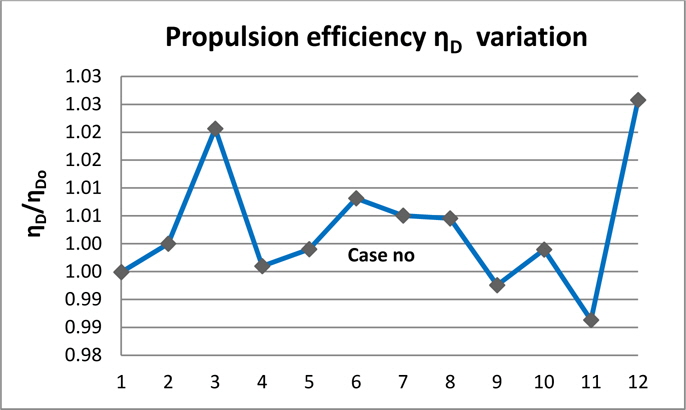
The distance between the skegs is one of the most important design parameters governing propulsion performance. According to SSPA statistics, distances between 25% and 60% (for special reasons even more) of the vessel’s beam have been applied in a number of projects. In the present study, the distance of initial design (case 2) was increased and decreased by 12.5% (case 1 and case 3, respectively). It can be seen from Fig. 6 that 2.4% improvement of propulsion performance can be achieved in case 3 (increased distance).
However, as for many regions in hull design the distance between skegs has to be determined by other practical considerations than purely hydrodynamic reasons. A larger distance between the skegs in relation to the hull will provide a possibility to apply larger, slowly rotating propellers with a higher efficiency and provides the possibility of slendering the outside part of the hull and decrease the wetted surface and wave resistance. The resistance of the skegs themselves and the risk for propeller air drawing when rolling in a seaway must be weighed against higher propulsion efficiency. It is often practical considerations that determine size and location of the propellers (e.g. the rpm of suitable engines or the aft ballast draught) and thereby the distance between the skegs. A small distance as in case 1 may also cause interference effects which affect the steering capability of the vessel. The case no 2 was selected for further optimization study.
>
Longitudinal slope between skegs
The influence of the longitudinal angle of the center plane was investigated in case 4 and case 5 with a 2.5° lower angle and 2.5° higher angle, as compared to the initial design. The longitudinal slope of the hull bottom between the skegs must have such an inclination (to the horizontal plane) that flow separation in this area is avoided. 1.5% increase of drag for case 5 in Fig. 4 may indicate some flow separation due to the higher longitudinal slope angle. Additionally a lower longitudinal angle moves the transition point at the flat of bottom further forward which might not be possible due to engine or tank arrangements.
The vertical inclination of the skegs is another most important design parameter and should be chosen so that a pre-swirl is created in the flow to the propeller. The generated pre-swirl flow can produce favorable interaction with the propeller that improves the propulsion efficiency and results in a power reduction. Two variations were tested; case 6 (5° smaller angle) and case 7 (5° larger angle). It can be seen from Figs. 5 and 6 that 2% improvement can be achieved in case 7 by increasing the vertical skeg angle (inclining the skeg further away outwards).
>
Longitudinal skeg inclinations
The influence of longitudinal skeg inclination is investigated by decreasing or increasing the angle by 1° in case 8 and case 9. The variations made in any case do not improve the propulsion performance and it can be concluded that the original angle seems to be a good choice.
The skeg form affects the risk of separation and our experience indicates that an unsymmetrical form with a thinner body inside the skeg than outside is favorable. The influence of skeg form is investigated by slendering inside of skeg shape of case 2 and 3 in case 11 and 12. The results of self-propulsion simulation confirmed our previous experiences that 0.2-0.7% further improvement can be achievable from such a small modification applied to a limited part of skeg.
>
Combined design parameter variations
The combined effect of the longitudinal and vertical inclinations is investigated in case 10; which is made by decreasing vertical skeg angle by 5° and increasing longitudinal skeg angle by 1° from the original design. No actual improvement was obtained from this combined variation, the design of twin skeg aftbodies is rather complex and individual as can be seen in Fig. 3 as an example.
Experience has shown that more than one parameter for the change of skeg shape can be successful. Obviously using a formal optimization would have been beneficial for investigation of the combined effects by coupling the design parameters. However, the considerable CPU time required for combined parameter set renders such an approach not feasible within a reasonable time frame.
CONFIRMATION BY CFD AND MODEL TESTING
Based on the dimensional parametric and hull shape optimization study, the most suitable twin skeg hull design was selected for a comparison of the performances with a single screw ship by means of CFD simulations and model tests. Computations for performance evaluation were made with very dense grids with additional refinements around the stern of the ship including the propeller (s) and rudder (s). The used grids had in total 12.7
>
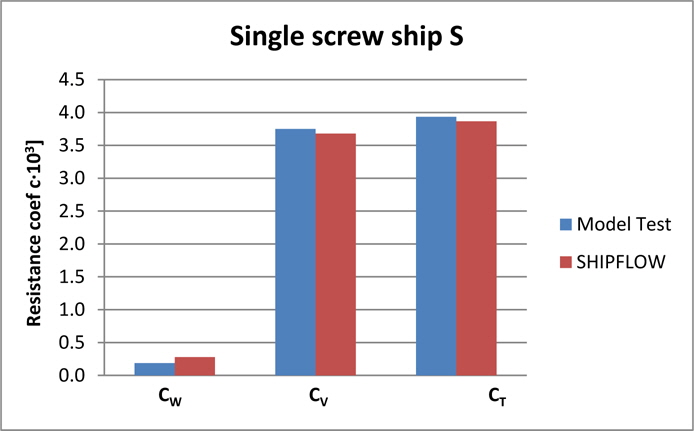
Single screw lng ship-ship S
The predicted resistance components are compared with the test results in Fig. 7. The total resistance is slightly under predicted with a deviation of 1.7%.
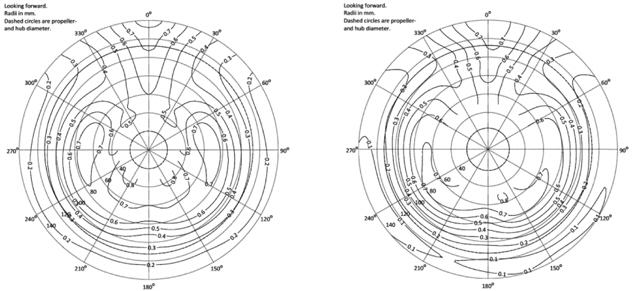
The predicted model scale wake at Vs = 19.5
In general the calculation predicts the wake flow characteristics well in several aspects. Both, calculations and experiments indicated an upward and inward diected flow forming a pair of bilge vortices. The center position of bilge vortices is well predicted. Some minor difference can be seen in the upper (345°-15°) and lower part (150°-210°) close to the symmetry plane. The longitudinal bilge vortical flow predicted in upper part is not strong enough while much stronger wake is predicted at the shifted position in upper direction in the computation.
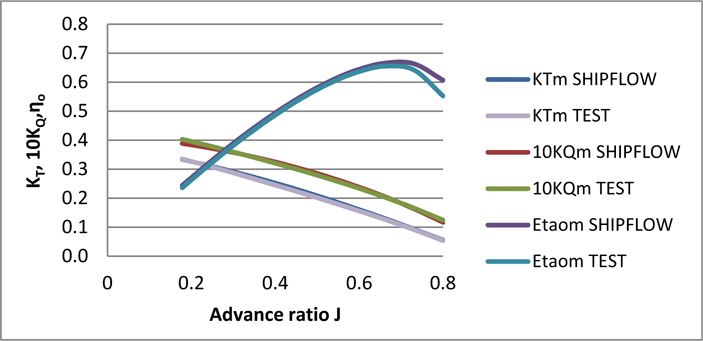
The open water characteristics of the propeller were calculated at a wide range of advance ratios from J = 0.2-0.7. The computed results are compared with the measurement data in Fig. 11. It is observed that the thrust and torque are well predicted for most frequent operating range between J = 0.4 and J = 0.6, but under predicted for a J lower than 0.2.
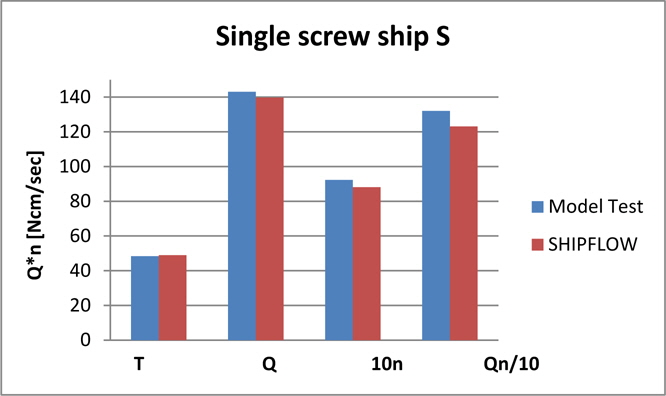
The predicted propulsion factors are well within 2.3-4.6% (see Fig. 12 below).
The under prediction of T and Q can be partly explained by the fact that the applied towing force in the simulation is somewhat higher than the required and this may result in light propeller loading conditions when obtaining force equilibrium by adjusting the propeller rpm during self-propulsion simulation.
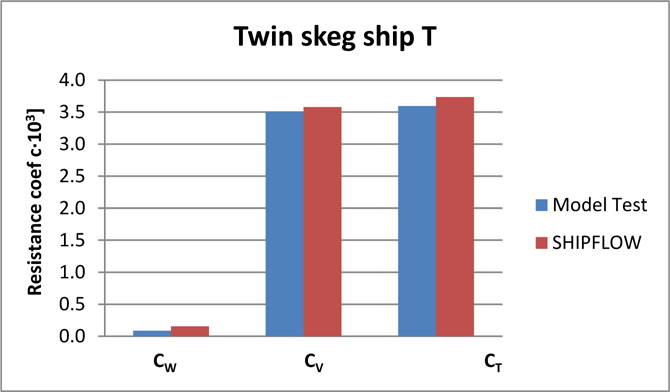
The predicted resistance components are compared with the test results in Fig. 13. The viscous resistance computed yields a form factor of 0.196, which is somewhat higher than the measured one (0.180). The total resistance is slightly over predicted with a deviation of 3.9%.
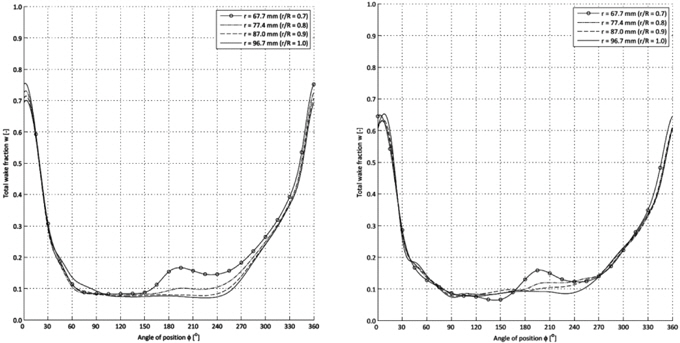
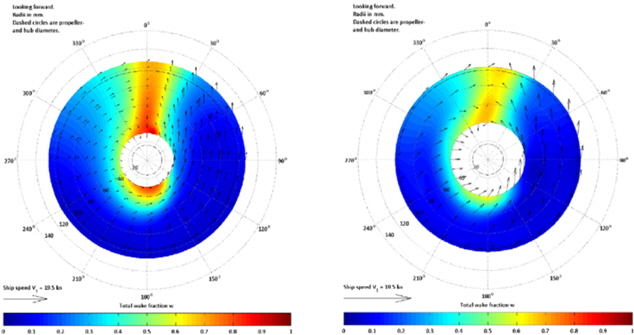
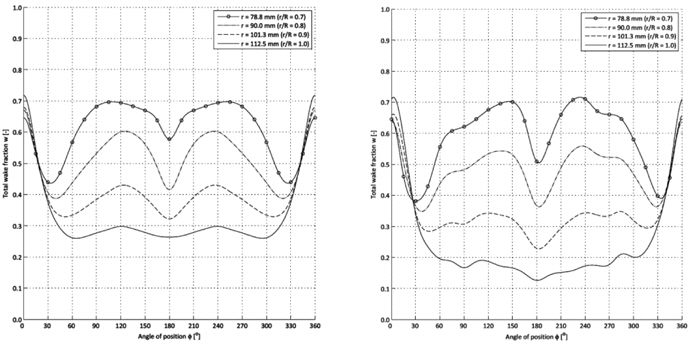
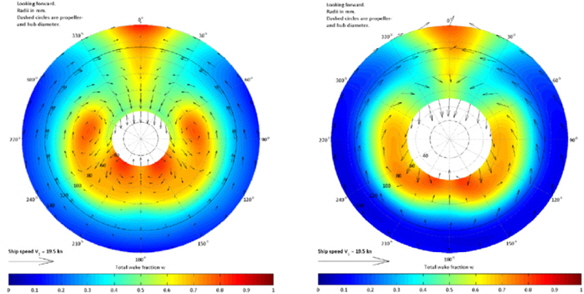
The predicted model scale wake at Vs = 19.5
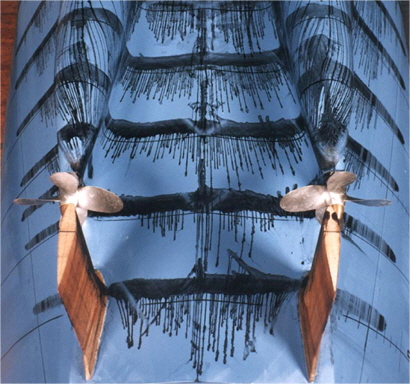
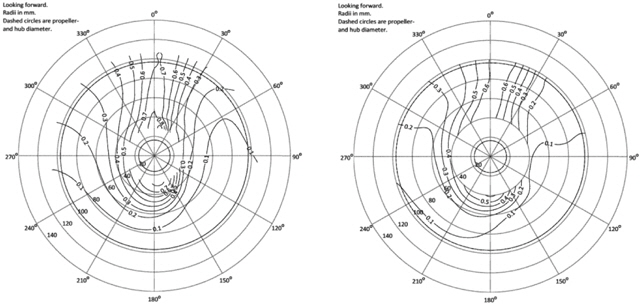
[Fig. 14] Comparison of total nominal wake for twin skeg ship, left: computation, right: experiment.

When comparing the computed wakes with the measurements, similar features and shapes are noted. It is interesting to see the pre-rotation in the flow which also explains the improved performance with inward compared to outward turning propellers.
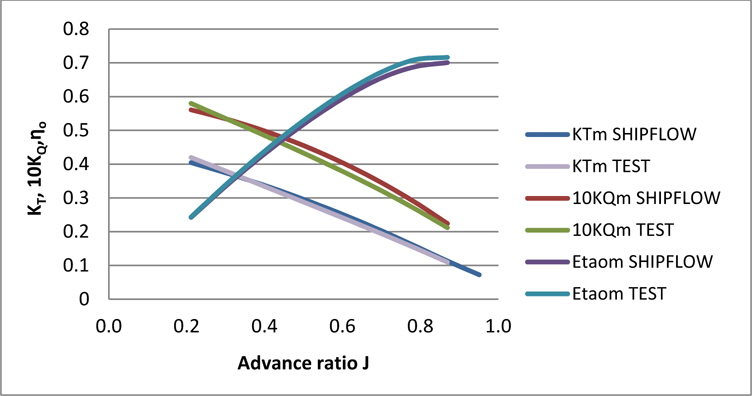
The open water characteristics of the propeller were calculated at a wide range of advance ratios from J = 0.2-0.7. The computed results are compared with the measurement data in Fig. 17. It is observed that the thrust and torque are well predicted for most frequent operating range between J = 0.4 and J = 0.6, but under predicted for lower J than 0.2.
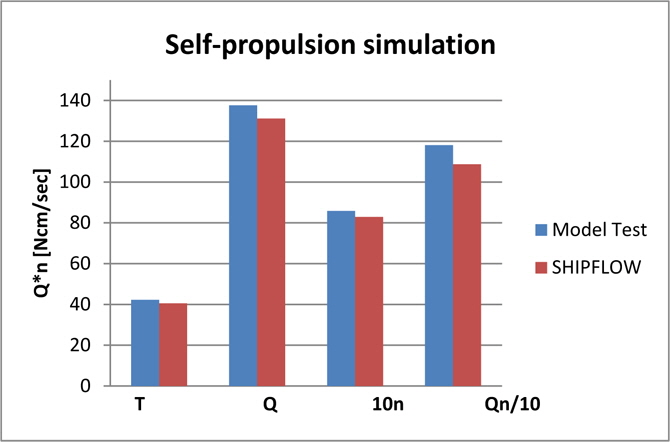
The predicted propulsive factors are well within 3-4% deviations for thrust, torque and rpm from the measured one. However, of more interest to the ship designer is the propulsion power, which is 8% under predicted (see Fig. 18 below).
The under prediction of the power can be partly explained by the fact that the applied towing force in the simulation is somewhat higher than the required and this may result in lighter propeller loading condition when obtaining the force equilibrium by adjusting the propeller rpm during self-propulsion simulations.
>
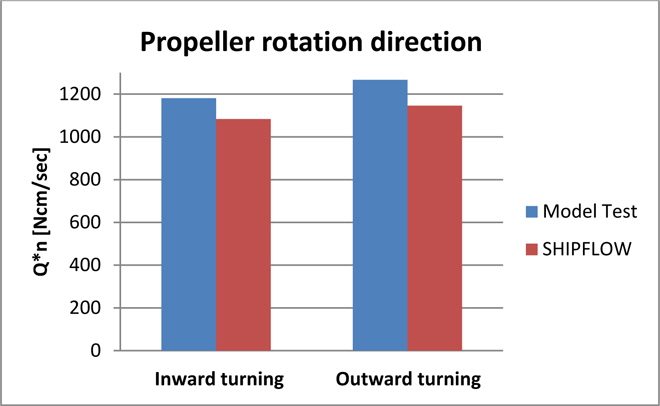
Propeller rotation direction
The propulsion performance can be different depending on propeller rotation direction. The propeller rotation direction is in general found to be preferably inwards turning at the top although it depends on the detailed design of the twin skeg hull form. 6 to 7% differences are predicted from the simulation and model test for the present case between inwards and outwards turning, see Fig. 19.
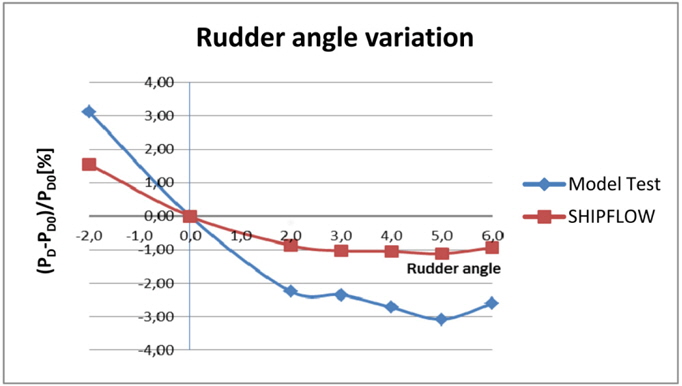
SHIPFLOW simulations for varying rudder angles and propeller rotational directions were performed in order to find the optimum combination, with respect to required power. Similar to a normal self- propulsion test, the simulations were conducted for the design speed (Vs = 19.5
>
Comparison between sinle screw and twin skeg designs
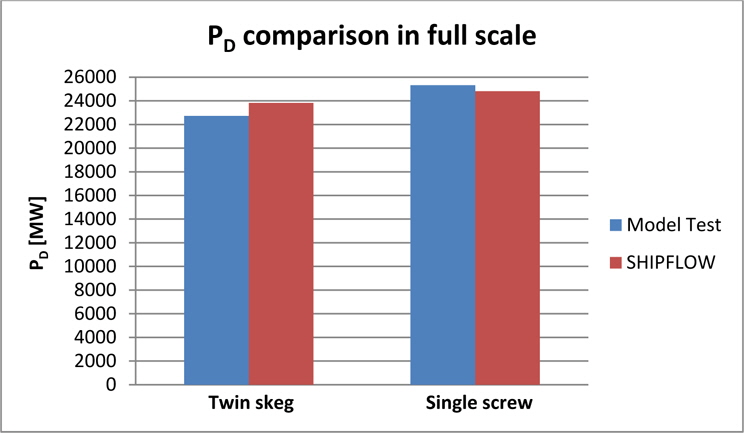
The comparison is made based on the results from the SHIPFLOW simulations and model tests performed for the single screw and the optimized twin skeg hull.
In Fig. 21 the required delivered power is given and the model test result shows that around 11.4% power reduction can be achieved for the present investigated case with twin skeg design as compared to the corresponding single screw ship. SHIPFLOW prediction confirmed the conclusion from the model tests that twin skeg is the favorable design concept for a 170,000
The results of the present comparison study are in good agreement with general conclusions drawn from SSPA’s statistics and the earlier findings by others. Kim and Lee (2005), presented their findings from the optimization process at Daewoo Shipbuilding and Marine Engineering (DSME) for their 200,000
In the present paper, a design optimization study of a 170
The twin skeg design is in no way an ultimate solution, but among many other pros in relation to a conventional single screw design, the present investigation indicated that the twin skeg can in the present cases be a favorable solution giving a vessel with 13% lower fuel consumption than a comparable single screw design.