검색 전체 메뉴
PDF
맨 위로
OA 학술지
Serum Biochemical, Histopathology and SEM Analyses of the Effects of the Indian Traditional Herb Wattakaka Volubilis Leaf Extract on Wistar Male Rats
  • 비영리 CC BY-NC
ABSTRACT
Serum Biochemical, Histopathology and SEM Analyses of the Effects of the Indian Traditional Herb Wattakaka Volubilis Leaf Extract on Wistar Male Rats
KEYWORD
Wattakaka volubilis , petroleum ether cold maceration extract , streptozotocin , liver , scanning electron microscopy
  • 1. Introduction

    Diabetes mellitus is one of the oldest diseases, and it affects millions of people all over the world [1]. The total world population with diabetes is projected to rise to 366 million in 2030 [2]. Since ancient times, the medicinal properties of plants have been investigated, and recently, new scientific developments have involved traditional practitioners in the development of modern medicine throughout the world. In view of the adverse effects associated with synthetic drugs, medicinal plants are safer, cheaper and more effective. Thus, conventional antidiabetic plants should be explored [3].

    There is an increasing demand by patients to use natural products with antidiabetic activity. Furthermore, following the World Health Organization’s recommendation, investigations of hypoglycemic agents from medicinal plants have become more important [4]. The liver is regarded as the central metabolic organ in the body, with an important role in maintaining post-parandial normal glucose concentration (glyconeogenesis and glycolysis), and it is the main site of insulin clearance [5]. Diabetes, by most estimates, is now the most common cause of liver disease (hepatopathy) in the world, and liver disease, including abnormal liver enzymes, hepatocellular carcinomas, and acute liver failure, is an important cause of death. Various pharmacotherapies, such as hypoglycemic drugs, insulin, and, recently, cellular therapy, are available, but these therapies have their own limitations [6].

    The available literature reveals that more than 400 Indian plant species have hypoglycemic potential [7, 8]. Wattakaka (W.) volubilis is in the family asclepiadaceae and is grown throughout the hotter parts of India [9]. The leaf parts of the plant are used traditionally as medicines to treat rheumatic pain, cough, fever, severe cold and dyspepsia. Leaf powder is taken orally with cow’s milk and has an antidiabetic activity [10]. The present research aimed to investigate the antidiabetic properties of petroleum ether cold maceration extract (PEME) of the Indian traditional herb W. volubilis in a diabetic rat model.

    2. Materials and Methods

    Around 2 kg of leaves of W. volubilis were powdered and passed through 40-mesh filters to obtain a coarse powder, which is best suited for extraction. The powder from all the leaves was placed with petroleum ether in a container with a stopper and was allowed to react at room temperature over a period of 72 hours with recurrent stirring until all the soluble matter had dissolved. The mixture was then strained, the damp solid material was pressed, the pooled liquids were clarified by filtration after settling, and the extract was concentrated under vacuum by using a rotary vacuum evaporator. The concentrated extract was used for the in vivo pharmacological study.

    Wistar rats were fasted for sixteen hours before induction of diabetes by administering a single dose of 90 mg/kg body weight of streptozotocin (STZ) in 0.9-percent normal saline injected through an intraperitoneal route [11]. Hyperglycemia was confirmed 48 hours later, and fasting serum glucose levels > 250 mg/dL were obtained by using the glucose oxidase-peroxidase method [12]. The rats were divided among five groups, each with six rats: Group 1: normal control (saline treated), Group 2: untreated diabetic rats, Groups 3 and 4: diabetic rats treated orally with PEME of W. volubilis (50 and 100 mg/kg body weight), and Group 5: diabetic rats treated orally with metformin (250 mg/kg body weight). All rats received treatment for 21 days. Experiments were conducted in accordance with the guidelines of the Committee for the Purpose of Control and Supervision of Experiments on Animals (CPCSEA), New Delhi, India (Registration No: 0367/01/C/CPCSEA), and the study was approved by the Ethics Committee of the Department of Pharmaceutical Technology, Jadavpur University, Kolkata, India.

    Blood samples were collected on days 0, 7, 14 and 21 after induction of diabetes from normal rats, untreated diabetic rats, rats treated with PEME of W. volubilis, and rats treated with metformin. Colorimetric measurements were made using commercial diagnostic kits (Span Diagnostics Ltd., Surat, India), a biochemistry auto analyzer (Star 21 plus, Rapid Diagnostic Pvt. Ltd., New Delhi, India), and a UV spectrophotometer (Elico-SL 159, Elico India Ltd., Hyderabad, India).

    Animals were sacrificed after 21 days, and the liver tissues were preserved in formalin (10%) for further processing and fixed in paraffin wax. Thin five-μm sections on glass slides were stained with hematoxylin and eosin dyes for histopathological evaluations. Scanning electron microscopy was performed on liver tissues from normal, untreated diabetic, PEME-treated, and metformin-treated rats. The blocks were fixed in 2.5% glutaraldehyde buffered in 0.1-M phosphate overnight at 4℃. The specimens were then washed in a phosphate buffer thrice and osmicated in 1% osmium tetroxide for 2 hours. After the specimens had been washed in buffer and dehydrated in a graded series of ethanol solutions, they were dried in a critical-point drying apparatus (Polaron SC 7620, Quorum Technologies, Sussex, United Kingdom) by using liquid carbon dioxide, were mounted on aluminum stubs, and were vacuum coated with gold palladium (Polaron SC 7620, Quorum Technologies, Sussex, United Kingdom). Coded specimens were then viewed under a scanning electron microscope (Model VEGA II L50, LSU, Tescan, Czech Republic) operated at 10 kV. The entire specimen was scanned on a monitor at a magnification of x885. For each block of tissue, an area with maximum damage was chosen and photographed.

    The results are expressed as means ± standard deviations (S.D.’s). Graph pad prism version 5.04 was used for the ANOVA. That was followed by Tukey’s multiple comparison to assess the mean differences and the significance variations.

    3. Results

       3.1. Serum biochemical parameters

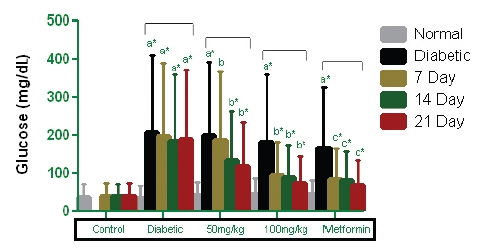
    Rats with STZ-induced diabetes that had fasted exhibited a significant elevation in serum glucose levels after 48 hours. Administrations of PEME of W. volubilis (50 and 100 mg/kg body weight) and of metformin (250 mg/ kg body weight) caused significant reductions (P < 0.001) in the serum glucose levels during the 21-day treatment. The higher dose of 100 mg/kg body weight of PEME of W. volubilis showed a better effect than the lower dose of 50 mg/kg body weight of PEME of W. volubilis. Rats treated with standard metformin showed improved anti-hyperglycemic activity compared to rats treated with 50 mg and 100 mg/kg body weight of PEME of W. volubilis (Fig 1) Enhanced serum α-amylase levels were found in STZ-induced diabetic rats relative to non-diabetic rats. Fig. 2 obviously shows that the activities of α-amylase in the PEME of W. volubilis group and in the metformin group were decreased compared to the activities in the untreated diabetic group. From the data presented in Fig. 2, the inhibition of the α-amylase activity was greater in the group treated with metformin than in the group treated with PEME of W. volubilis (100 mg/kg body weight), but the level returned to normal during the 21-day test.

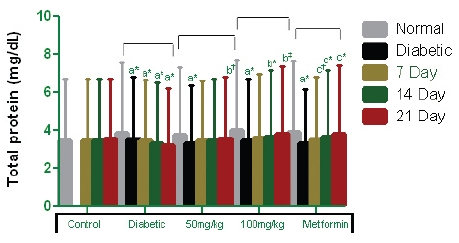
    The serum total protein concentrations of STZ-induced diabetic rats are described in Fig. 3 The serum protein levels were lowered as a result of the diabetic state of the experimental rats. The decreases in the STZ-induced diabetic groups (Groups 2 to 5) are 0.75, 0.95, 0.99 and 1.46 mg/dL. However, gradual increases in serum protein were observed during the 21-day test both for the rats administered PEME of W. volubilis and for the rats administered metformin. Repeated administration of daily doses of PEME of W. volubilis at 50 mg/kg body weight for up to 14 days did not influence the serum protein levels in diabetic rats. However, 21 days of daily doses of PEME of W. volubilis at 100 mg/kg body weight caused a significant variation in serum protein levels. Significant reductions in the serum protein levels within the group treated with metformin were also seen after 21 days of treatment.

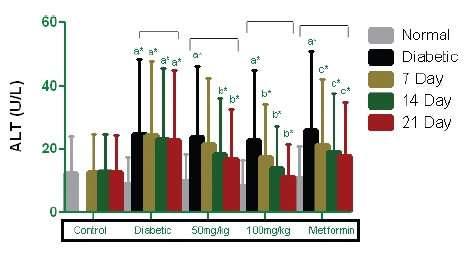
    The analyses of the biochemical parameter revealed an elevation of the serum marker enzyme in the STZ-induced diabetic groups, indicating significant increases in ALT levels. Fig. 4 shows that the PEME-treated groups had lower ALT levels (4.12, 10.23, and 13.47 U/L in the 50-mg/ kg body weight group, and 10.79, 17.73, and 23.46 U/L in the 100-mg/kg body weight group on days 7, 14, and 21, respectively), as did the metformin-treated group (8.98, 13.47, and 16.13 U/L). Significant decreases (P < 0.001) in the ALT levels to near pre-diabetic levels were observed.

       3.2. Histopathology and scanning electron microscopic evaluation of liver

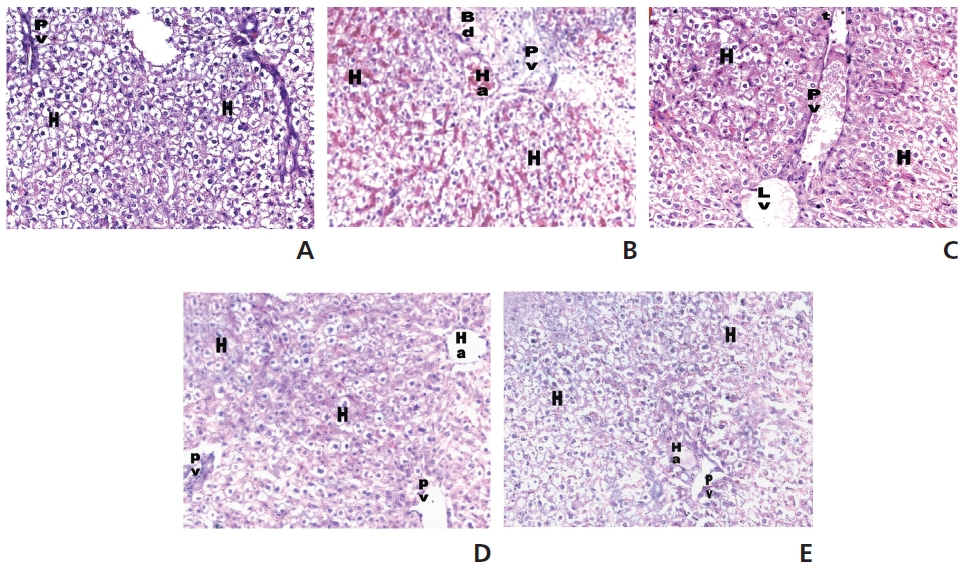
    A histological study was carried out by using light microscopy in order to detect whether the PEME treatments with two doses had an effect on the STZ-induced diabetic liver tissues. Pathologically, the liver’s histological structure (Fig. 5A) was normal in the control group (group 1). Fig. 5B shows a liver with complete (severe) destruction of hepatocytes in severe congestion with nuclear condensation, loss of hepatic lobules and congested hepatic inflammation in the diabetic rats. Rats treated with PEME of W. volubilis at the two doses and rats treated with metformin showed no hepatic abnormalities, and the arrangements of the hepatocytes in the liver were almost normal (Fig. 5C, D, E).

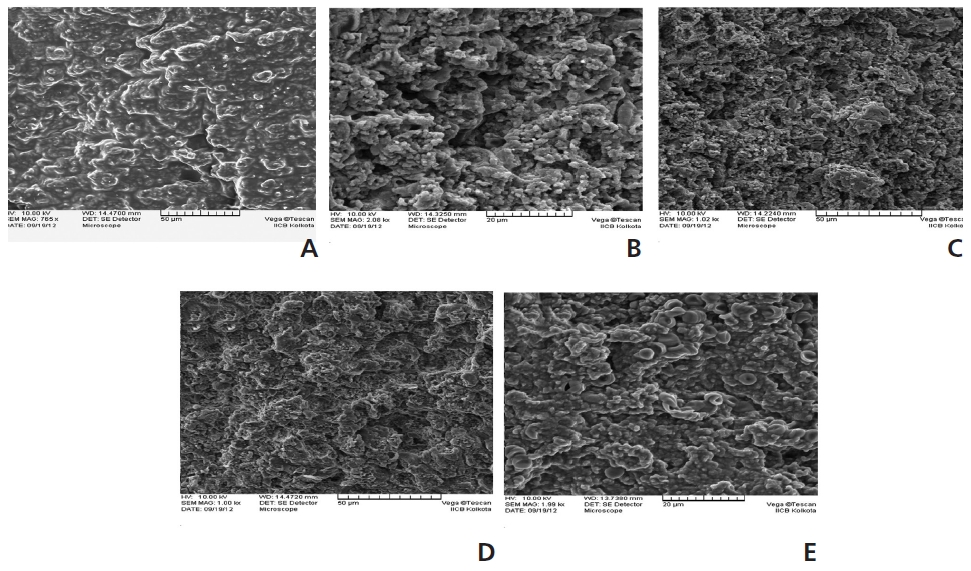
    Fig. 6 shows SEM images of the glutaraldehyde control liver, which had not been exposed to STZ. An analysis of the external membrane of a liver from the saline-treated control group showed a regular lobular architecture in the liver membrane and no signs of surface morphological changes, its having a normal structural appearance. Fig. 6B presents SEM images of livers from STZ-induced diabetic rats. These images show marked changes in the surface morphology of the liver. After STZ exposure, the surfaces of the rats’ livers showed shrinkage and appeared to have variously-shaped aggregated tissue granules with a few major pores. External tissue inflammation was also noted in certain areas. Administrations of PEMEs of W. volubilis and of metformin to diabetic rats protected the majority of the organs. However, a few of the elongated membranes were noted to display no sign of membrane aggregation/ shrinkage. Administrations of PEMEs of W. volubilis and of metformin reversed previous morphological changes in the treated group (Fig. 6C, D and E).

    4. Discussion

    STZ is a nitrosurea, a naturally-occurring, broad-spectrum antibiotic, from Streptomyces achromogenes and a cytotoxic chemical that is particularly toxic to the pancreatic, insulin-producing beta cells in mammals. It enters pancreatic β cells through glucose transporter 2 channels in the plasma membrane, which causes cellular toxicity and local immune responses that lead to hypoinsulinemia and hyperglycemia in animals. STZ-induced hyperglycemia is a commonly-used experimental model to screen the hypoglycemic potency of phytochemicals. Therefore, we investigated whether PEMEs of W. volubilis and metformin had any hypoglycemic action in STZ-induced diabetic rats. However, during the first two days after STZ injection, glycemia rose to the same extent in all treated rat groups, suggesting similar acute STZ toxic effects on the endocrine pancreas. Indeed, the study showed a concentration-dependent effect of the PEMEs of W. volubilis and of metformin in the regulation of blood-glucose levels.

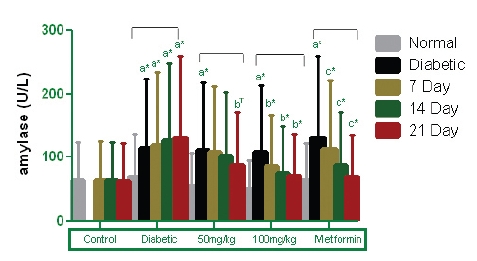
    Amylase is a key enzyme in the digestive system that catalyses the hydrolysis of starch to a mixture of smaller oligosaccharides consisting of maltose, maltotriose, and a number of oligoglucans. These are then acted on by α-glucosidases and are further degraded to glucose, which enters the blood stream. The degradation of this dietary starch proceeds rapidly and leads to elevated postprandial hyperglycemia. Inhibitors of α-amylase delay carbohydrate digestion, thus reducing glucose absorption rates and lowering postprandial serum glucose levels [13]. In order to elucidate the modulatory mechanism of the PEMEs used in this study for the hydrolysis of starch into simple sugars in rats, we focused on the serum α-amylase. The results obtained showed that the administrations of PEMEs of W. volubilis and of metformin to diabetic rats significantly reduced serum α-amylase levels.

    Oxidative stress has been postulated to be an important contributor in diabetes mellitus [14]. During oxidative stress, the reactive oxygen species, which have strong oxidizing ability, damage cellular proteins, causing subsequent changes in serum levels. This action could be due to microproteinuria and increased protein catabolism, which are important clinical markers of diabetes [15, 16]. Another interesting effect of PEMEs of W. volubilis and of metformin was observed in the serum protein levels. As expected, rats fed both PEMEs of W. volubilis and metformin tended to have elevated serum protein levels in comparison to untreated diabetic rats. Administrations of PEMEs of W. volubilis and of metformin to diabetic rats caused a noticeable elevation in serum protein levels during the study period.

    Hyperglycemia over a long time can cause harmful effects in other tissues, especially in the liver, and liver dysfunction has been seen in diabetic patients with uncontrolled blood sugar levels. Liver function tests conducted through blood assays can provide information about the state of liver damage, describing its cellular integrity and its link with the biliary track [17]. The observed elevated level of alanine transaminase may be indicative of hepatic cholestasis [18] or some other pathological variations in the diabetic conditions. Administrations of PEMEs of W. volubilis and of metformin to diabetic rats prevented increases in the alanine transaminase levels during the 21-day study period. Histological examination of selected livers from both treated and control animals showed microscopic changes and morphological disturbances due to STZ administration. The histological changes in diabetic rats were restored to near normal by treatments with PEMEs of W. volubilis and with metformin. Because the morphological features of an organ can yield information about its structure and functions, in the present study, a scanning electron microscopy examination was conducted to show the morphology of the rat liver at an ultra-structural level so as to identify morphological features directly related to impairment of the liver structure in STZ-induced diabetic animals. Morphological alterations, including alterations in the ultra-structure, of the liver have been documented during the diabetic progress and are relatively severe. Under such a liver dysfunction, progressive tissue destruction is shown. In conclusion, we observed a mature, organized structural aspect of the liver, as well as a decreased appearance of organ death, in the rats treated with PEMEs of W. volubilis and with metformin in comparison with the untreated diabetic rats.

    5. Conclusion

    In conclusion, the present study corroborated the beneficial effects of PEMEs of W. volubilis and of metformin in attenuating hyperglycemia by down-regulating elevated levels of serum biochemical parameters. The observed hypoglycemic action could be due to direct or indirect effects on insulin-biosignaling pathways for glucose metabolism, inhibition of gluconeogenesis, peripheral glucose utilization, and intracellular electrolyte homeostasis. Histopathology and SEM results from this study also demonstrated that both PEMEs of W. volubilis and metformin were effective in reducing cellular damage to the liver due to exposure to STZ.

참고문헌
  • 1. Andallu B, Varadacharyulu NC 2002 Control of hyperglycemic and retardation of cataract by mulberry (Morusindica. L) leaves in streptozotocin diabetic rats [Ind J Exp Biol] Vol.40 P.791-795 google
  • 2. Wild SG, Roglic G, Green A, Sicree R, King H 2004 Global prevalence of diabetes: estimates for the year 2000 and projection for 2030 [Diabetes Care] Vol.27 P.1047-1053 google cross ref
  • 3. Kumar S, Malhotra R, Kumar D 2010 Antidiabetic and free-radical scavenging potential of Euphorbia hirta flower extract [Indian J Pharm Sci] Vol.72 P.531-537 google cross ref
  • 4. Kumar S, Rashmi Kumar 2010 Evaluation of antidiabetic activity of Euphorbia hirta Linn. In streptozotocin induced diabetic mice [Indian J Nat Prod Resour] Vol.1 P.200-203 google
  • 5. Eidi A, Eidi M 2009 Antidiabetic effects of sage (Salvia officinalis L.) leaves in normal and streptozotocin-induced diabetic rats [Diabetes Met SynClin Res Rev] Vol.3 P.40-44 google cross ref
  • 6. Pandit R, Phadke A, Jagtap A 2010 Antidiabetic effect of Ficus religiosa extract in streptozotocin-induced diabetic rats [J Ethnopharmacol] Vol.128 P.462-466 google cross ref
  • 7. Tripathi AK, Bhoyar PK, Baheti JR, Biyani DM, Khalique M, Kothmire MS 2011 Herbal antidiabetics: A review [Int J Res Pharm Sci] Vol.2 P.30-37 google
  • 8. Ramachandran V, Mandal D, Payyavala U, Sangai PD, Muthureddy NS, Shanish A 2011 Hypoglycemic, antioxidant and hypolipidemic activity of Asparagus racemosuson streptozotocin induced diabetes in rats [AdvApplSci Res] Vol.2 P.179-185 google
  • 9. Panda N, Banerjee S, Mandal NB, Sahu NP 2006 Pregnaneglycosides [Nat Prod Comm] P.665-69 google
  • 10. Ayyanar M, SankaraSivaraman K, Ignacimuthu S 2008 Traditional herbal medicines used for the treatment of diabetes among two major tribal groups in South Tamil, Nadu, India [Ethnobotanical Leaflets] Vol.12 P.276-280 google
  • 11. Kumarappan CT, Thilagam E, Vijayakumar M, Mandal SC 2012 Modulatory effect of polyphenolic extracts of Ichnocarpus frutescens on oxidative stress in rats with experimentally induced diabetes [Indian J Med Res] Vol.136 P.815-821 google
  • 12. Trinder P 1969 Determination of blood glucose using an oxidase-peroxidase system with a non-carginogenic chemogen [J Clin Pathol] Vol.22 P.158-161 google
  • 13. Tarling CA, Woods K, Zhang R, Brastianos HC, Brayer GD, Andersen RJ 2008 The search for novel human pancreatic alpha-amylase inhibitors: high-throughput screening of terrestrial and marine natural product extracts [Chem Bio Chem] Vol.9 P.433-438 google cross ref
  • 14. Vincent AM, Russell JW, Low P, Feldman EL 2004 Oxidative stress in the pathogenesis of diabetic neuropathy [Endocr Rev] Vol.25 P.612-628 google cross ref
  • 15. Mauer SM, Steffes MW, Brown DM 1981 The kidney in diabetes [Am J Med] Vol.70 P.603-612 google
  • 16. Almdal JP, Vilstrup H 1988 Strict insulin therapy normalizes organ nitrogen contents and capacity of urea nitrogen synthesis in experimental diabetes in rats [Diabetolgia] Vol.31 P.114-118 google
  • 17. Agbaje EO, Adeneye AA, Daramola AO 2009 Biochemical and toxicological studies of aqueous extract of syzigium aromaticum (L.) merr. & perry (myrtaceae) in rodent [Aft J Tradit Complement Alter Med] Vol.6 P.241-254 google
  • 18. Davern TJ, Scharschmidt BF 2002 Sleisenger and Fordtran’s Gastrointestinal and liver disease: pathophysiology, diagnosis, management P.1227-1228 google
이미지 / 테이블
  • [ Fig. 1 ]  Influence of PEME of W.volubilis on fasting blood glucose level in hyperglycemic and non-hyperglycemic rats. Values are expressed as mean ± SD, (n=6). a normal group versus diabetic group; b diabetic group versus PEME treated groups; cdiabetic group versus metformin treated groups. *P < 0.001.
    Influence of PEME of W.volubilis on fasting blood glucose
level in hyperglycemic and non-hyperglycemic rats. Values are expressed
as mean ± SD, (n=6). a normal group versus diabetic group;
b diabetic group versus PEME treated groups; cdiabetic group versus
metformin treated groups. *P < 0.001.
  • [ Fig. 2 ]  Influence of PEME of W.volubilis on serum α-amylase level in hyperglycemic and non-hyperglycemic rats. Values are expressed as mean ± SD, (n=6). a normal group versus diabetic group; b diabetic group versus PEME treated groups. c diabetic group versus metformin treated groups. *P < 0.001; †P < 0.05.
    Influence of PEME of W.volubilis on serum α-amylase level
in hyperglycemic and non-hyperglycemic rats. Values are expressed
as mean ± SD, (n=6). a normal group versus diabetic group; b diabetic
group versus PEME treated groups. c diabetic group versus metformin
treated groups. *P < 0.001; †P < 0.05.
  • [ Fig. 3 ]  Influence of PEME of W.volubilis on serum total protein level in hyperglycemic and non-hyperglycemic rats. Values are expressed as mean ± SD, (n=6). a normal group versus diabetic group; b diabetic group versus treated groups. cdiabetic group versus metformin treated groups. *P < 0.001; †P < 0.05; ‡P < 0.01.
    Influence of PEME of W.volubilis on serum total protein
level in hyperglycemic and non-hyperglycemic rats. Values are expressed
as mean ± SD, (n=6). a normal group versus diabetic group;
b diabetic group versus treated groups. cdiabetic group versus metformin
treated groups. *P < 0.001; †P < 0.05; ‡P < 0.01.
  • [ Fig. 4 ]  Influence of PEME of W.volubilis on serum alanine transaminase (ALT) level in hyperglycemic and non-hyperglycemic rats. Values are expressed as mean ± SD, (n=6). a normal group versus diabetic group; b diabetic group versus treated groups. cdiabetic group versus metformin treated groups. *P < 0.001.
    Influence of PEME of W.volubilis on serum alanine transaminase
(ALT) level in hyperglycemic and non-hyperglycemic rats.
Values are expressed as mean ± SD, (n=6). a normal group versus diabetic
group; b diabetic group versus treated groups. cdiabetic group
versus metformin treated groups. *P < 0.001.
  • [ Fig. 5 ]  Histopathology examinations of rat liver sections of (A) control rat, (B) diabetic rat, (C) PEME treated rats (50 mg/kg body weight), (D) PEME treated rats (100 mg/kg body weight) and (E) metformin treated rat (250 mg/kg body weight). H: Hapatocytes; Ha: Hepatic artery; Lv: Lymphatic vessel; PV: Portal vein; Pt: Portal track; Bd: Bile duct.
    Histopathology examinations of rat liver sections of (A) control rat, (B) diabetic rat, (C) PEME treated rats (50 mg/kg body weight), (D)
PEME treated rats (100 mg/kg body weight) and (E) metformin treated rat (250 mg/kg body weight). H: Hapatocytes; Ha: Hepatic artery; Lv:
Lymphatic vessel; PV: Portal vein; Pt: Portal track; Bd: Bile duct.
  • [ Fig. 6 ]  SEM examinations of rat liver sections of (A) control rat, (B) diabetic rat, (C) PEME treated rats (50 mg/kg body weight), (D) PEME treated rats (100 mg/kg body weight) and (E) metformin treated rat (250 mg/kg body weight).
    SEM examinations of rat liver sections of (A) control rat, (B) diabetic rat, (C) PEME treated rats (50 mg/kg body weight), (D) PEME
treated rats (100 mg/kg body weight) and (E) metformin treated rat (250 mg/kg body weight).
(우)06579 서울시 서초구 반포대로 201(반포동)
Tel. 02-537-6389 | Fax. 02-590-0571 | 문의 : oak2014@korea.kr
Copyright(c) National Library of Korea. All rights reserved.