Molecular studies have shown geographic diversity in the genetic associations of several marine taxa. Some marine species appear to be panmictic across large geographic ranges (Lessios et al., 2003; Klanten et al., 2007; Horne et al., 2008; Reece et al., 2010), whereas others exhibit genetic heterogeneity on a small scale (Barber et al., 2006; Gerlach et al., 2007). These genetically driven mechanisms are affected by geography, and may be influenced by dispersal and self-recruitment that are determined by oceanographic features such as sea currents, hydrological conditions, and physical barriers (Doyle et al., 1993; Hsieh et al., 2010; Hong et al., 2012). Sea currents can have dynamic effects on the population genetics of marine invertebrates, and ocean currents are responsible for planktonic larvae dispersion on a large scale. Alternatively, currents can be an invisible physical barrier to gene flow (Palumbi, 1994).
Pollicipes mitella (Crustacea, Maxillopoda, Cirripedia, Thoracica) is a type of barnacle. Barnacles are a major crustacean group and live on intertidal zone rocks, shells, and other hard substrates (Lim and Hwang, 2006). The genus Pollicipes is distributed in the South and East China Seas (Chan, 2006). The geographical distribution and abundance have been affected by climate and oceanographic conditions, including currents and upwelling events (Chan, 2006). Unfortunately, the intertidal community dynamics and distribution of P. mitella in Korean coastal areas have not been investigated extensively. The south coast intertidal area has a highly abundant population of this species, but the northern portion of the east Korean coastline has an extremely low population density.
The larvae of some marine organisms, including barnacles, have high dispersal potential in contrast to the extremely limited mobility of the adults (Lewis, 1975; Sotka et al., 2004).
Pollicipes pollicipes have a planktonic larvae stage of greater than 1 month before they sufficiently develop to settle into their sessile life stage (Molares et al., 1994). The larval dispersal pattern can lead to homogeneity in geographically distinct regional populations. Lewis (1975) estimated that the dispersal range of P. pollicipes is 185-930 km, which is limited compared to California Current Balanus glandula larvae, which have an estimated dispersal range around several hundred kilometers (Sotka et al., 2004).
Population genetic studies of marine organisms based on molecular markers have been used to infer larval dispersal mechanisms, with significant information gained on population structure and genetic diversity. Nucleotide sequences of maternally inherited mitochondrial DNA (mtDNA) genes are useful to investigate interspecific and intraspecific genetic diversity among closely related taxa, species, or populations (Wilson et al., 1985; Avise, 1994). Few studies have used population genetic data to determine the dispersal patterns of barnacles. The population genetics of P. pollicipes in the northeastern Atlantic (Quinteiro et al., 2007), the range of Tetraclita rubescens from Bahia Magdalena to Cape Mendocino (Dawson et al., 2010), and Tetraclita squamosa in East Asia (Chan et al., 2007) are influenced by coastal currents and hydrological barriers. However, the relationship between Korean coastal marine mammal intraspecific population genetics and sea current patterns is poorly understood. Here, we investigate the relationship between the dispersal of planktonic larvae and ocean structures by assaying genetic population data of P. mitella, a marine invertebrate with a long planktonic larval stage and a well-documented life history.
In this study, we used a population genetic analysis based on mitochondrial sequence variations in P. mitella populations in the South and East Sea of Korea to understand the patterns of dispersion of its planktonic larvae by coastal currents.
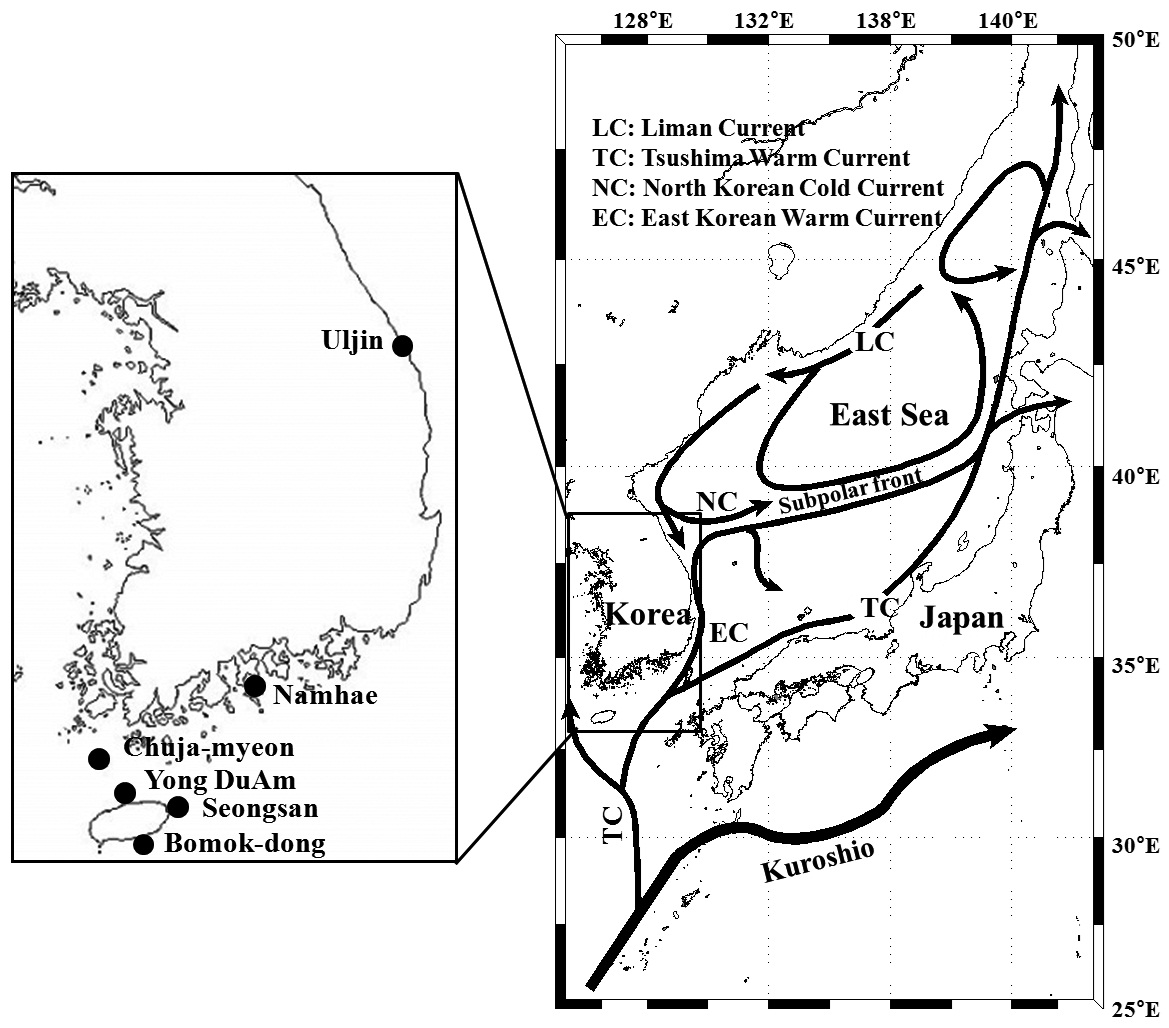
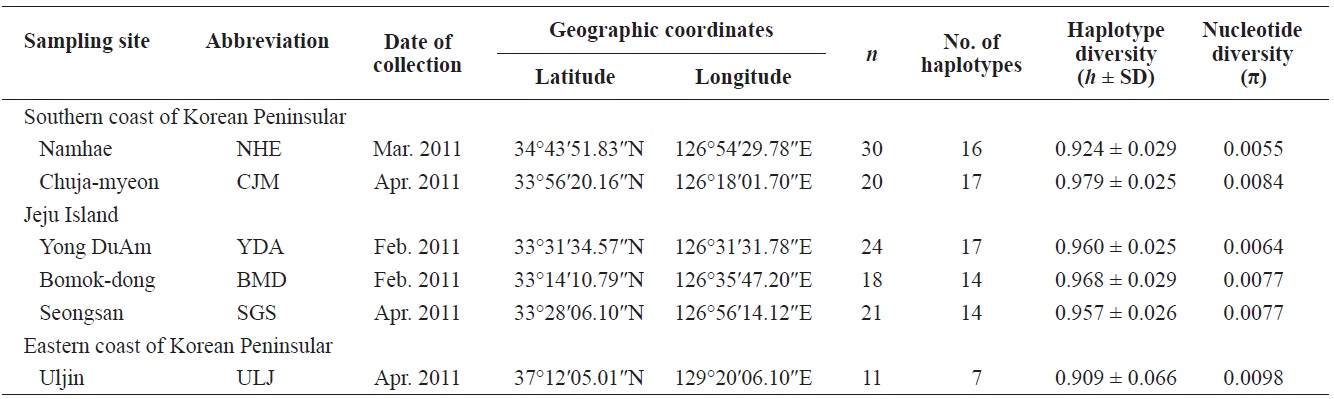
Pollicipes mitella samples were collected from six rocky shore sites located in the eastern (one site) and southern (two sites) coastal zones of Korea, and on Jeju Island (three sites) in 2011 (Table 1, Fig. 1). The samples were stored at –20℃ or kept in 100% ethanol at room temperature until analysis. Due to the extremely low density and to conserve the natural population in the northern east coastline sample (Uljin [ULJ]), sample collection was limited to 300 m2 areas and only 11 samples were found in the collecting area.
Genomic DNA was extracted using the conventional sodium dodecyl sulfate/proteinase K method, followed by organic extraction and ethanol precipitation (Sambrook and Russell 2001). The purified DNA was dried at room temperature and dissolved in TE buffer (10 mM Tris-HCl, 1 mM EDTA, pH 8.0). PCR was used to amplify the COI gene with newly designed primers based on the complete mitogenomic sequence of P. mitella (Lim and Hwang, 2006) available in GenBank (AY514042): MitellCOIF (5′-AGACATTATCGCGACAATGATTA-3′) and MitellCOIR (5′-GGCACGAGTATCCACATCCATT-3′). PCR amplification was performed with a DNA Engine thermocycler (MJ Research, Tokyo, Japan) in 20-µL volumes containing 1-2 µL of genomic DNA, 2 µM of each primer, 0.25 mM of each dNTP, 1 unit of Takara LA TaqTM DNA polymerase (Takara Shuzo, Shiga, Japan), and 2 µL of 10× LA TaqTM reaction buffer (Takara Shuzo). The PCR protocol was as follows: preheating to 94℃ for 5 min followed by 35 cycles of denaturation at 94℃ for 30 s, annealing at 55℃ for 30 s, extension at 72 ℃ for 30 s, and a final extension at 72℃ for 5 min. The PCR product size was verified by 1.5% agarose gel electrophoresis and ethidium bromide staining. The PCR product was purified using the AccuPrep PCR Purification Kit (Bioneer, Daejon, Korea). After cycle sequencing with the ABI PRISM BigDyeTM Terminator v3.1 Cycle Sequencing Ready Reaction Kit (Applied Biosystems Inc., Foster City, CA, USA), the purified PCR product was directly sequenced on an ABI 3730xl DNA Analyzer (Applied Biosystems Inc.) with the same PCR primer set, allowing direct nucleotide sequence analysis of about 500 base pairs (bp) from the P. mitella COI gene.
The sequence data were aligned with DnaSP version 4.90.1 (Rozas and Rozas, 1997) to determine the COI gene haplotypes. Haplotype diversity (h) and nucleotide diversity (π)
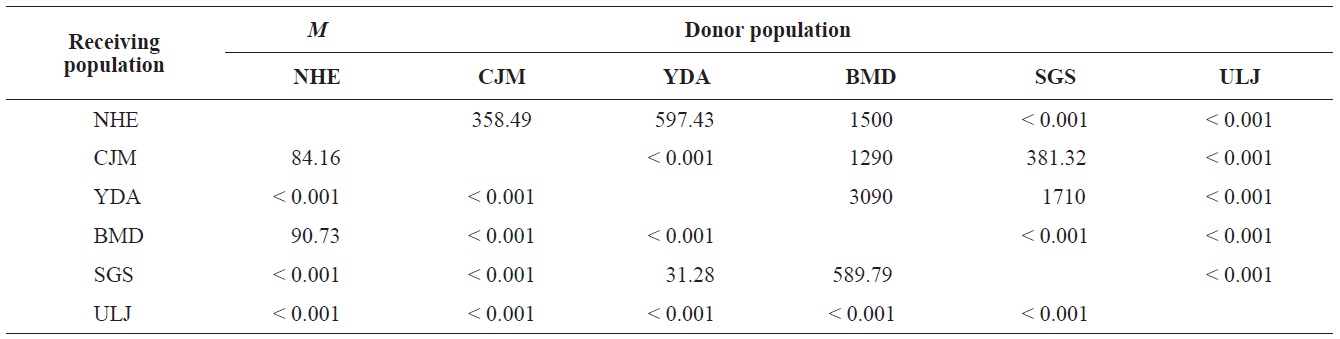
within populations were estimated according to Nei (1987), based on Kimura’s two-parameter distance method using K and DA in the REAP software (McElroy et al., 1992). Genetic relationships among the 59 haplotypes of Pollicipes mitella were reconstructed using the neighbor-joining method, generated with the SEQBOOT and NEIGHBOR options in PHYLIP v. 3.6 (Felsenstein, 1993). A bootstrap analysis of 1,000 replicates evaluated the phylogenetic relationships after genetic distance matrix construction based on nucleotide divergences between haplotypes estimated according to Nei (1987) and the Kimura two-parameter model (Kimura, 1980). Bootstrap supports of>50% in the 1000 replicates were shown. Neighbor joining was performed and the consensus tree was generated for populations based on haplotype frequencies and average nucleotide diversities between populations (Saitou and Nei, 1987). The consensus tree was generated following the 50% majority rule by CONSENSUS in PHYLIP v. 3.6 (Felsenstein, 1993). Pairwise population FST values were calculated to estimate genetic differentiation between populations according to Slatkin and Hudson (1991) and Tajima and Nei (1984) using the Arlequin software version 3.1 (Excoffier et al., 2005). The significance of each FST value was tested using 10,000 random permutations. Analysis of molecular variance (AMOVA) tested population structure with Arlequin ver. 3.1. Migration among the six populations, based on mtDNA sequences, was evaluated using the software MIGRATE, version 2.4.2 (http://popgen.dcd.fsu.edu/Migrate-n.html) (Beerli and Felsenstein, 2001). Migration rates (M) were estimated with a maximum-likelihood approach based on the coalescence theory, and were used to investigate possible genealogies based on migration events using a Markov chain Monte Carlo approach with 10 short chains (500 trees used of the 50,000 trees sampled), and three long chains (10,000 trees used of the 1,000,000 trees sampled). For each chain, the first 10,000 steps were used as the burn-in, and adaptive heating was used to ensure an independent parameter space.
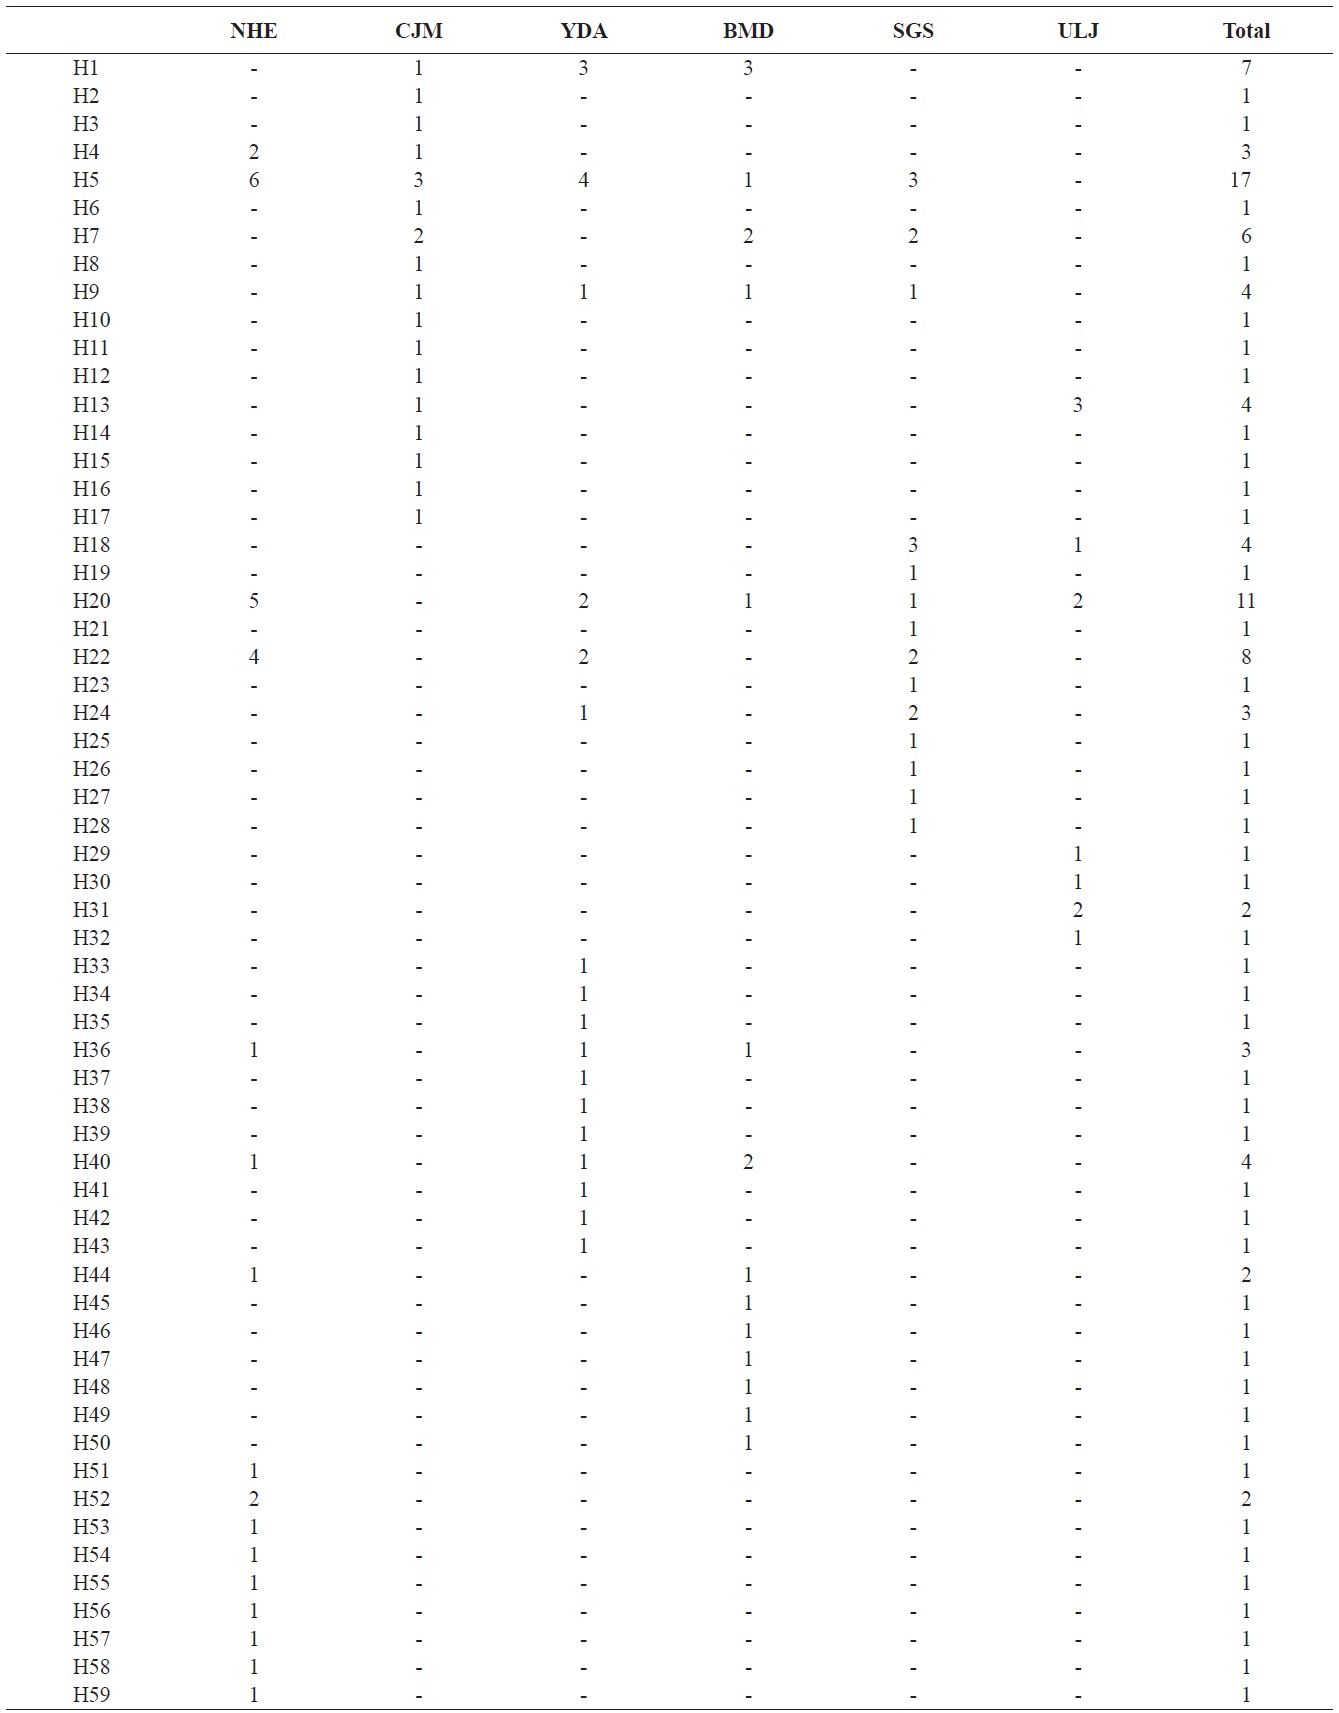
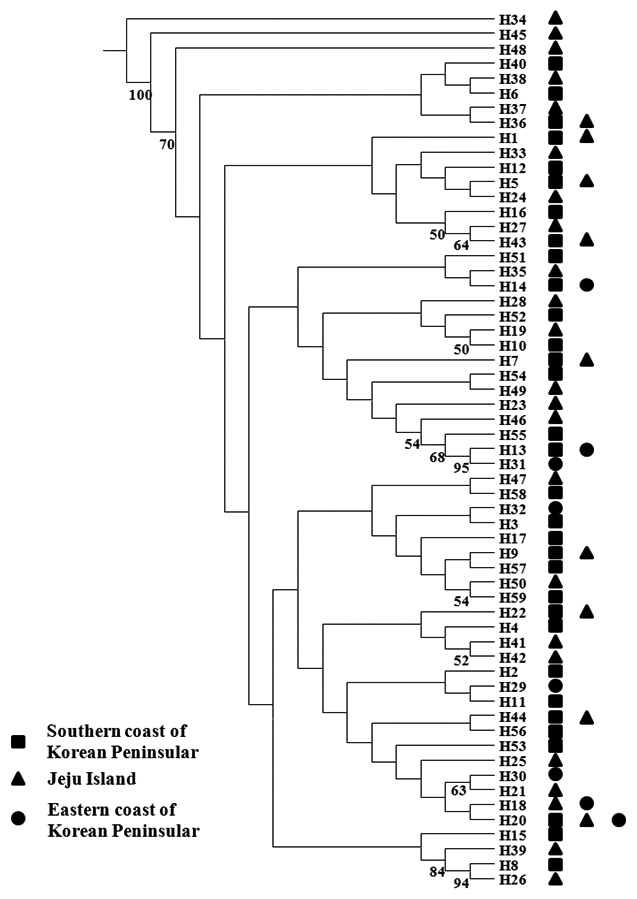
We analyzed a 514-bp fragment at the 5′ end of the mtDNA COI region in 124 Pollicipes mitella individuals from six populations and defined 59 haplotypes (Fig. 2). The neighbor-joining tree constructed using the haplotypes was shallow and provided no evidence of geographic associations (Fig. 2). Among the haplotypes, 44 were found at single localities, and the remaining 15 were observed in two or more locations (Table 2). This suggests a rapid population expansion with considerable sequence differences and/or high gene flow among populations.
Haplotype diversity (h) was high in all populations, ranging from 0.909 ± 0.066 (ULJ) to 0.979 ± 0.025 (Chuja-myeon [CJM]). Nucleotide diversity (π) was low, ranging from 0.0055 (Namhae[NHE]) to 0.0098 (ULJ) (Table 1), implying that haplotypes with recently diverged nucleotides have been distributed among populations or regions by long-range larval dispersal. The extensive haplotype diversity and limited nucleotide diversity of P. mitella populations demonstrated in the present study also indicate rapid population growth from an ancestral population with a small effective population size. This is provided that there was sufficient time for haplotype variation recovery via mutation yet not enough time for large sequence difference accumulations (Avise, 2000).
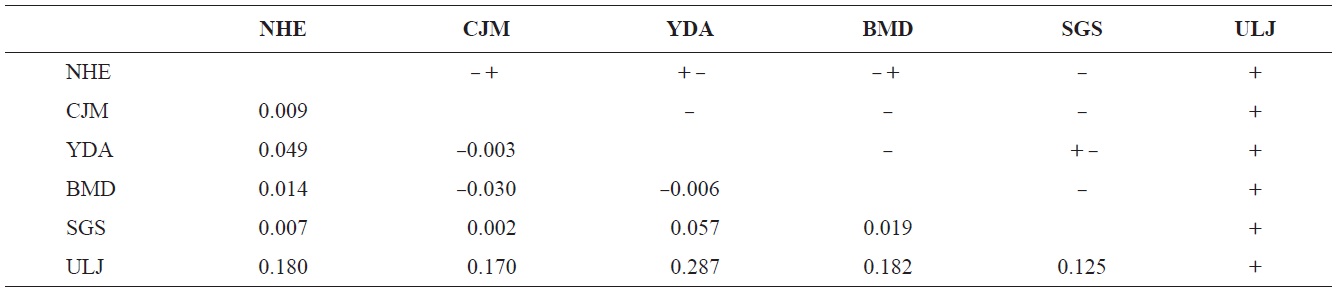
The pairwise population FST estimates made with an exact test were generally low (Table 3), suggesting little genetic differentiation between population pairs, perhaps attributable to high gene flow. The calculated migration rates also indicate substantial gene flow has occurred among these populations, except between ULJ and all other populations
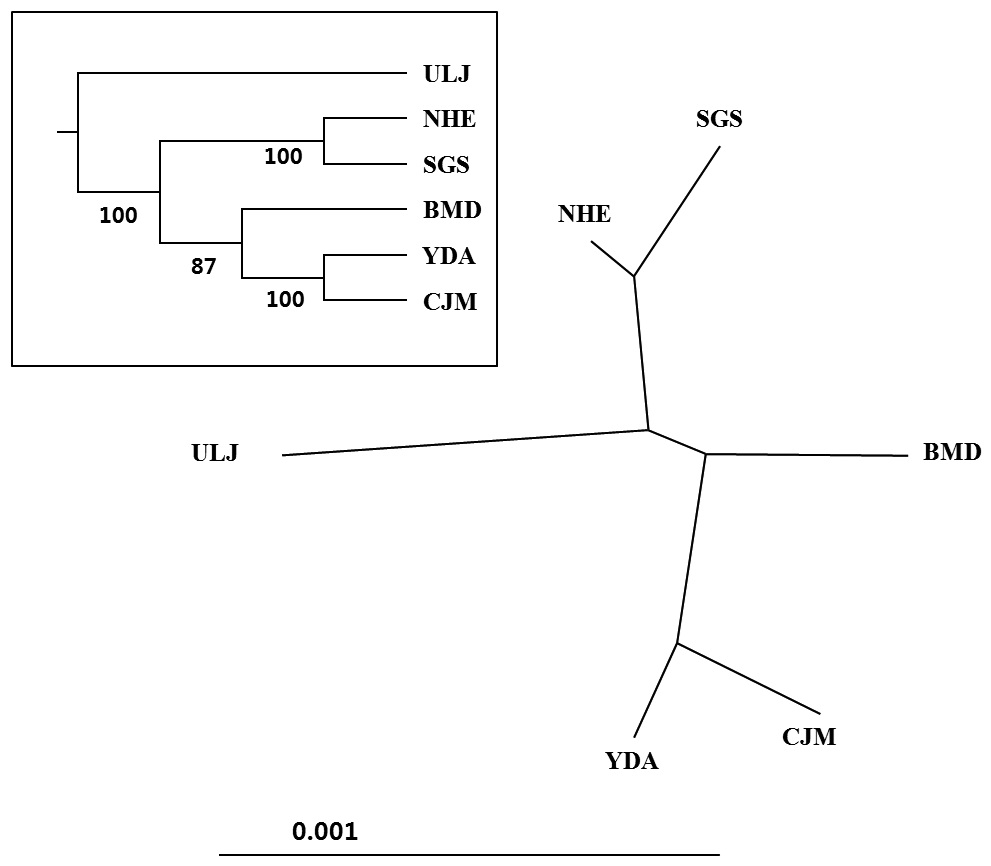
(Table 4). The Tsushima Warm Current (TWC) diverges from the Kuroshio Current, with the main flow via Jeju Island and the South Sea entering the southern part of the East Sea west of the Korean peninsula (Senjyu, 1999; Ichikawa and Beardsley, 2002). The TWC may transport larvae from Jeju Island toward the south coast of the Korean peninsula, near NHE and CJM. The distribution of the 59 haplotypes among the six P. mitella populations is presented in Table 2. Although the observed haplotypes had no geographically specific clusters, 57 different haplotypes were found in the five southern populations (NHE, CJM, Yong DuAm [YDA], Bomok-dong [BMD], and Seonsan [SGS]), while 4 different haplotypes were found in the ULJ populations. A number of individuals from almost all populations had H5, H7, H9, H22, H36, and H40, but these were not found in ULJ barnacles. These results show that composite haplotypes were not distributed randomly with respect to geography. Thus, this may lead to genetic differences between ULJ and other populations. The pairwise population FST estimates (made with the exact test) between Uljin (ULJ) and all the other populations were relatively large (0.125 to 0.287, P<0.05), compared with all other population pairs (-0.003 to 0.057) (Table 3). This assumption is also supported by the neighbor-joining method
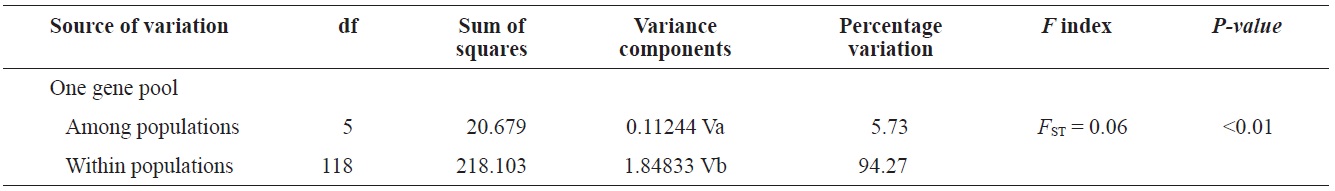
(Fig. 3), and low M migration rates between ULJ and all other populations (P<0.001) compared with those between all other population pairs (Table 4). This suggests not only low or restricted dispersal and gene flow between the southern and eastern coast of Korea but also that shallow and significant population subdivisions exist on a small spatial scale in Korean coastal waters. This, along with the AMOVA results, supports the possibility of substructures among the P. mitella populations (Table 5). Population structuring of some marine species can be caused by oceanic barriers to gene flow, such as sea currents (Machado-Schiaffino et al., 2010; Hong et al., 2012; Kim et al., 2012). The subpolar front in the East Sea is similar to the western boundary current, in that the polar front forms at the boundary between low-temperature, low-salinity waters in the northern region and the high-temperature, high-salinity waters in the southern region (Rhein et al., 1995; Pickart et al., 1997). The subpolar front, which extends along the coast of Japan before turning abruptly at the Noto Peninsula frontal region towards the center of the East Sea, has a close relationship with the TWC and cold-water currents, including the Northern Korea Cold Current and the Liman Current (Senjyu, 1999; Ichikawa and Beardsley, 2002). The ULJ population is located at the subpolar front, where the cold and warm currents of the East Sea meet. The genetic differentiation of the ULJ population from the other wild populations might be explained by the balanced effects of the cold (Northern Korea Cold Current and Liman Current) and warm (TWC) water currents in the East Sea. Our results show an unusual genetic variation pattern for a species with a large dispersal potential. Because P. mitella populations do not show decreasing levels of genetic diversity (a high level of genetic diversity within all populations examined) with increasing latitude, the population-level heterogeneity of these low dispersers probably reflect the present-day gene flow pattern rather than historical dispersal events, such as glacial isolation and dispersal in Korean coastal waters.
In conclusion, our data indicate that P. mitella populations in Korean coastal waters have limited population substructures and high gene flow levels influenced by sea currents. Although a limited number of samples were obtained in the northern region, other ocean structures and dynamics, including current boundaries and hydrographic conditions, have led to reproductive and partial genetic isolation. We demonstrated that the genetic variation analysis in the mtDNA COI sequences is a useful model for researchers conducting population-level studies of closely related species. The sea has warmed by 0.037℃ during the last 50 years (Levitus et al., 2005). This warming trend should have affected populations of marine organisms in the study area. This environmental change may have a direct or indirect impact on recruitment, growth, and survival of some crustaceans (Cooley and Doney, 2009). Many previous studies demonstrate the importance of monitoring adaptive genetic change in natural populations for conservation (Allendorf et al., 2010). This genetic information resulting from the sea current conditions surrounding P. mitella will be useful in developing subsequent ecological monitoring protocols. The present study did not thoroughly investigate the genetic structure of populations, including the west coast of the Yellow and East Seas, in Korean coastal waters. Further analyses of other genetic markers, such as microsatellite loci, and studies with larger sample sizes and more populations from the aforementioned areas would facilitate identification of gene flow patterns in P. mitella


![FST values between populations (below the diagonal) and probability of differentiation (with P-values for FST estimates and Fisher’s exact test [above the diagonal]).](http://oak.go.kr/repository/journal/12964/E1HKAL_2013_v16n4_243_T003.jpg)