Breast cancer is a malignant tumor that starts from cells of the breast and is a common cancer in females. The incidence of breast cancer in Korea has increased three-fold since 1983. It is the second leading cancer causing mortal death of Korean women after stomach cancer.1 Although the causes of breast cancer are still unknown, there are many risk factors associated with breast cancer. An inherited gene abnormality is associated with a relatively higher risk for developing the disease.2 Prolonged, uninterrupted exposure to estrogen can increase breast cancer risk and both normal and abnormal breast cell growth are stimulated by the presence of estrogen.3 Additionally, smoking, diet, and stress have been associated with the elevation of breast cancer risk.4 Fortunately, if the disease is discovered early, patients have more treatment options and a better chance for long-term recovery. Many researchers have accordingly tried to find early diagnostic biomarkers using various omics tools.
Biomarker discovery is a non-invasive method to find relevant markers rapidly without detailed insight into mechanisms of a given disease. By screening many possible biomolecules simultaneously, techniques based on genomics and proteomics have been used to pursue high-throughput screening. However, genomics and proteomics assignments are not specific enough to describe biochemical functions and underlying biological roles. A comprehensive analysis in which all metabolites of a biological system are identified and quantified is needed. Such an approach is called metabolomics.5 Metabolomics is the characterization of the function of genes and cellular responses in cells, organs, and biological fluids by profiling changes in metabolites generated under specific conditions. The goals of this field are to find the alteration of metabolites in disease, develop a new drugs, and prevent disease and provide early diagnosis.6 Metabolic profiling, one of the tools of metabolomics, offers a means to detect and characterize a large number of substances simultaneously, find new and unexpected substances, determine the changes in the ratio of different components, and give precise information, for instance, on steroid hormones or organic acids, compared to a single test or a group test.
In this study, we used urine samples from clinically diagnosed breast cancer patients and healthy volunteers for comparison and identified novel urinary biomarkers for breast cancer. Metabolic profiling of endogenous steroids (androgens, estrogens and corticoids), nucleosides, and polyols that elevate breast cancer risk was performed by gas chromatography-/ liquid chromatography-mass spectrometry, and quantified data were subsequently analyzed by a multivariate data analysis. Although most metabolomics studies employed mice or cell lines, there have been few reports involving human urine, especially using mass spectrometry. The intensity of any metabolite can directly be compared to the intensity of the same metabolite in another sample. The difference may be characteristic of a specific disease. Mass spectrometry coupled with a chromatographic technique has been utilized to quantify physiological compounds of metabolic pathways. Data collected from patients with breast cancer and controls were process and then analyzed by a partial least squares discriminant analysis (PLS-DA) to discover urinary biomarkers.
>
Patients and sample collection
Patients with a diagnosis of invasive breast cancer (n = 6, age = 43.83 ± 7.28) and subjects with no evidence of invasive breast cancer as normal controls (n = 11, age = 49.75 ± 6.85) visited Samsung Hospital and College of Medicine, Hanyang University, Seoul, Korea. The study protocol was approved by the ethical committee of Hanyang University and Samsung Medical Center, Seoul, Korea, and informed consent was obtained from each subject. All cases and controls in this study underwent the same diagnostic procedures, i.e., breast physical examination, mammography, and ultrasonography according to the American Joint Committee on Cancer staging system.7 Breast cancer patients were predominantly stage IIa. Most urine samples for patients were collected within a week before mastectomy and within a month after mastectomy. Urine samples from patients and controls were stored at −20℃ in a freezer for further analysis. The urinary creatinine value was measured by the Jaffe method.
Endogenous steroids (12 androgens, 12 corticoids, and 13 estrogens) in urine samples of breast cancer patients and controls were analyzed by Hewlett-Packard GC-MS systems consisting of a model 5890A GC, 5970B mass-selective detector, and a HP 59970C MS Chemstation.8,9 Fourteen of nucleosides in urine samples were analyzed by a column-switching HPLC system using a Shiseido Nanospace SI-2 HPLC system model 3001 (Shiseido Co., Tokyo, Japan) equipped with an auto injector (200 mL loop; model 3023) and a dual, six-way switching value unit (model 3012).10 Additionally, urine samples for the quantification of polyols were analyzed by a simultaneous measurement method using GC-MS.11 Names and ID numbers of targeted metabolites are listed in Table 1. Standard mixtures of each targeted metabolite were first analyzed to obtain a linear calibration curve to quantify targeted metabolites. The linearity of each calibration curve hit the high regression coefficients.
Endogenous steroids in urine samples were extracted with an organic solvent after enzymatic hydrolysis, and polyols were diluted with distilled water. The extracted residues were derivatized by a previously described method.8,9,11 The nucleosides in the urine sample were centrifuged, filtered, and directly analyzed by column-switching HPLC-positive ionization tandem mass spectrometry as described previously.10
For data acquisition, G170AA Chemstation version A.03.00 and Xcalibur 2.0 SR2 were used for analysis of GCMS and LC-MS, respectively. To identify targeted metabolites, several chromatograms were evaluated using selective mass ion based on the retention time and m/z (ratio of mass to charge). Using script macro programming performed on Chemstation software, the integrated area of a selected ion mass that is able to quantify the targeted metabolite was calculated. Each calculated area was divided by the area of an internal standard in a single run to compensate analytical errors in the same batch. The relative area of the targeted metabolites was used to calculate their quantitative concentrations using the linear calibration curve. The micro molar concentration (μmol/L) of the targeted metabolites was the calibrated by the gram of urinary creatinine concentration. When data were missing for detection, it was considered as a blank for further treatment of missing value. All data manipulation was performed by Matlab version 7.0.4 R14 (The Mathworks Inc.) and an Excel spread sheet (Microsoft Inc. WA). Each metabolite was statistically evaluated by a student t-test (p<0.05).
Data acquired from a study of metabolomics showed a high dimension of measured parameter and a low dimension of designed experiments, which characterize
[Table 1.] Targeted Metabolites Analyzed by GC-MS and LC-MS
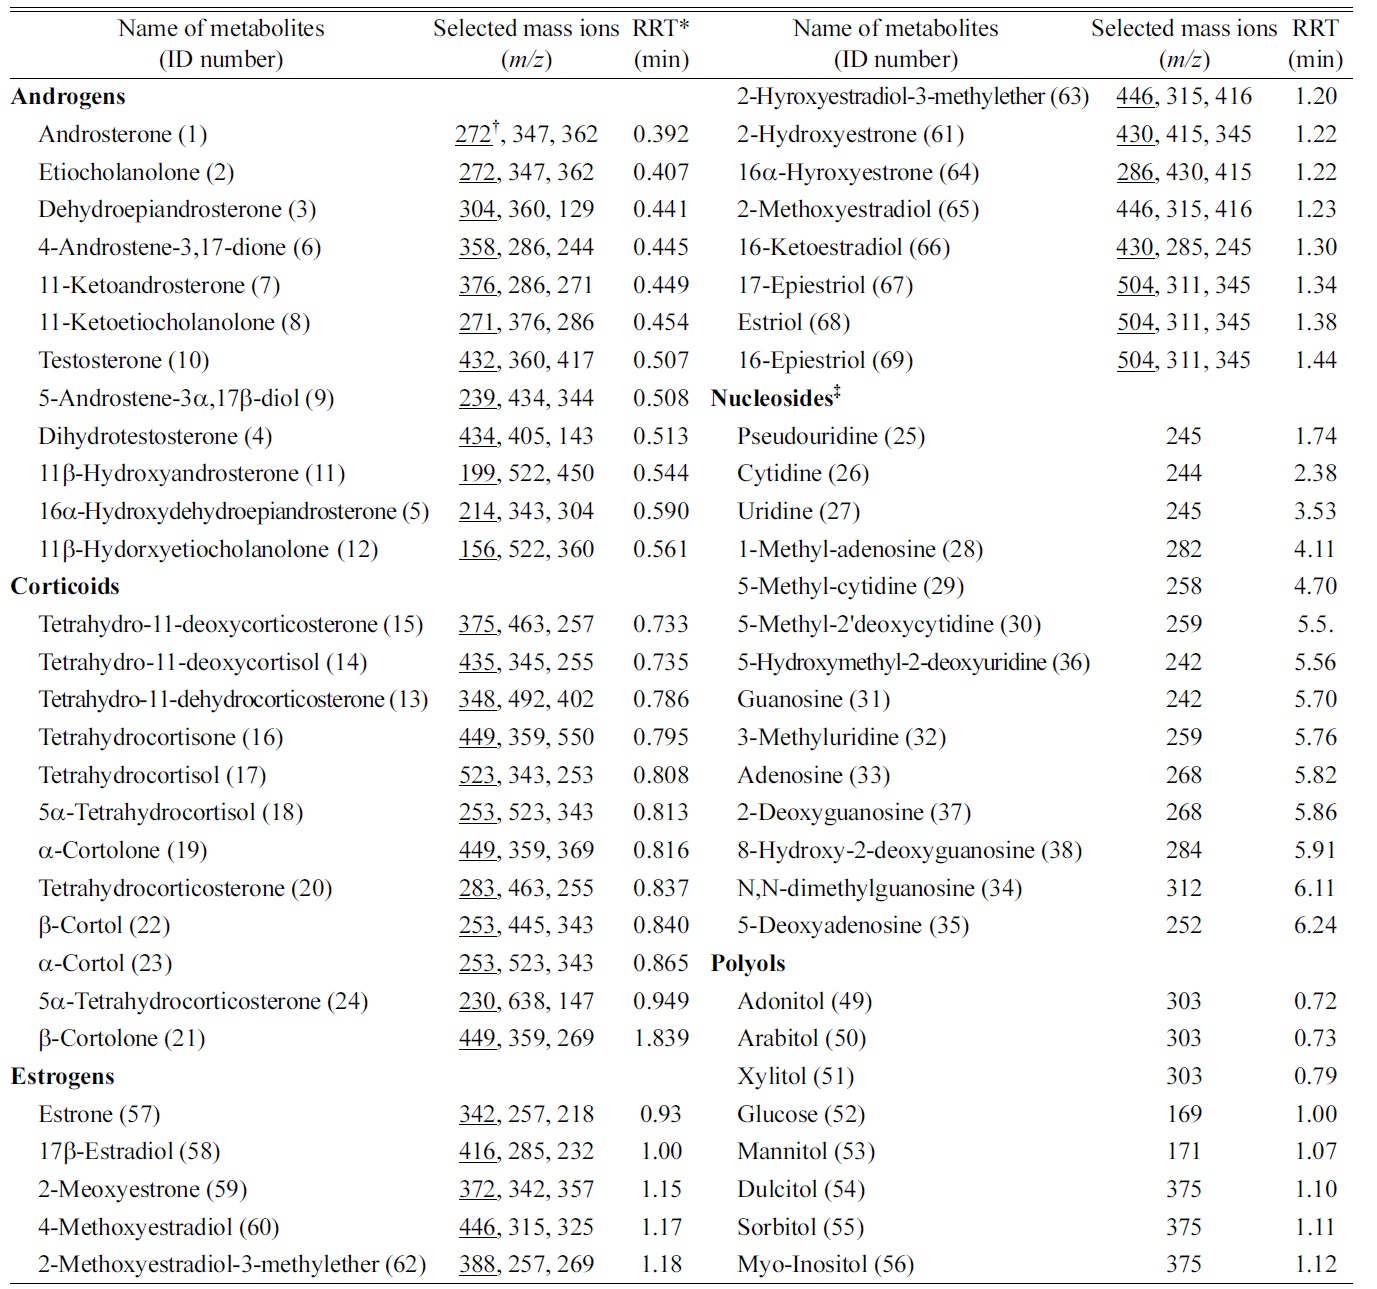
Targeted Metabolites Analyzed by GC-MS and LC-MS
multivariate data in a single batch experiment. This is not well described to find the statistical results by a univariate data analysis such as the student t-test or ANOVA due to the lack of consideration of cross-data implementation. Therefore, for analysis of a metabolomic study, multivariate data analyses such as the principle component analysis (PCA) as an unsupervised method and partial least square– discriminant analysis (PLS-DA) as a supervised method are more adaptable to classified disease groups.12,13 PLS-DA maximizes the covariance between the predicting data sets, the concentration of targeted metabolites and the class assignment, respectively. In this study, we used SIMCA software (Umetrics Inc. Sweden) to analyze metabolite profiles for breast cancer patients and normal controls. Urinary concentrations normalized by gram of creatinine concentration were scaled and centered prior to PCA and PLS-DA. For the analysis with the supervised method, PLS-DA, the statuses of breast cancer patients and normal controls were set to individual classes for the prediction of modeling and visualization of results.
[Table 2.] Quantification of statistically significant targeted metabolites
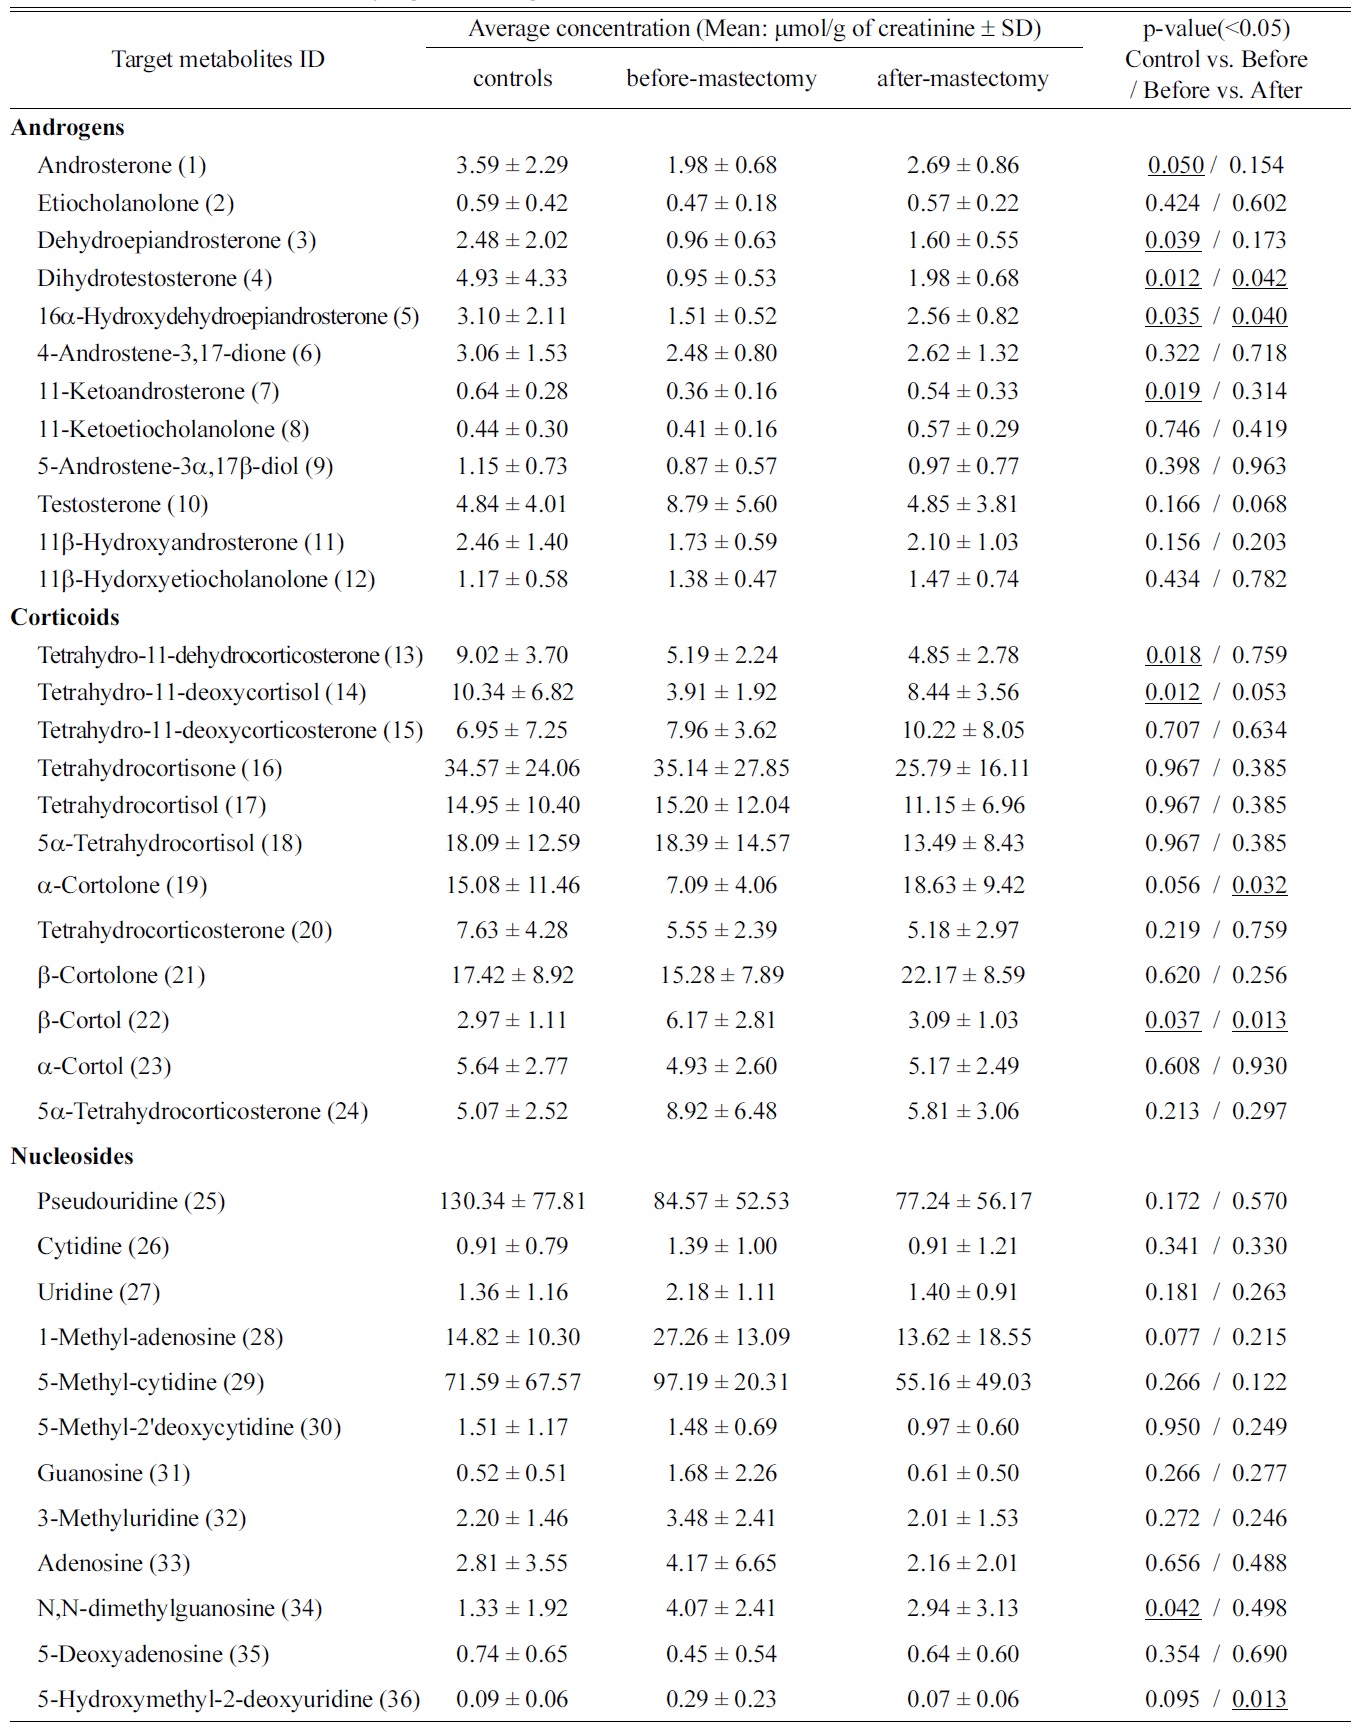
Quantification of statistically significant targeted metabolites

Continued
>
Quantification of targeted metabolites using GC-MS and LC-MS
For the metabolic profiling of endogenous steroids, which are risk factors for breast cancer, 11 androgens, 11 corticoids, and 13 estrogens in urinary samples were quantified in our previous works.8,9 In addition, 14 nucleosides and 8 polyols were also analyzed by previously described the methods.10,11 The concentrations of metabolites were quantified by their linear regression curve, resulting in good linearity with a regression coefficient of over 0.99. Data from sets of control vs. before-mastectomy and before- vs. after-mastectomy are shown in Table 2. The concentrations of 15 targeted metabolites among these targeted metabolites for the control group and patients changed statistically significant by a student t-test (
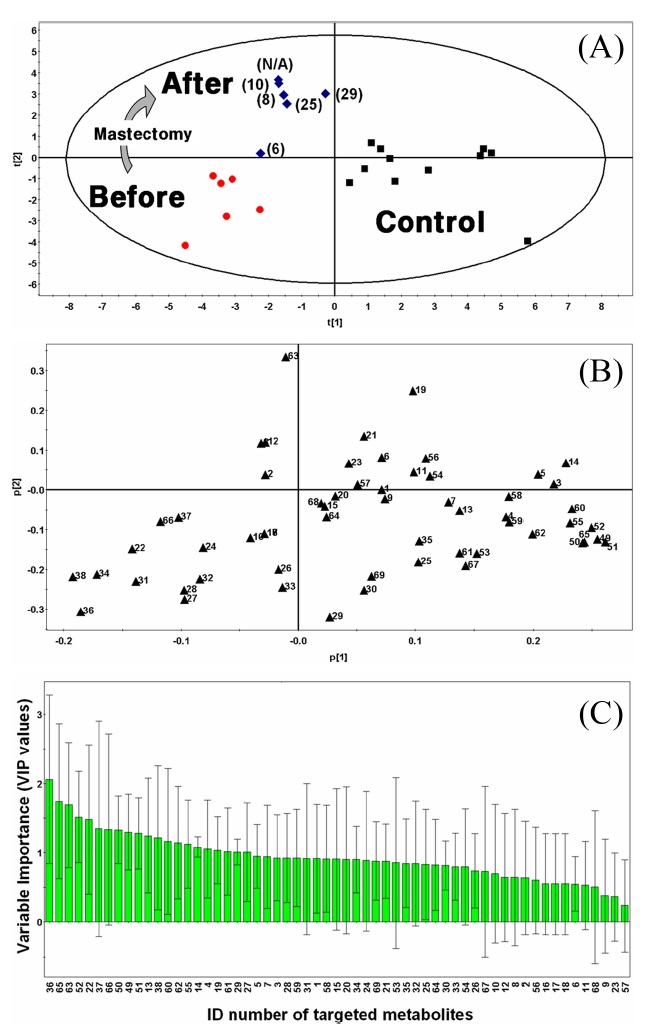
Subjected to an inter-group analysis, normalized data of controls and patients (before- and after-mastectomy) were combined into a single datasheet for PCA and PLS-DA. Using SIMCA software, PCA as an unsupervised method and PLS-DA as a supervised method were conducted to discriminate metabolic profiles from urinary samples (Figure 1). The metabolic pattern obtained using PLS-DA provided clear classification between the control group and the patients group than that obtained with PCA (figure not shown). Among the results of a multivariate analysis using each of
these methods, PLS-DA showed a better result with checking by the fraction of the variation of the variable Q2VY = 0.32 as estimated by cross validation than the results of PCA (figure not shown). The PLS-DA score plot for the control groups and breast cancer patients is illustrated in Figure 1A. The first component t[1] (the fraction of the variation of the response R2VY = 0.44) and the second component t[2] (R2VY = 0.36) of the score plot were fully able to discriminate before-mastectomy patients from controls. Targeted metabolic profiles in the urine of patient’s before-mastectomy were displayed in the third quarter while those of patient’s after-mastectomy were shown in the second quarter. Metabolic profiles for the control group were distributed around the positive t[1] axis. Also, we found that the metabolic patterns from the state before-mastectomy were restored after-mastectomy relative to those of the controls. As shown in Figure 1A, the later urine for the after-mastectomy group was collected, the greater the similarity of the metabolic pattern to that of the control.
>
Identification and validation of biomarkers
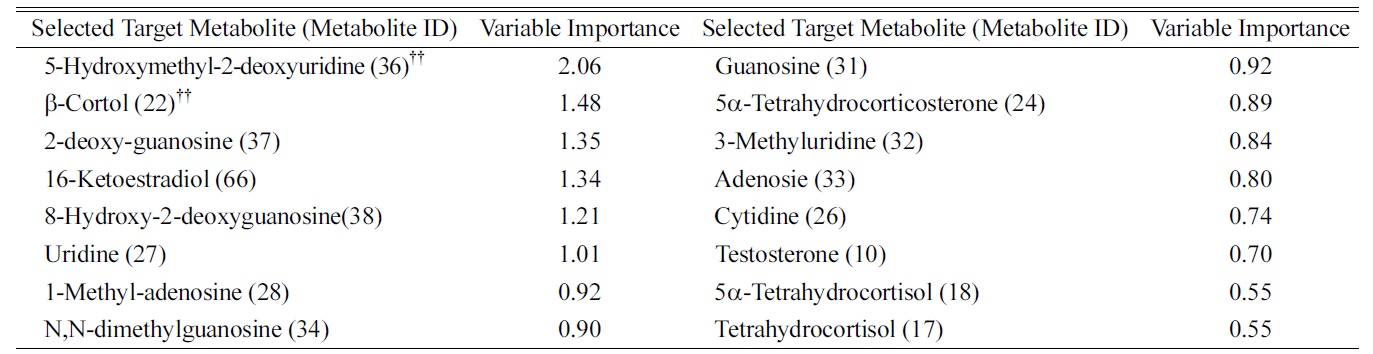
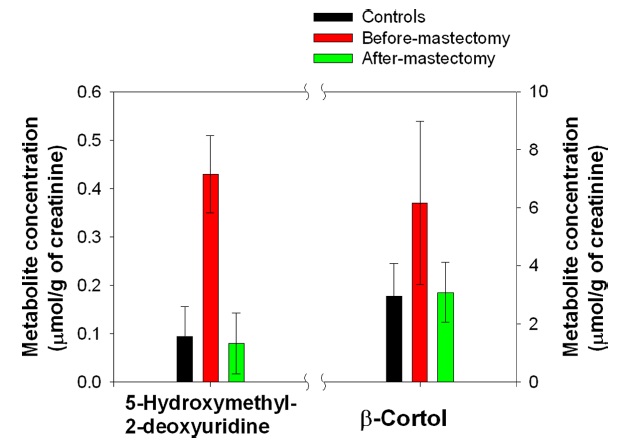
We defined the pool of targeted metabolites in endocrinal metabolism and investigated the correlation between the metabolic pattern and the targeted metabolites to discover possible biomarkers for breast cancer in urine. Using targeted metabolomics, we selected several possible urinary biomarkers for breast cancer by interpreting the geometrical relation and statistical analysis of both the PLS-DA score plot and loading plots (Figures 1A and B). We were interested in particular metabolites in the region of the before-mastectomy patient group (3rd quarter) that can be regarded as biomarkers for breast cancer in urine. Sixteen possible metabolites were selected from the first geometric link (Table 3). We evaluated their possibilities as potential biomarkers on the basis of statistical significance. First, we listed possible metabolites by the second criterion, Variable Importance in the projection values (VIP), which reflect the importance of variables both with respect to samples (Y) and metabolites (X). Among possible biomarkers, targeted metabolites were screened by one term to other with larger VIP, larger than 1 due to the average VIP equal to 1 (Figure 1C). After finding most relevant metabolites by VIP, we compared possible biomarkers with statistical results of quantification of targeted metabolites (Table 2). As a result of the selection process, two metabolites, β-cortol and 5-hydroxymethyl-2-deoxyuridine, were chosen as potential urinary biomarkers for breast cancer (Figure 2). The metabolic profiles of these potential biomarkers for breast cancer selected by using metabolomics were distinct from those of the before-mastectomy group, showing a decrease after the mastectomy, and those of the after-mastectomy group were restored to the level of the control group, which can be considered as the normal condition. Those potential metabolites were qualified by student

Variable Importance in the Projection for Targeted Metabolites Selected in the 3rd Quarter of PLS-DA Loading Plot
For validation of the PLS-DA model, the fraction of the variable predicted by a component was calculated by estimation of cross-validation (Q2 = 0.32). No components of PLS-DA overrode the Hotelling T2 range by 17.04 T2Crit (99%). Moreover, the order of samples was randomly permuted 20 times and all the permuted samples fit the original matrix samples. There was little discrepancy between the observed and predicted samples due to human variation.
In this paper we suggested two potential biomarkers for breast cancer, 5-hydroxymethyl-2-deoxyuridine and β-cortol. 5-Hydroxymethyl-2-deoxyuridine has been reported elsewhere to be an oxidative DNA damage marker. The formation of hydroxylated DNA bases is an important form of oxidative DNA damage. Oxidative DNA damage can result from numerous endogenous metabolic processes as well as from exposure to environmental and dietary oxidants. In recent
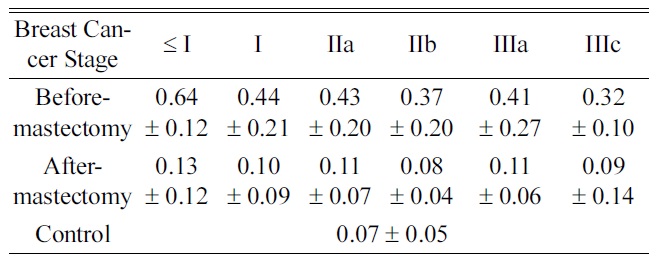
Average Concentrations of 5-hydroxymethyl-2-deoxyuridine in Urine Categorized by Cancer Stages
years, it has been reported that oxidative DNA damage plays an important role in numerous disease processes implicated in carcinogenesis and neurodegenerative diseases14,15 Djuric et al. indicated that 5-hydroxymethyl-2-deoxyuridine was significantly increased as a marker in DNA from the blood of breast cancer patients.16 We also reported that there were increased levels of urinary nucleosides in breast cancer patients,10 and we analyzed the level of 5-hydroxymethyl-2-deoxyuridine according to breast cancer staging. The results showed the highest level below stage I compared to the other stages (Table 4), which was consistent with levels of 5-hydroxymethyl-2-deoxyuridine when oxidative DNA damage is elevated in human sera, implicating early signal of cancer risk in benign breast cancer and healthy women who have a family history of breast cancer.17 This means that it indirectly supports the predictive validity of our research. Therefore, if an organism (or cell-line) is subjected to either biological or chemical stress, the specific biochemical abnormalities caused from the direct result of that stressor could be apparent. From the trace of metabolic patterns, the demonstration of these changes provides a unique way to understand pathological statesbecause of the ability to directly relate the data in the context of normal biochemistry. Moreover, the level of 5-hydroxymethyl-2-deoxyuridine for the after-mastectomy group decreased significantly (
Another suggested potential biomarker is the corticosteroid β-cortol. Most corticosteroids decreased in patients with breast cancer, whereas β-cortol significantly increased (
We presented the first report of urinary biomarkers in breast cancer patients based on metabolomics. It is suggested that the urinary metabolic profiles from mass spectrometry combined with PLS-DA can be used not only to differentiate breast cancer patients from controls, but also to discover and identify potential biomarkers. Metabolomics provides a more comprehensive look at the complex changes under way in hundreds of molecules as a disease begins to develop. Unlike proteomics or genomics, where the molecules are in one class, either proteins or nucleic acids, the metabolome comprises almost all classes of compounds that are found in tissues. Thus metabolomic approaches can be used to discover and further develop metabolic biomarkers that are distinct in tumor cell environment or in pre-cancerous tissues and may be applicable to personalized care and medicine.
JL and HMW contributed equally to this work, performed the statistical analysis with interpretation, and drafted the manuscript. JL carried out GC-MS and LC-MS analyses. HMW carried out the collection of the data and the statistical analysis. GK and SJN performed pathologic examination and the collection of urine samples with patients and controls. BCC and GK conceived the study and participated in its design and coordination. BCC approved the final manuscript. All authors read and approved the final version of the manuscript.