Plant species on coastal sand dune areas are affected by many environmental stresses that negatively impact plant metabolism and survival. Drought, salt spray, flood, high temperature, low capillary water-holding capacity of the sandy soil, low nutrient and water availability are the important ecological factors (Hesp 1991, Maun 1998, Lawlor and Cornic 2002). In coastal sand dune regions, water-deficit stress is one of the major stresses. The frequent moisture deficiency caused by high evaporative demand limits plant growth, development and viability. General adverse effects of water deficit on plants are the decline in height and total fresh and dry biomass production (Baher et al. 2002, Farooq et al. 2009). Plant growth is largely affected by drought stress, and therefore adaptation on stress conditions is important for plant survival. The reduction of plant height is related to the decrease in the cell enlargement and cell expansion due to the low turgor pressure (Bhatt and Srinivasa Rao 2005, Jaleel et al. 2007, Karthikeyan et al. 2007).
Many plants respond to water stress at the physiological and biochemical levels. Water stress is characterized by traits like decreased water and turgor potentials, relative water content (RWC), osmotic adjustment, wilting, high leaf temperature, closure of stomata, and decrease in cell enlargement and growth (Kumar and Singh 1998, Paseban-Islam et al. 2000, Shao et al. 2008). Stress as a result of water deficit changes a range of physiological processes such as photosynthesis, respiration, transpiration, ion uptake, carbohydrate contents, stomatal conductance and electron transport (Acevedo et al. 1971, Angelopoulos et al. 1996, Flexas et al. 1998, Lu and Zhang 1998, Clifton-Brown et al. 2002, Munns 2002, Silva et al. 2007). Under drought stress, to avoid and tolerate stress conditions plants accumulate metabolies as osmolytes (Bartels and Sunkar 2005). Particularly, proline has been suggested to play an important role as an organic osmolyte. Many studies have shown that proline contents in leaves of many plants are increased by many stresses including drought stress (De Ronde et al. 2000, Abdel-Nasser and Abdel-Aal 2002, Parida et al. 2002).
Understanding of the physiological mechanisms of many stressors is important in predicting how disturbances will impact future plant distribution and community pattern. Previous studies have suggested that adaptive features of coastal dune plants include tolerance to high temperatures, and efficient water use under high water-vapor saturation deficit (Monson et al. 1983, Mooney et al. 1983).
>
Plant Material and Growth Conditions
The seeds of
>
Soil Water Contents and Soil Water Potential
Water contents of the soil were determined by the weight difference between fresh and air-dried. Water potential of the soil was measured using Mini Tensiometer (Skye Instruments Ltd., Llandrindod Wells, UK), and data was collected every day.
>
Plant Growth and Dimensional Parameters of Leaves
At each harvest (day 7 and day 12), the fresh matter of leaves was weighted, and stem length and total leaves number of plant were determined.
The relative water contents (RWC) was determined as follows:
RWC (%) = (FW – DW)/(TW – DW) × 100,
FW = fresh weight, DW = dry weight, and TW = turgid weight. Dry weight of leaves was measured after 3 days dried in the oven at 80°C, and a turgid weight of leaves was measured after infiltrating the samples for 12 h in distilled water at 4°C (Cameron et al. 1999). Relative growth rate (RGR, per day) of leaves was determined as:
RGR = (ln DW2 – ln DW1)/(d2 – d1),
where DW2 and DW1 are the dry weight of plants for two successive harvest dates (d1 and d2).
>
Stomatal Density (SD), Photosynthesis and Chlorophyll Fluorescence
SD, photosynthesis and chlorophyll fluorescence of leaves were measured on day 7 and day 12 after drought treatment with three replicates. The area of four expanded leaves was calculated using the image-analyzing program (SCIONIMAGE). Stomatal density (SD) was measured on adaxial leaf surface. Stomata were counted in optical Axioskop 2 plusmicroscope (Carl Zeiss, Oberkohen, Germany) and photographs of epidermal prints (Boccalandro et al. 2007) were obtained at ×200 magnification from middle portions of leaflet laminas. To determine stomatal density, further analyses were used.
Stomatal density (SD) = no. of stomata per leaf area (mm2)
Photosynthesis was measured by a LCi portable infrared gas analyzer (IRGA) (ADC BioScientific Ltd., Hoddesdon, UK). Chlorophyll fluorescence was measured with a portable Handy PEA (Hansatech Instruments Ltd., King’s Lynn, UK). Chlorophyll fluorescence was measured on the adaxial leaf surface, which had been pre-darkened for at least for 30 min. Measurements were conducted on cloudless days and were done between 10:00 and 14:00.
>
Contents of Chlorophyll a, Chlorophyll b and Carotenoid
The leaf samples for chlorophyll and carotenoid contents were extracted by DMSO (Dimethyl sulfoxide) at 60°C for 12 h. The contents of chlorophyll a, chlorophyll b and carotenoid were estimated from absorbance at 645 nm, 663 nm and 480 nm with UV mini-1240 spectrophotometer (Shimadzu, Kyoto, Japan). Quantitative estimation of the chlorophyll and carotenoid contents was obtained by using the equation of Holden (1965) and Kirk and Allen (1965), respectively.
>
Contents of Total Ion and Osmolality
The freeze-dried leaves were ground to a homogenous powder and extracted with boiling distilled water for 1 h. Total ion contents (calculated as NaCl equivalents) were determined using a conductivity instrument (Mettler Check Mate 90; Mettler Toledo, Columbus, OH, USA), and the osmolality of leaf extract solutions was measured by means of cryoscopy (OSMETTE micro-osmometer, model 5004; Precision Systems Inc., Natick, MA, USA).
>
Contents of Soluble Carbohydrate and Free Proline
Soluble carbohydrate contents of leaves were determined by using the Phenol-Sulfuric acid method. Mix leaf extract of 20 μL and distilled water of 780 μL and mix them with 400 μL of 5% phenol solution and then put concentrated sulfuric acid (98% H2SO4) of 2 mL. Leave the reaction solutions undisturbed for 10 min and then shaking for mix. After 30 min, the samples were measured at 490 nm. Soluble carbohydrate was calculated from a standard curve using D-glucose.
Free proline contents were estimated following the method of Bates et al. (1973). Freeze-dried leaves (0.5 g) were extracted in 3% sulphosalicylic acid and the homogenate filtered through filter paper. Filtrate of 2 mL was reacted with 2 mL of acid ninhydrin reagent and glacial acetic acid of 2 mL in a test tube for 1 h at 100°C, and the reaction terminated in an ice bath. The reaction mixture was extracted with 4 mL of toluene and mixed vigorously with a vortex mixture for 15-20 s. The chromophore containing toluene was aspirated from the aqueous phase, warmed to room temperature and the absorbance measured at 510 nm using toluene as blank. Proline concentration was calculated from a standard curve using L-proline.
Statistical analysis of control and drought treatments at each sampling day was conducted using independent samples
>
Soil Water Contents and Soil Water Potential
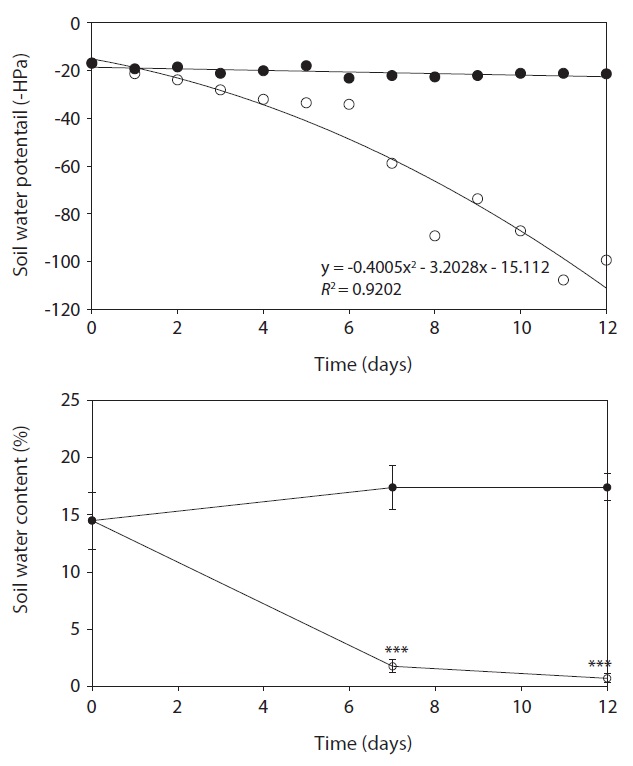
Soil water contents were drastically reduced by water stress and the reduction of soil water contents was 89.9% and 96.0% on day 7 and day 12, respectively, in drought
condition as compared to the well-watered (control) condition. During study period, soil water potential decreased continuously by water deficit in drought treatment. Determination of the soil water matric potential (Ψm) is significant to characterize and monitor processes such as crop yield production and plant growth (Young and Sisson 2002). During water deficit soil water potential would be decrease and this would negatively affect to water uptake (Loreto et al. 2003). Tensiometer used in this experiment is extensively used instrument for determination of Ψm (Or 2001, Young and Sisson 2002). In the present study, Ψm was consistently reduced with the decrease of soil water contents during drought period (Fig. 1), which inevitably interfere plant growth and development.
>
Plant Growth and Dimensional Parameters of Leaves
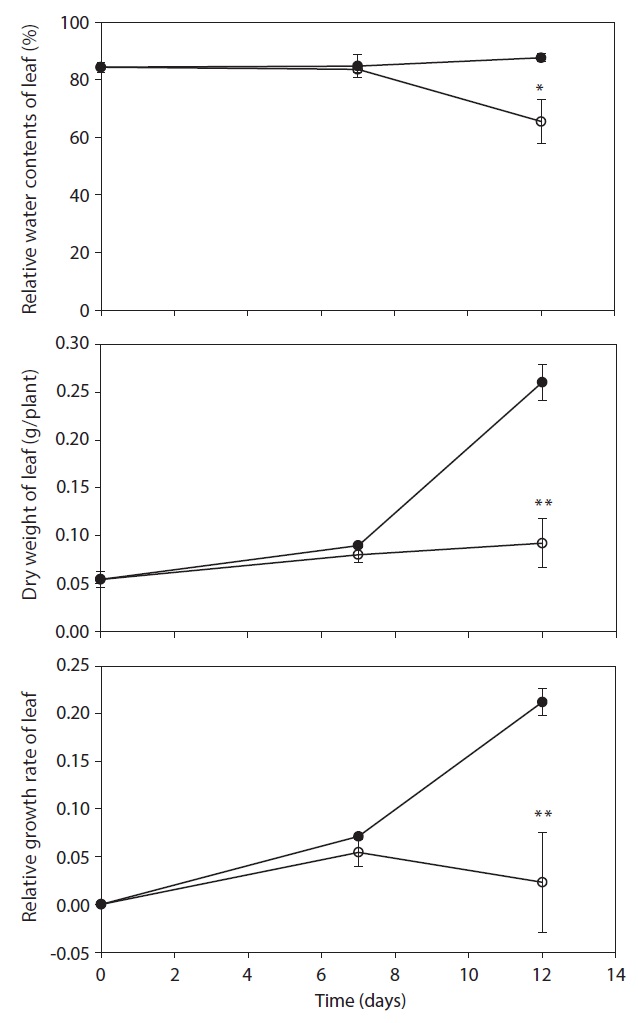
DW, RGR and RWC in leaves of drought treatment were lower than control after day 7, but were not shown significant difference between control and treatment (Fig. 2). A significant decrease in DW, RGR and RWC was observed on day 12 after treatment, and decreased by 64.5%, 89.1% and 25.3% as compared with that in the control,
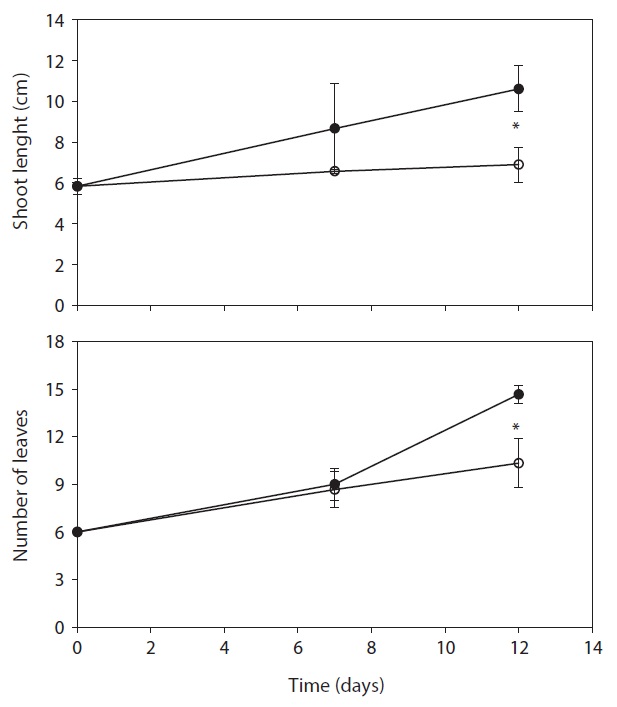
respectively. After day 12, stem length and leaf numbers per plant in drought treatment were shorter and fewer than control, and decreased by 34.9% and 29.5% as compared to control, respectively (Fig. 3). In drought-stressed plants, RGR and RWC were not shown a significant difference compared with that of control until day 7, but it decreased after day 12. Plant growth inhibition was observed during water deficit. In general, water deficit stress mostly reduced plant growth and development (Thakur and Kaur 2001). According to many studies, stem length was decreased under drought stress (Patel and Golakia 1988, Pita and Pardes 2001), and the reduction in plant dry weight and height is associated with the decrease of stem length (Martiniello and Ciola 1995, Iannucci and Martiniello 1998).
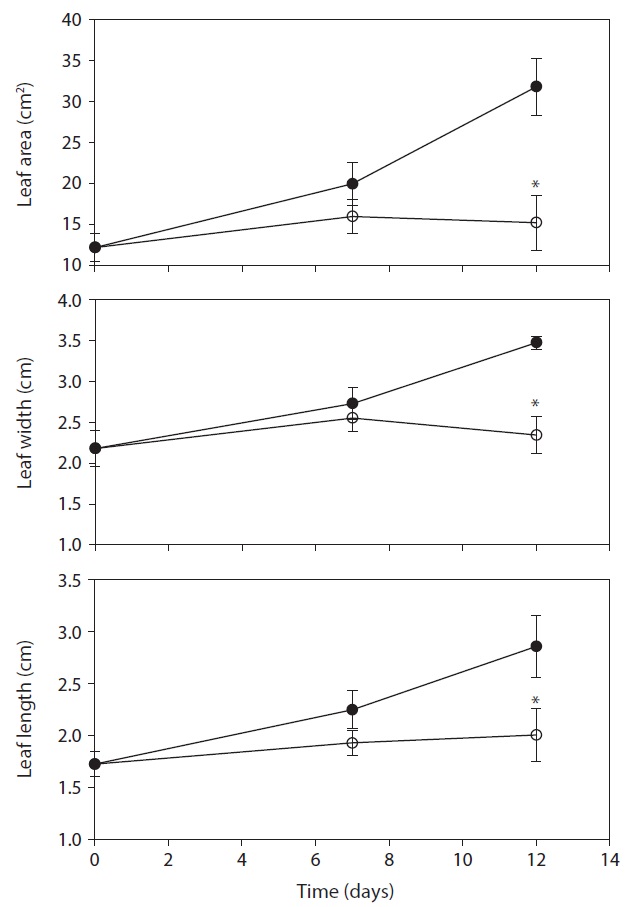
The differences in the leaf area of fully expanded new
leaves between control and drought treatment was not shown on day 7. However, the leaf area on 12 days after drought treatment decreased by 52.2% compared with the control (Fig. 4). In the present study, water deficit stress reduced plant growth such as stem length, number of leaves and leaf area. The reduction in plant growth by water deficit is associated with the reduction of plant biomass and RGR. Leaf area plasticity is an important means by which a drought-stressed crop maintains control of water use and the leaf growth was used as a physiological trait to estimate acclimation to water deficit (Rucker et al. 1995, Blum 1996, Shubhra et al. 2003). The maintenance of higher RWC can be used as an indicator of drought resistance mechanisms in plants under soil drying conditions (Chylinski et al. 2007). Also, decrease in RWC reflects a loss of turgor causing of limited water availability (Ndayiragije and Lutts 2006).
>
Stomata Density, Photosynthesis and Chlorophyll Fluorescence
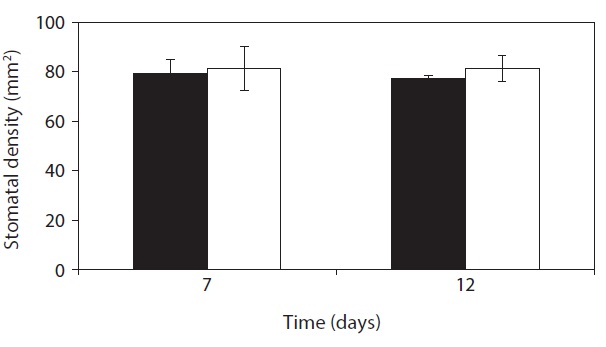
On day 7 and day 12, Stomata density was not significantly different compared with that of control (Fig. 5). Stomata aparture and stomatal density mainly control the stomatal conductance of CO2 which vary with changes of
leaf area in response to water availability and other environmental factors (Casson and Gray 2008, Boccalandro et al. 2009). Under stress conditions many plants increased stomatal density with the decrease of leaf area that enhanced gas exchange per leaf area and biomass yield
production (Yang and Wang 2001, Zhang et al. 2006, Giordano et al. 2011) whereas the number of stomata per leaf decreases (Quarrie and Jones 1977). For the stomatal density per leaf area,
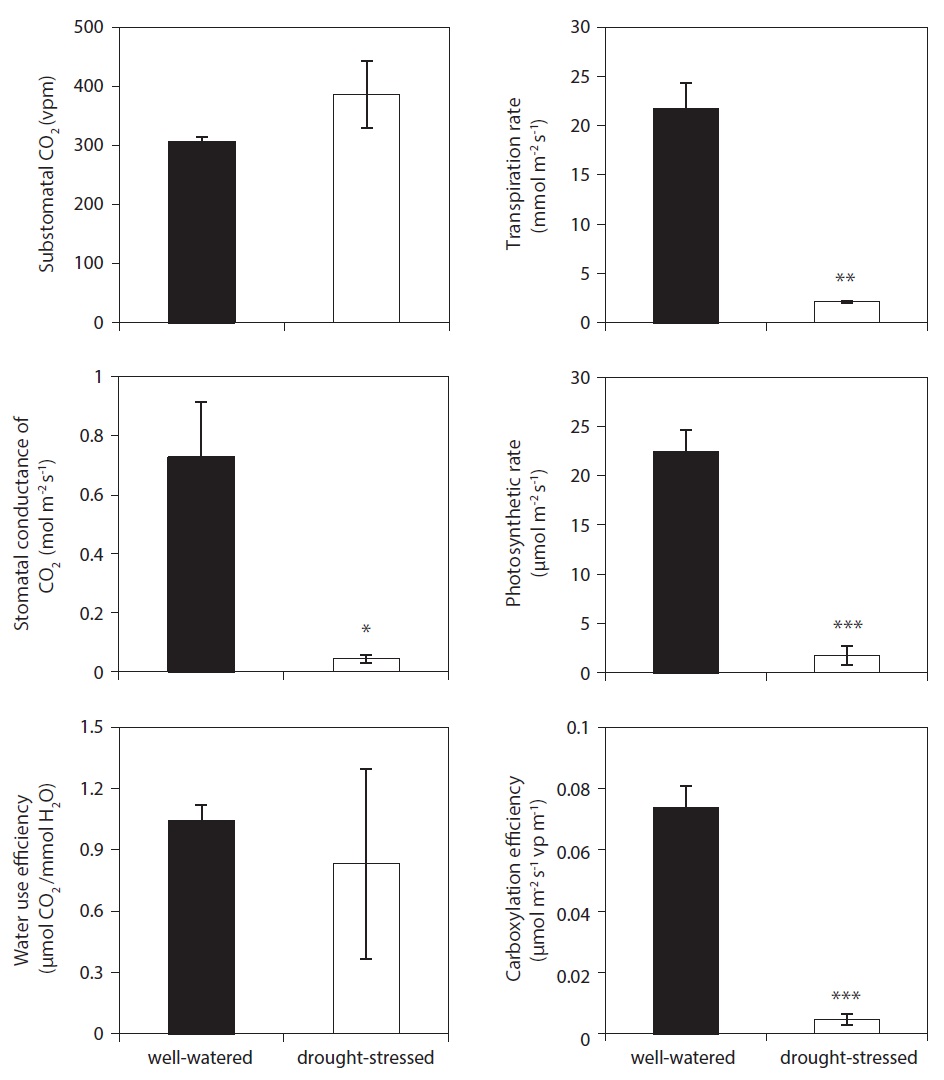
Photosynthesis was measured at the end of the final stress periods, day 12. Understanding the physiological mechanisms of many stressors is crucial to anticipating how physiological interruption will affect future plant developments. The well-watered plants showed higher net photosynthetic rate, transpiration rate, stomatal conductance of CO2, and carboxylation efficiency than those of drought-stressed plants (Fig. 6). However, there was no significant difference to the value of substomatal CO2 and water use efficiency between treatments on day 12 after drought stress. In the present study,
Maximum quantum use efficiency (Fv/Fm) in dark-adapted leaves corresponds to the ratio (Fm - F0)/Fm, where Fm is the maximal fluorescence yield of a dark-adapted sample, with all PSII reaction centres fully closed, and F0 is the minimum fluorescence yield of a dark-adapted sample, with all PSII reaction centres fully open. Fv/Fm has been commonly used to identify changes in the photosynthetic apparatus as a result of stress (Baker and Rosenqvist 2004, Resco et al. 2008). Previous studies suggest that chlorophyll fluorescence parameters tend to be strongly correlated with plants mortality to react environmental stresses (Wakrim et al. 2005).
In the present study, Fv/Fm were not significantly different under well-watered and drought conditions (Table 1). According to other previous studies, some plants did not show any remarkable change of Fv/Fm under drought stress whereas plant growth was rapidly decreased (Munns et al. 2010).
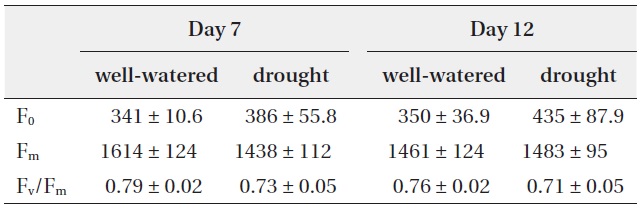
Change in chlorophyll fluorescence parameters (F0, Fm and Fv/Fm) with well-watered and drought treatments
[Table 2.] Change in chlorophyll and carotenoid contents with well-watered and drought treatments
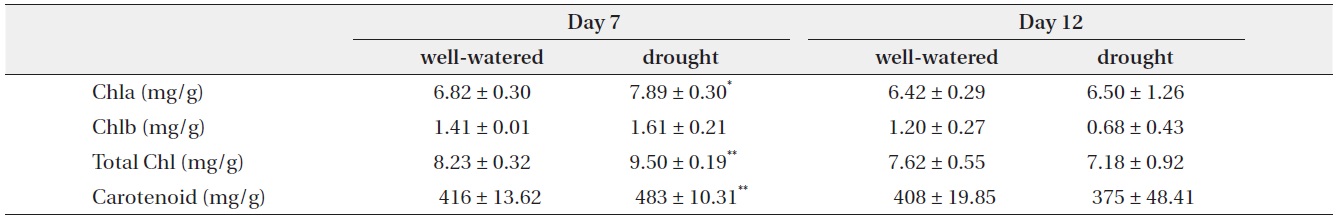
Change in chlorophyll and carotenoid contents with well-watered and drought treatments
was resistant to water stress and the electron transport chain was maintained under water deficit conditions, even though photosynthetic rate and stomatal conductice of CO2 were strongly limited.
>
Contents of Chlorophyll a, Chlorophyll b and Carotenoid
On day 7, chlorophyll a, total chlorophyll and carotenoid contents showed small increase 15.7%, 15.5% and 16.3%, respectively, in drought treatment as compared to the control. On day 12, chlorophyll b, total chlorophyll and carotenoid contents of the stressed plants were lower than those of controls, but there were no significantly different (Table 2).
Water stress leads to a decline in photosynthetic activity and change of the chloroplast capacity (Martinez et al. 2003, Jaleel et al. 2007, Massacci et al. 2008). Decrease of chlorophylls and carotenoid contents by stressed conditions was reported in several plant species (Loggini et al. 1999, Agastian et al. 2000). In the present study, contents of chlorophyll and carotenoid under water stress were decreased after 12 days, but there was no significant difference compared to control. It is suggested that the capacity of chloroplast does not get much damage from drought conditions.
>
Contents of Total Ion, Osmolality, Soluble Carbohydrate and Proline
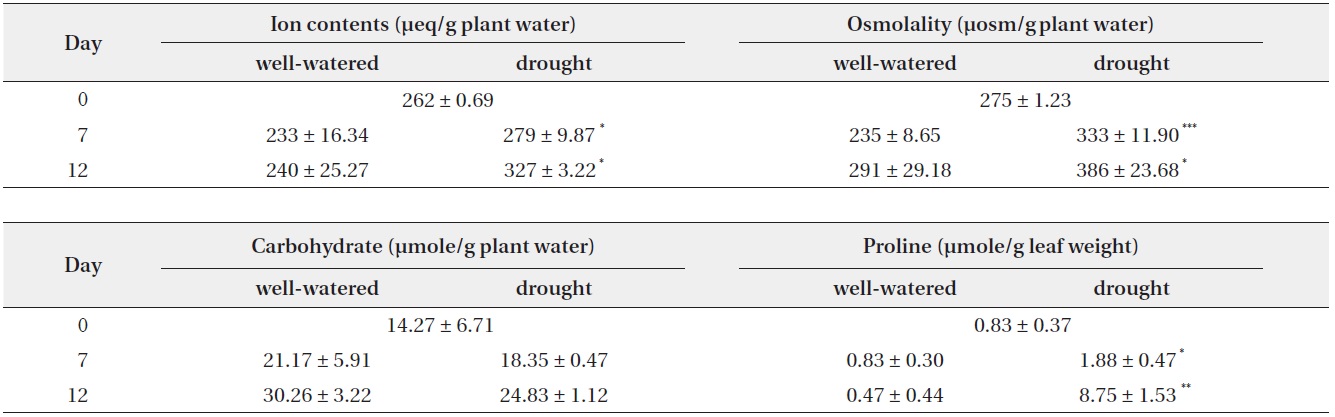
The total ion contents and osmolality of drought-stressed plants had higher than control plants during study period. The value of total ion contents and osmolality gradually increased and it is significantly different than those of control. Total ion contents in the leaf of drought-stressed plant were increased by19.7% and 36.3%, and osmolality was increased by 41.5% and 32.3% as compared to control on the day 7 and day 12, respectively.
Soluble carbohydrate contents were gradually increased during drought stress. The value of the soluble
[Table 3.] Change in total ion, osmolality, soluble carbohydrate and free proline contents

Change in total ion, osmolality, soluble carbohydrate and free proline contents
carbohydrate contents was similar between control and treatment. Control was litter higher than drought treatment, but it is no significant difference. Proline synthesis was greatly enhanced in drought-stressed plants (Table 3). Proline contents in the drought-stressed plants on the day 7 and day 12 were 2.27 and 18.6 times greater than those of controls. It is indicated that the increase of osmolality in stressed plants was due to the accumulation of osmolytes by water deficit. To prevent water loss, drought-stressed plants try to promote with an increase in osmolality (Chaves et al. 2003). Plant capacity for osmotic adjustment could be important to maintain water absorption in sand dune plant species under water deficit (Nilsen et al. 1984). For these reasons, plants accumulate other compatible solutes such as sugar, glycerol, betaines, proline and inorganic ions under water stress conditions (Bray 1997, Hare et al. 1998, Chaves et al. 2003), and also degree of proline accumulation correlates with the change of water potential and RWC (Knipp and Honermeier 2006).
In the present study, total ion contents and osmolality are higher than those of control, and which are continuously increased with water stress. Also, increase of proline contents in leaves induced by drought stress agreed with previous studies, and accumulation of proline is one of the general adaptive mechanisms in many plants (Hare et al. 1998, Abdel-Nasser and Abdel-Aal 2002). However, soluble carbohydrate did not show any remarkable difference compared to control plants. It may be
In conclusion, physiological responses of