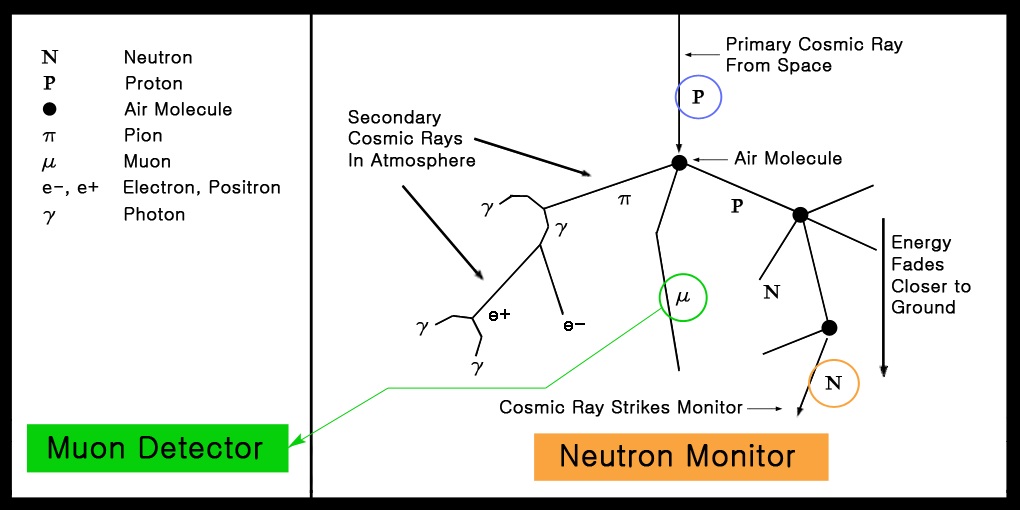
Cosmic rays refer to the high-energy protons (i.e., hydrogen nuclei) or helium nuclei including high-energy heavy nuclei and electrons, which originate from outer space. These primary cosmic rays collide with particles in the Earth’s atmosphere, and produce secondary cosmic rays such as neutrons (Simpson et al. 1953). The cosmic ray shower shown in Fig. 1 indicates the process where protons (i.e., cosmic rays) collide with air molecules and produce pions and kaons, and these particles successively disintegrate into muons, electrons, neutrons, and photons.
Among the secondary cosmic rays, neutrons and muons are commonly used in cosmic ray research since they could reach the Earth’s surface. Muons are generated by ones which have higher energy than the primary cosmic rays that generate neutrons. The muon detector counts the radiation that is emitted by the deexcitation of the electrons excited by the muons incident on plastic scintillators. The neutron monitor also operates by counting the electric current generated via the nuclear reaction of the incident neutrons with BF3 (n + 10B → α + 7Li) or He (n + 3He → p + 3H), which are charged in the counter. The IGY type neutron monitor, which is an early stage neutron monitor, was first developed by J. Simpson at the University of Chicago in 1948 (Simpson 2000).
The ground-based neutron monitor is a facility for measuring neutrons that are secondary cosmic rays produced when cosmic rays in the 500 MeV ~ 50 GeV energy range outside of the Galaxy collide with the Earth’s atmosphere, and the data is used for indirectly estimating primary cosmic ray flux variations through the observation of neutrons (Simpson 1948, 2000, Beer 2000). Especially, as cosmic rays in this energy range are largely affected by solar wind that is the material coming from the sun, cosmic ray flux variations occur during solar maximum and solar minimum. They serve as an important indicator of changes in the space environment caused by solar activity (Balasubrahmanyan & Venkatesan 1971, Gloeckler & Jokipii 1967). The changes of heliospheric structure could also be investigated, and the cosmic ray flux data not only serves as an important indicator
of climate change such as cloud cover, precipitation, and temperature change, but also provides information which can be widely used in daily life such as radio communication, radiocarbon dating, and various fields of astronomy.
In October 2011, a neutron monitor was installed at the Korea Research Institute of Standards and Science in Daejeon (Kang et al. 2012). The installed neutron monitor is a standard neutron monitor (standard NM64) that consists of 18 counters, which is widely used throughout the world. Also, a muon detector was installed at the Ricci Hall, Sogang University in October 1999, and was later moved to Dongbuichon-dong where it is currently in operation. The muon detector is a small detector that consists of four smallsized plastic scintillators. The detailed specifications are summarized in Table 1.
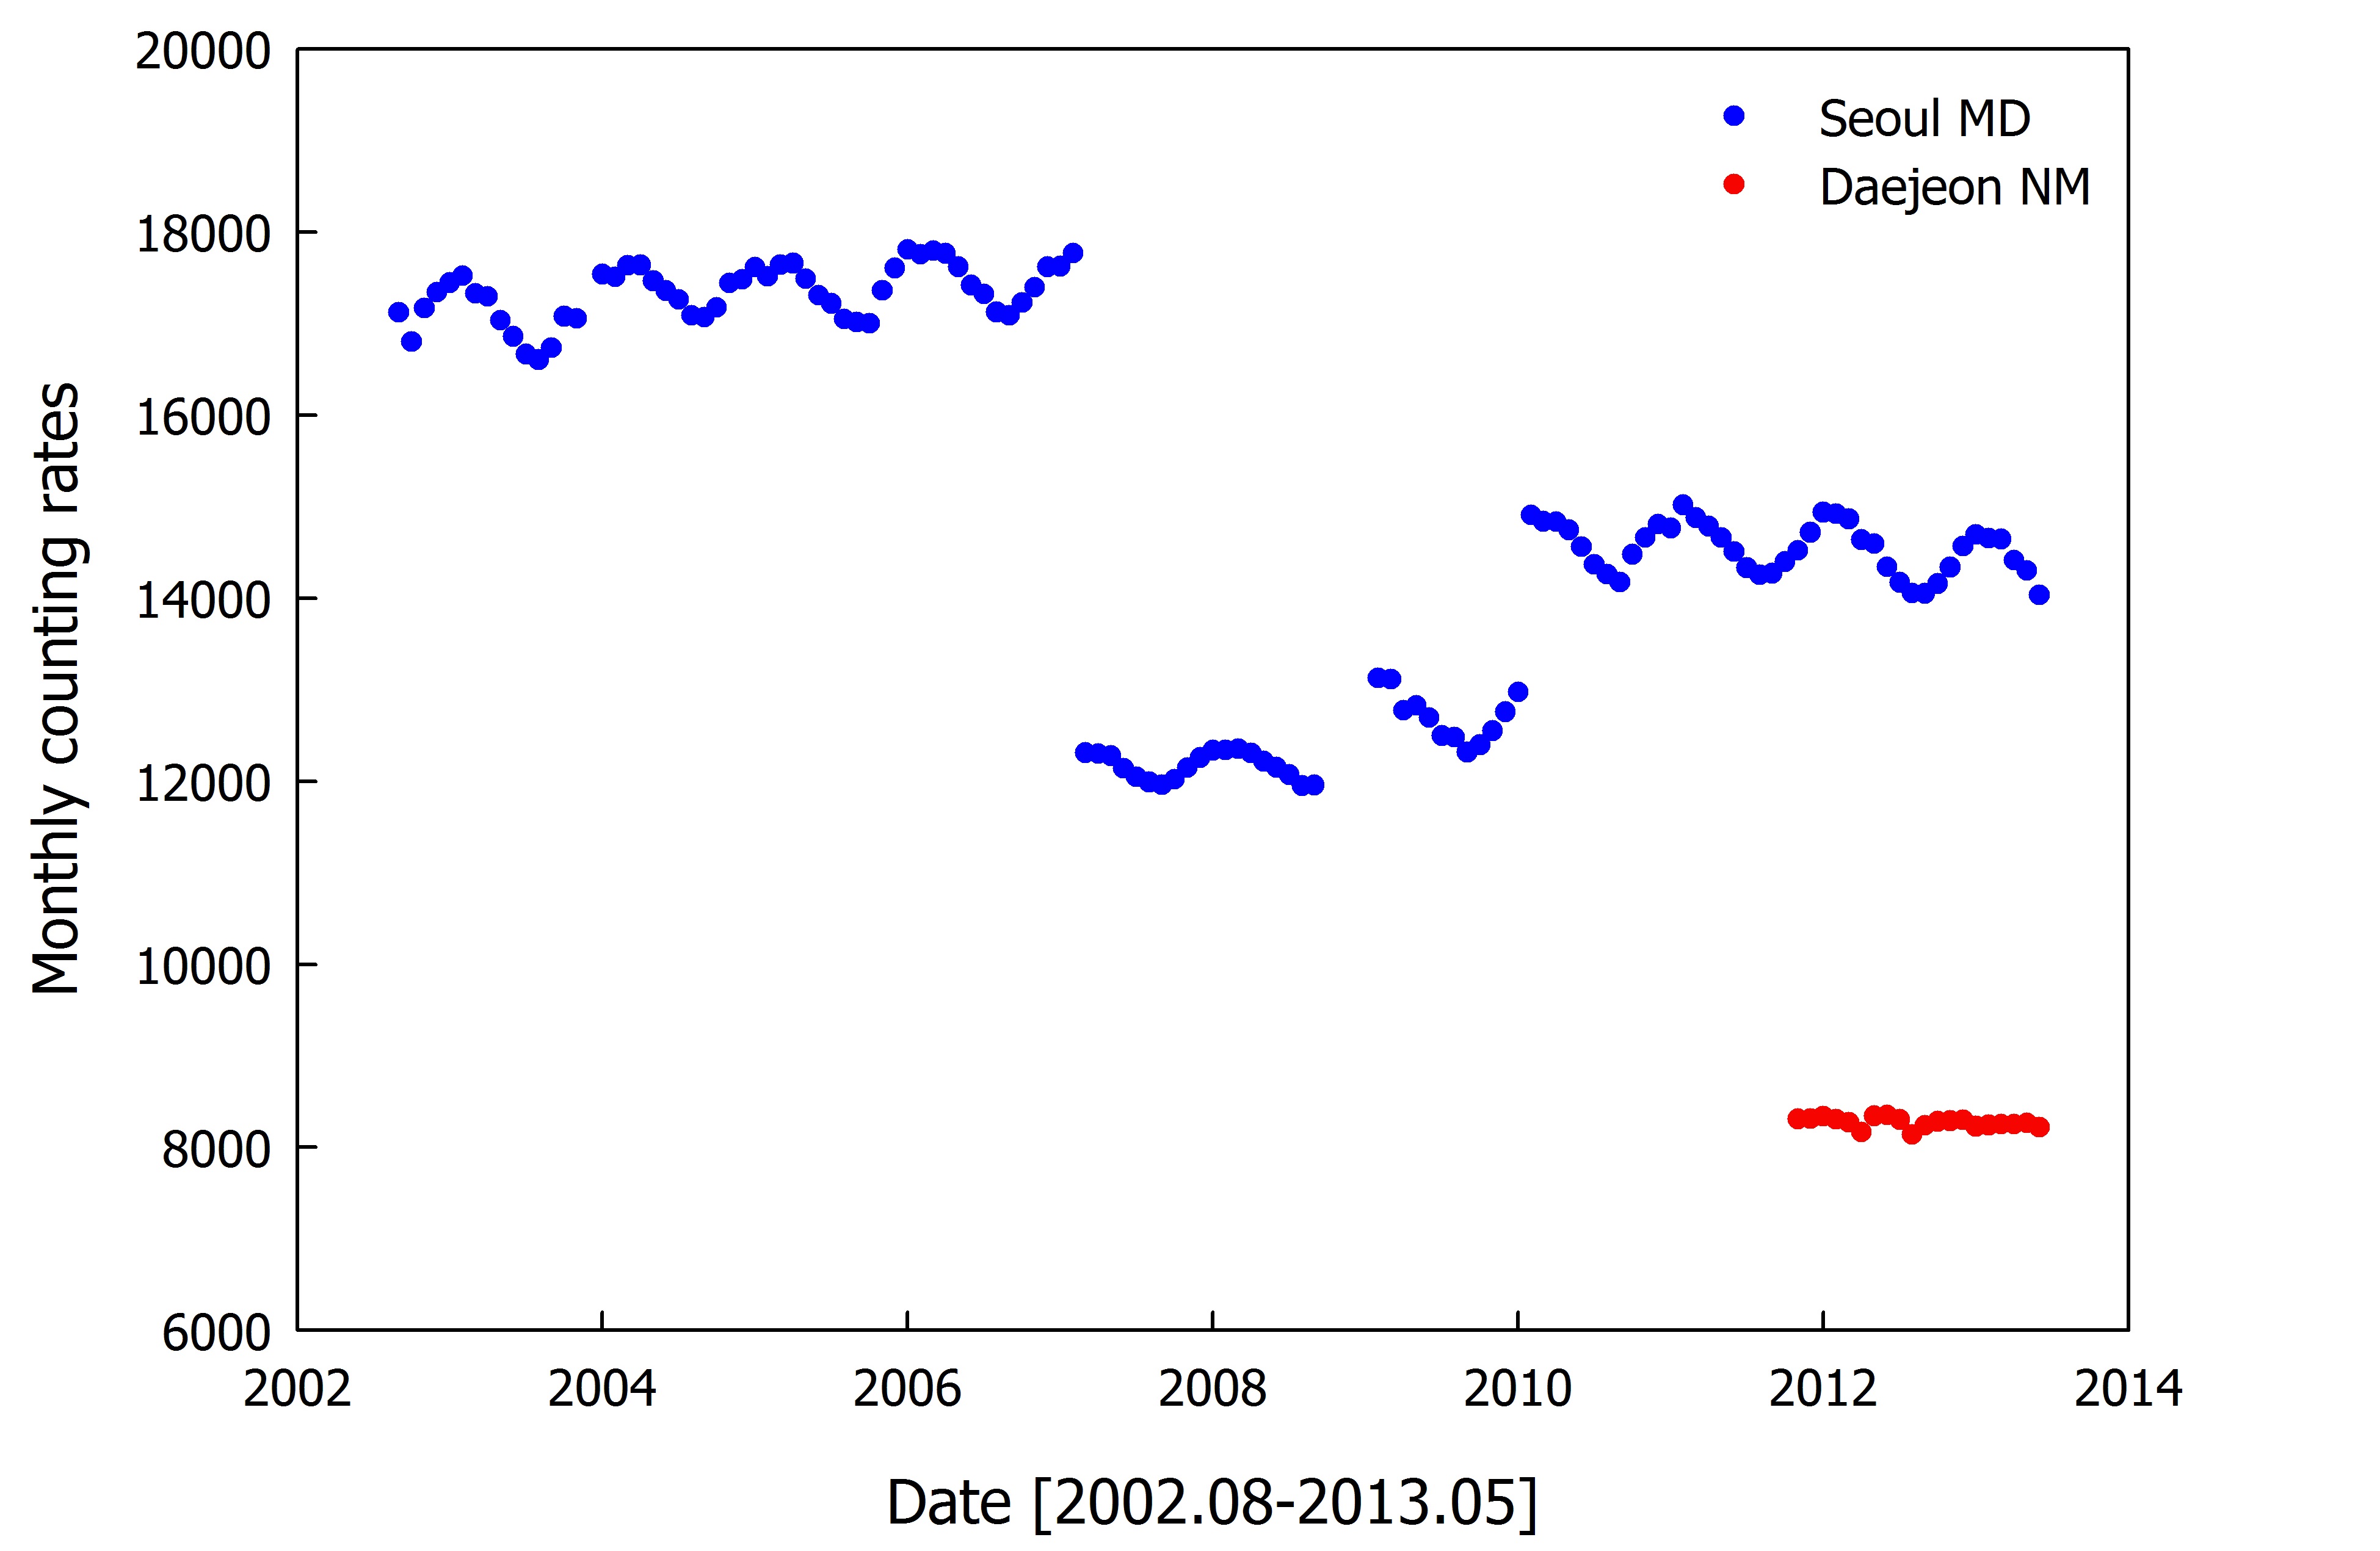
Fig. 2 shows the monthly average values of the muon flux and neutron flux during the observation period. For the muon flux, the data from the early stage observation was not available, and thus the data after August 2002 was used. Unlike the neutron flux, the muon flux showed a seasonal variation. Muons are produced from pions (π), which are formed at 100 hPa-height. The 100 hPa-height varies depending on the season. It decreases in winter and increases in summer. Generally, it is 16,000 m in winter and 16,400 m in summer. If the height increases, the length that muons should pass through becomes longer, and they dissipate due to the collision with particles in the
[Table 1.] Configuration of Daejeon neutron monitor and Seoul muon detector.
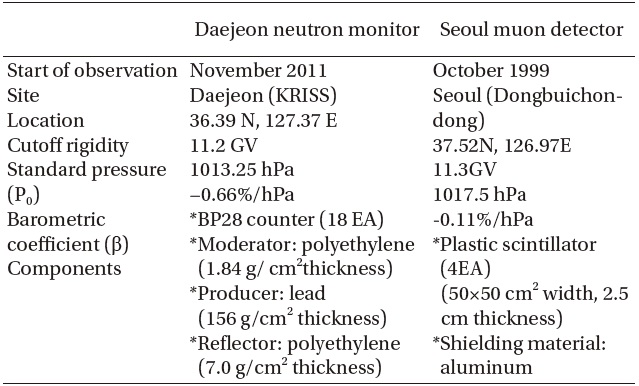
Configuration of Daejeon neutron monitor and Seoul muon detector.
atmosphere, which decreases muon flux. On the other hand, the muon flux level has been greatly changed three times, and this is because the location of the muon detector installation was changed, which in turn changed its altitude. The altitude above sea level was changed from 78 m to 34 m and 45 m, respectively.
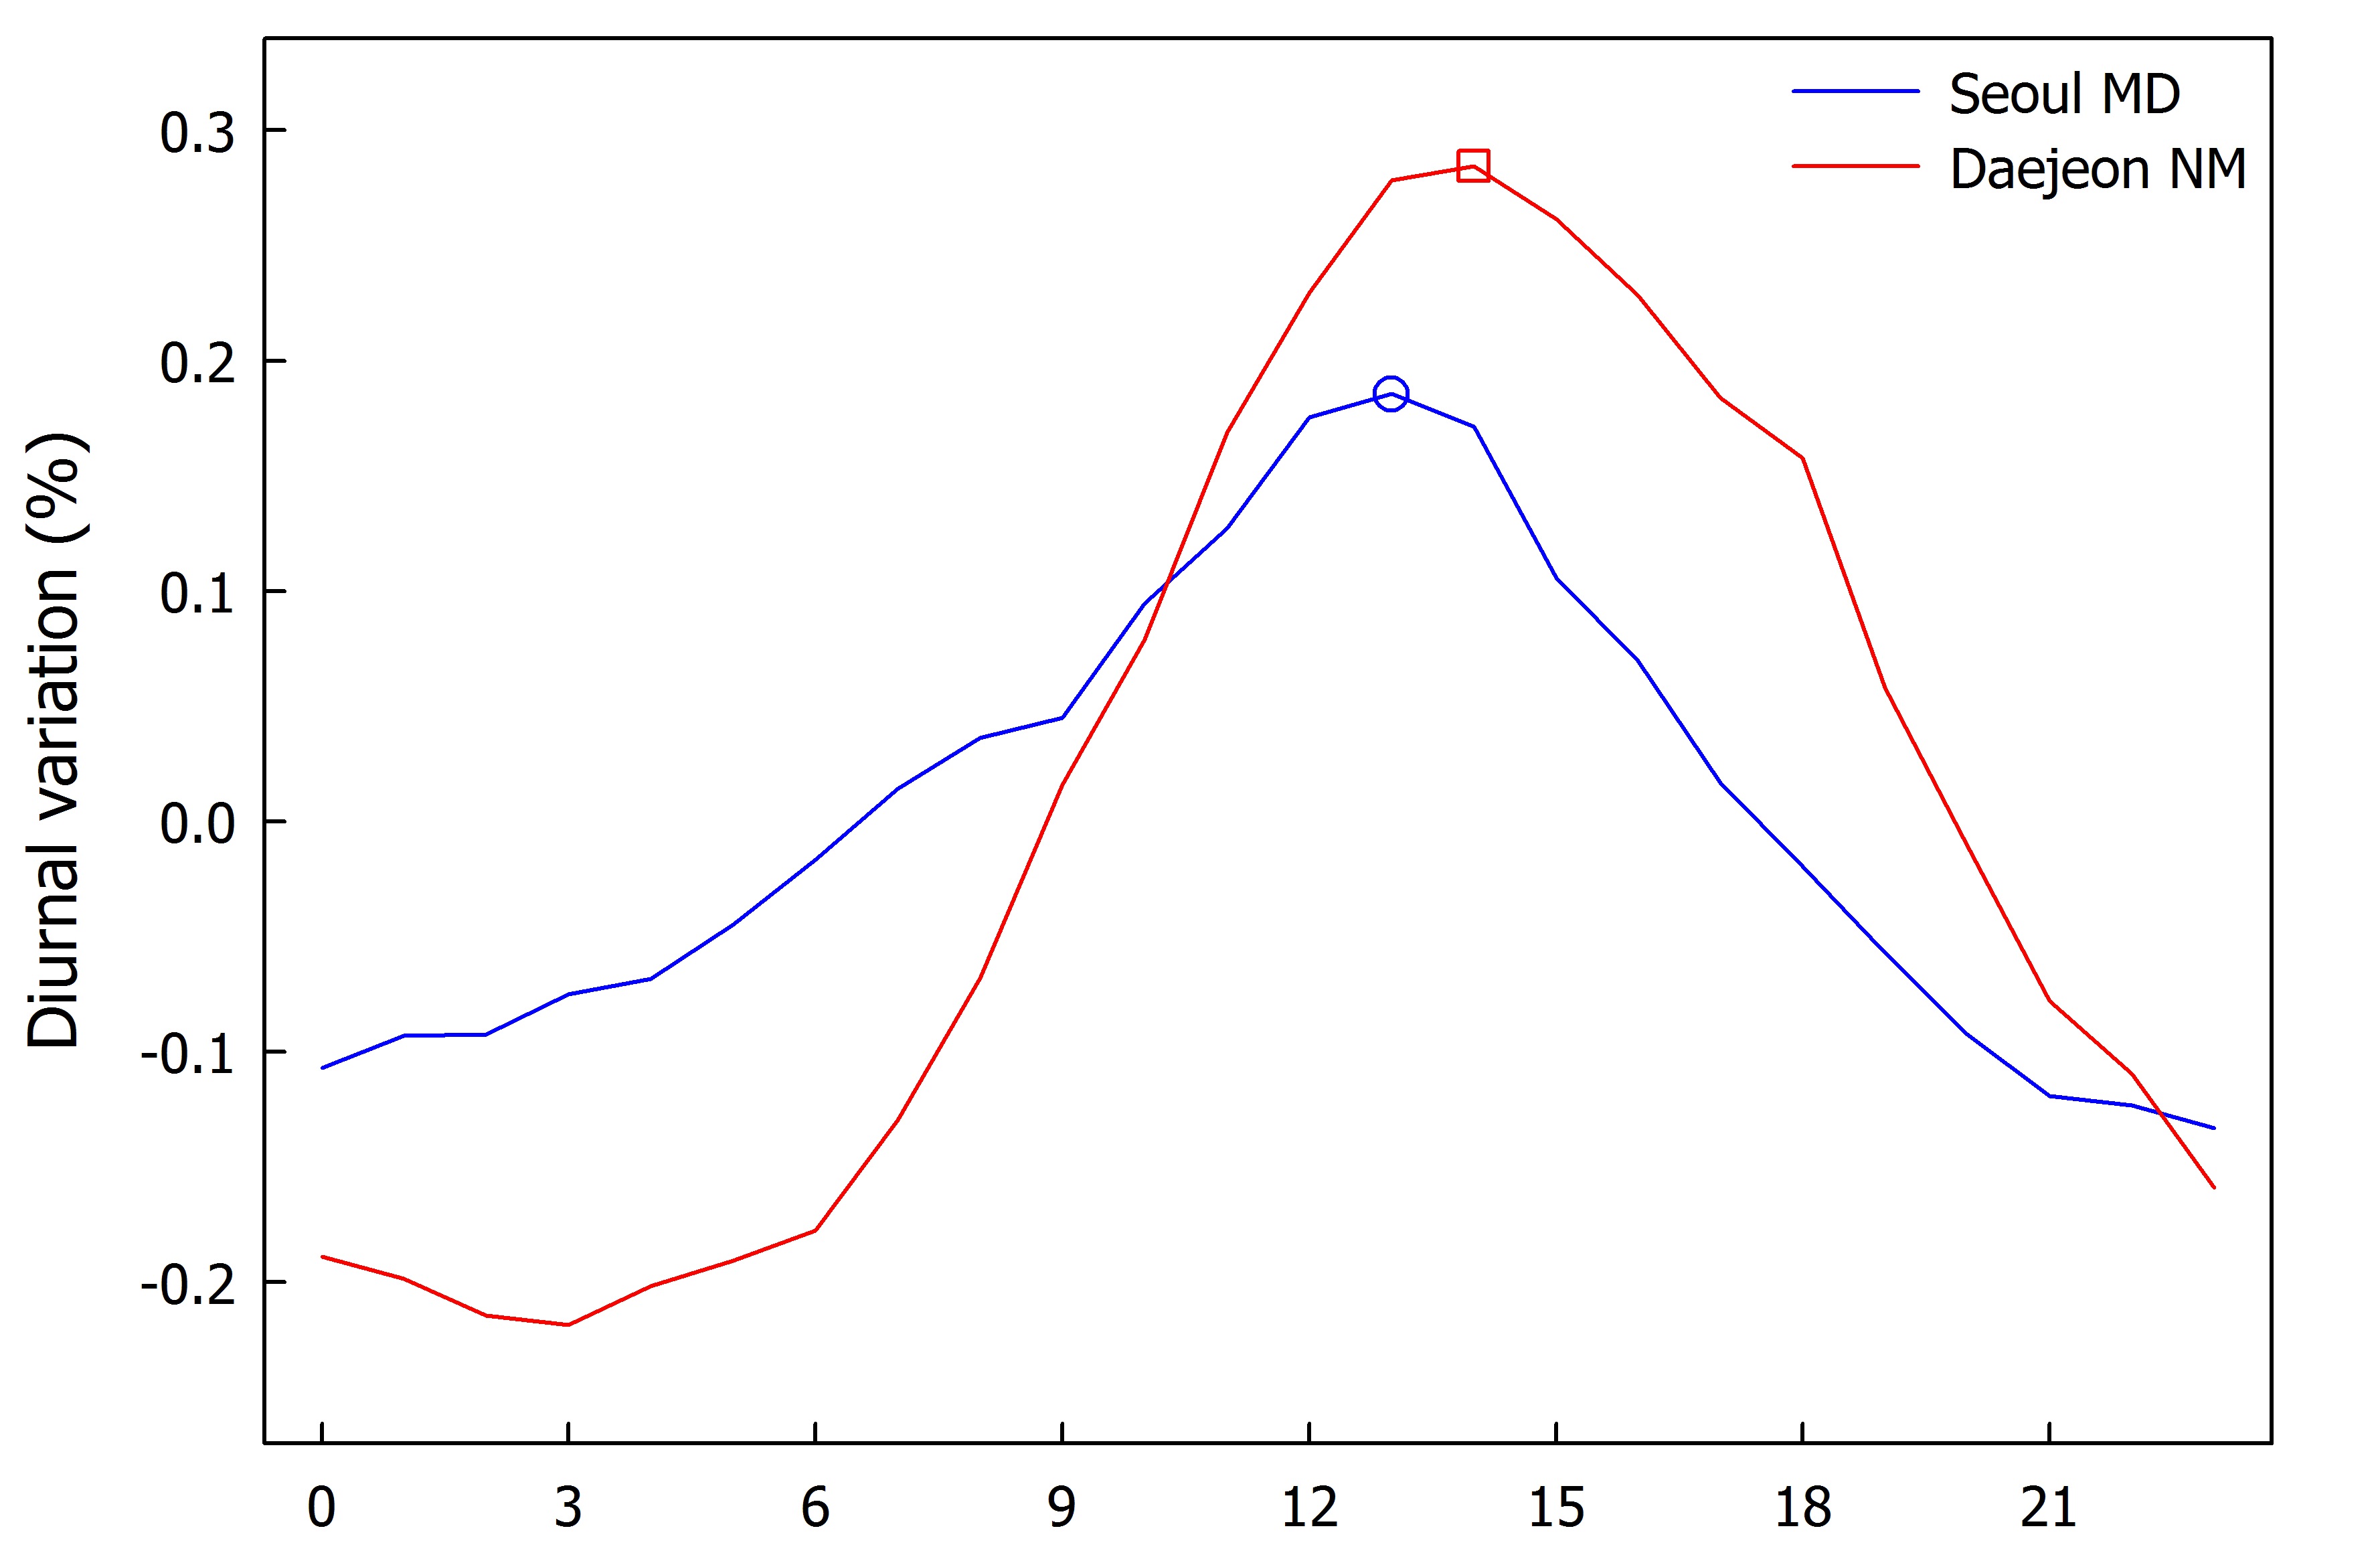
Fig. 3 shows the diurnal variations of the cosmic rays observed by the Seoul muon detector and the Daejeon neutron monitor. The diurnal variations were analyzed using the ‘pile-up method’ from Oh et al. (2010). In the diurnal variations, the maximum flux occurred at about 13:00 for the muon flux and at about 14:00 for the neutron flux. The phase of the neutron flux was consistent with the result of Kang et al. (2012). The phases of the muon and neutron fluxes showed a difference of about 1 hour. As mentioned earlier, the primary cosmic rays that generate muons have higher energy than the primary cosmic rays that generate neutrons. Therefore, the muon flux could reach the maximum earlier than the neutron flux, as suggested by Oh et al. (2010).
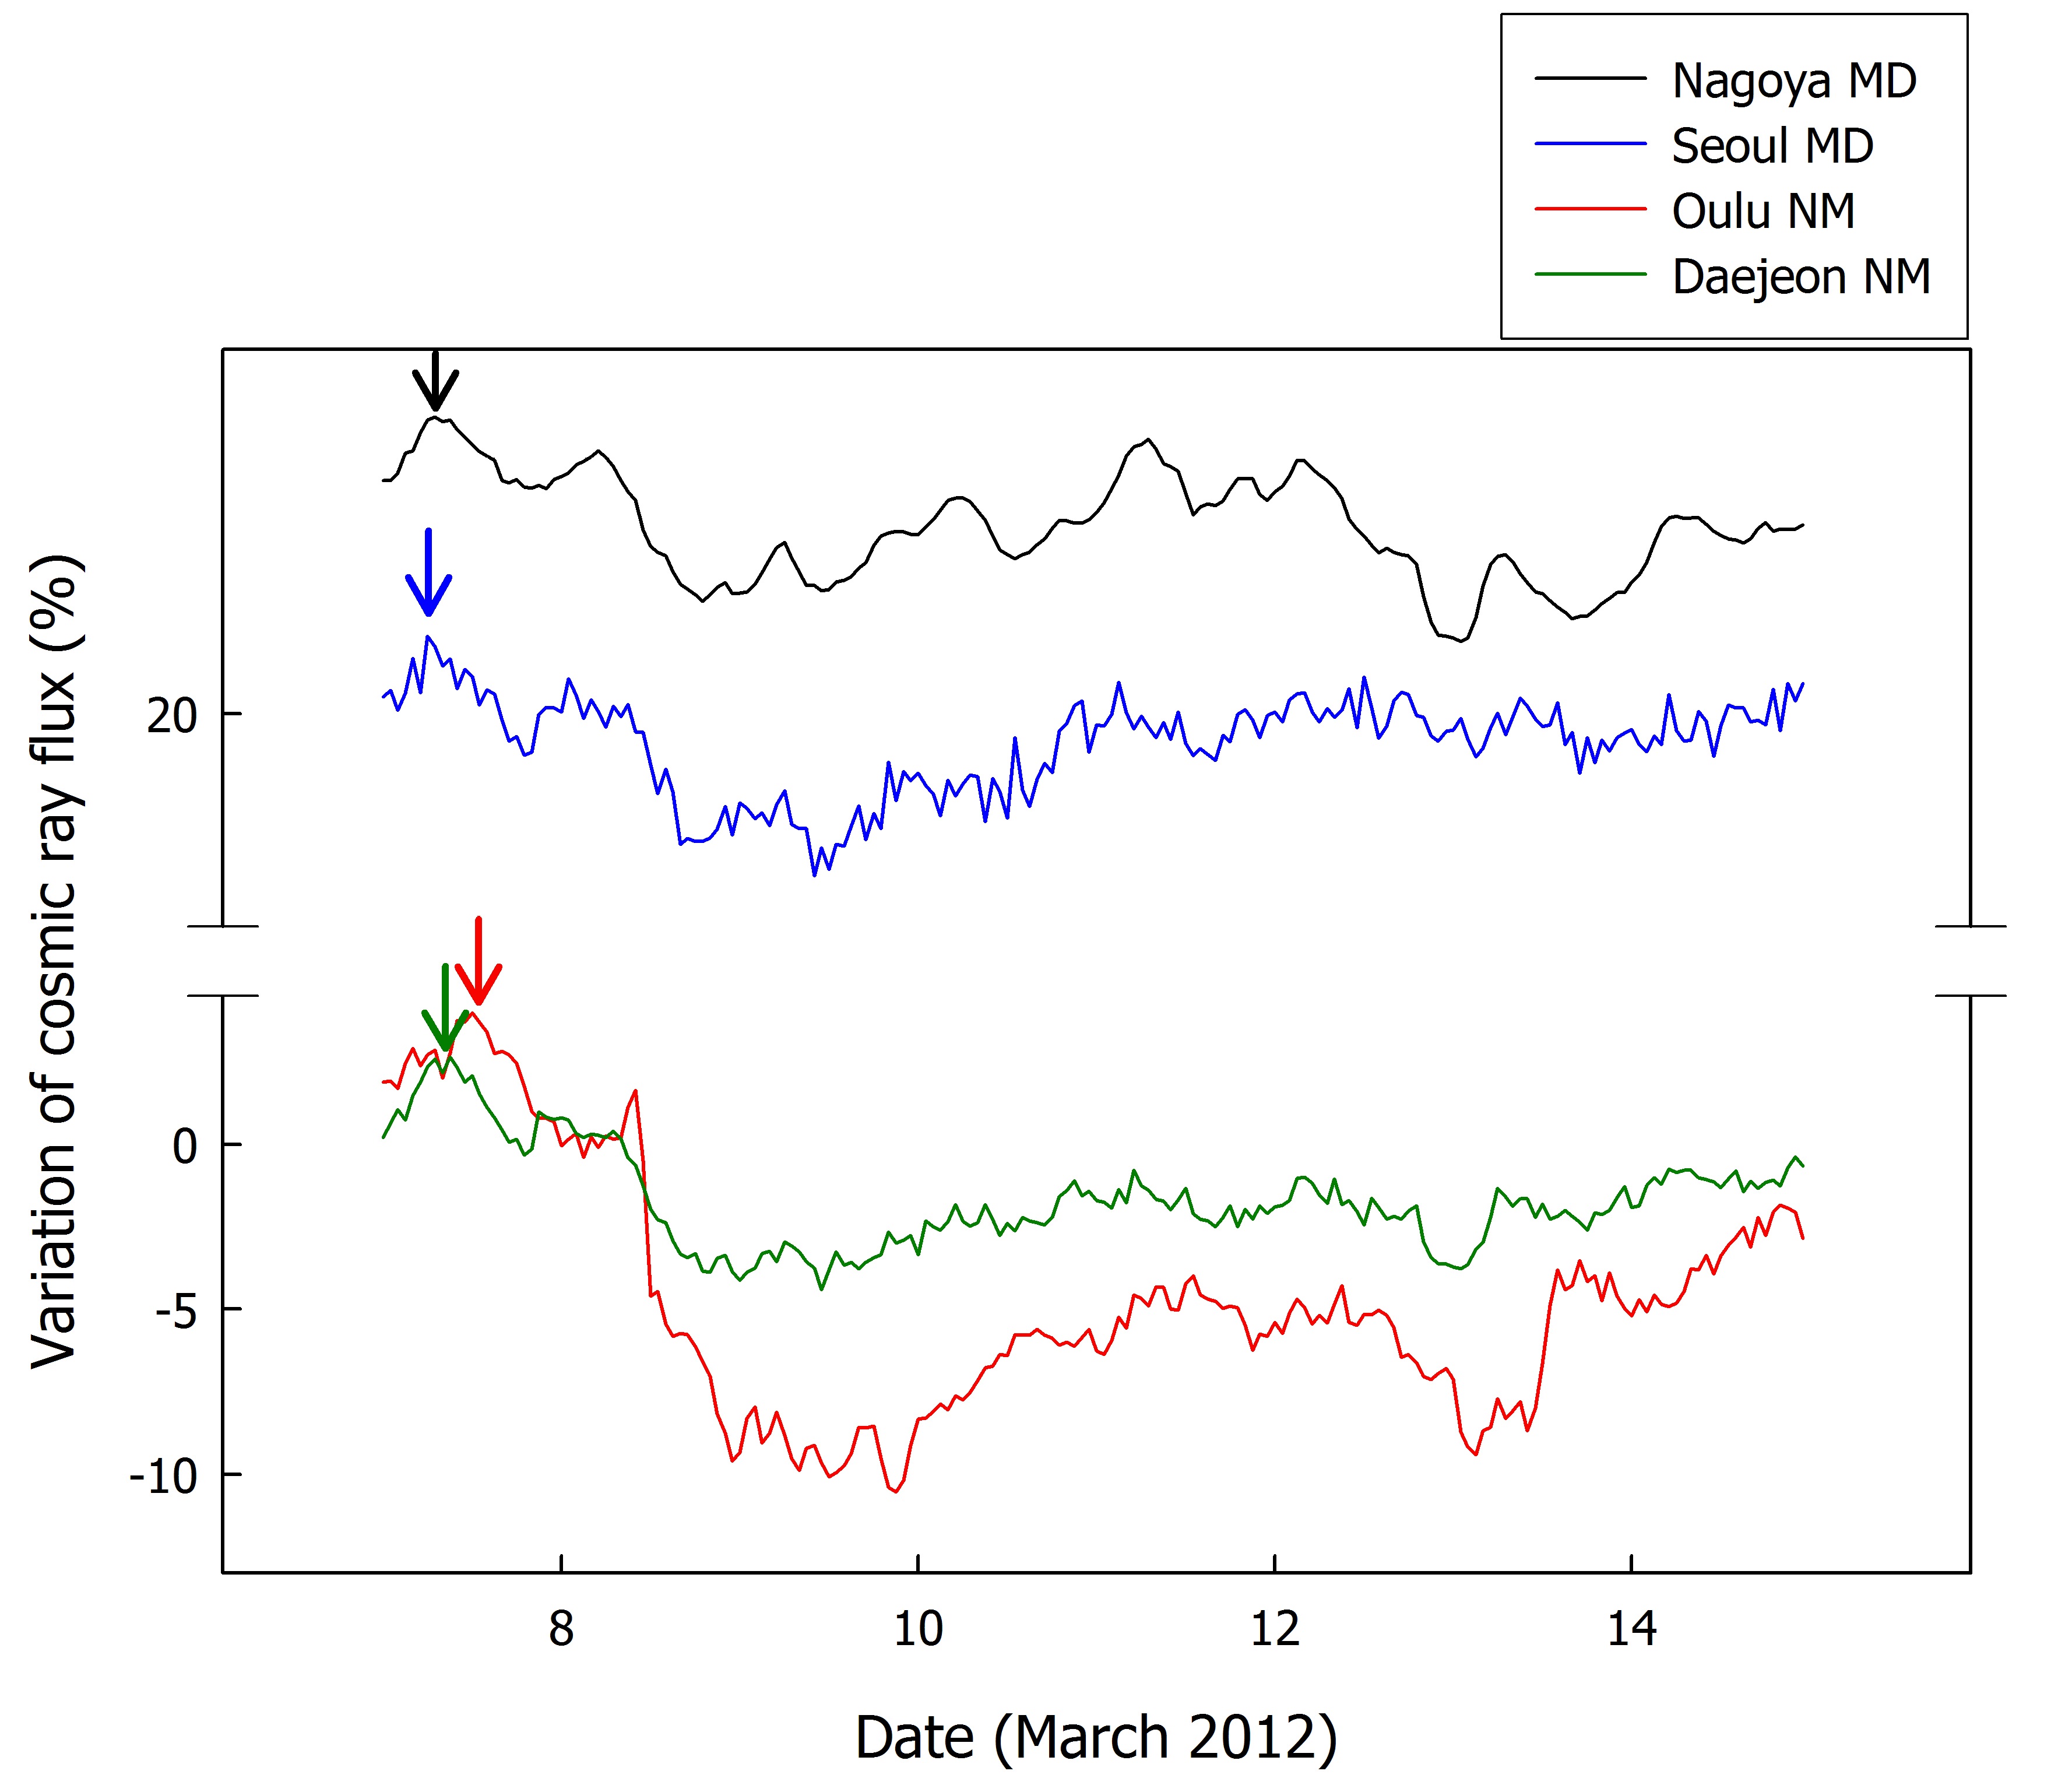
Fig. 4 shows the flux variation profiles depending on time for the Forbush decrease event recorded at each station on 7 March 2012. The decrease of the neutron flux was found to be much larger than that of the muon flux. The muon flux showed a smaller variation because it was less affected by the sun’s magnetic field, due to the fact that muons are generated by ones which have higher energy than the primary cosmic rays that generate neutrons. Table 2 summarizes the characteristics of the Forbush decrease event. In the Nagoya muon detector, thirty-six detectors with a size of 1 m2 are arranged in two layers (i.e., upper and lower layers), and incident muons from various directions could be detected. The cutoff rigidity shown in the table is the cutoff rigidity value in the vertical direction in which the incidence of muons is the largest. The Nagoya and Seoul muon detectors showed similar levels of flux decrease. As the cutoff rigidity of the Oulu neutron monitor was smaller than that of the Daejeon neutron monitor, and thus the flux decrease at the Oulu neutron monitor was found to be larger. On the other hand, small-scale Forbush decrease was observed on 13 March at the Nagoya, Daejeon, and Oulu stations, but it was not observed at the Seoul station.
In this study, typical flux variations of cosmic rays
[Table 2.] Characteristics of Forbush decrease at each station on 7 March 2012.
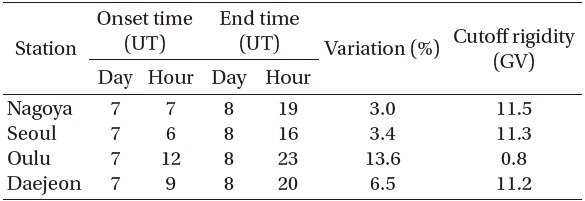
Characteristics of Forbush decrease at each station on 7 March 2012.
were investigated using the cosmic ray observation data obtained from the stations in currently operation in Korea. The specifications and characteristics of the Seoul muon detector that has been operated since October 1999 and of the Daejeon neutron monitor that has been operated since October 2011 were briefly introduced. The muon detector is a small-scale detector that consists of four plastic scintillators, and the neutron monitor is the 18NM64, which is a global standard model. Based on the analysis of the cosmic ray observation data, the seasonal variation of the muon flux was identified, which is the inherent characteristic of muons caused by the changes in the altitude of muon formation. The muon and neutron fluxes showed a typical diurnal variation, and the phases in which the maximum flux occurred approximately between 13:00 and 14:00 were observed. Also, the analysis of the cosmic ray flux variation profiles depending on time for the Forbush decrease which occurred on 7 March 2012 indicated that the Seoul muon detector and Nagoya muon detector had similar profile shapes and flux decrease. For the Daejeon neutron monitor, the flux decrease was smaller than that of the Oulu neutron monitor, due to the large cutoff rigidity, but they showed similar flux profiles.
In Korea, cosmic ray observation has been initiated systematically, and it was found that the quality of the observation data was comparable to that of the data from overseas stations. Therefore, it is expected that the existing dependence on the observation data from overseas observatories could be resolved. The non-simultaneity of Forbush decrease has been reported in the previous studies (Oh et al. 2008, Oh & Yi 2009, 2011, Lee et al. 2013), and it is thought that the local specificity of space environment changes could be verified through the cosmic ray observation. Especially, the neutron monitor at the McMurdo Station is planned to be moved to the Jang Bogo Antarctic Research Station, which is under construction. Therefore, it is expected that the space environment changes in the polar region and the mid-latitudes (i.e., the Korean peninsula) could be compared and complemented.