Cellular networks are on the verge of a third phase of growth. The first phase was dominated by voice traffic, and the second phase, which we are currently in, is dominated by data traffic. In the third phase, it is predicted that the traffic will be dominated by video, and will require new ways to optimize the network to prevent saturation [1]. The increasing demand for multimedia-based communications is made viable by increased computational resources in mobile phones, such as with the advent of graphics processing units like the NVIDIA Tegra, and special-purpose video processing chips, such as ARM Mali-VE6. The evolution of video services to mobile segments (such as YouTube and IPTV [2]) and the evolution to new mobile broadband standards like WiMAX IEEE 802.16m, 3G long-term evolution (LTE), and LTE-Advanced have also contributed. Service and network providers are exploring opportunities to further enhance their current offerings, and to increase revenues by catering to the demand for rich multimedia services to both mobile and fixed users using cellular networks, such as LTE.
LTE is emerging as a major candidate for 4G cellular networks, and is being adopted by various cellular providers (including AT&T and Verizon Wireless in the United States). The major features that distinguish LTE from 3G technologies at the air-interface are orthogonal frequency division multiple access (OFDMA), advanced multipleinput multiple-output (MIMO) technology, and hybrid automatic repeat request (HARQ). In addition, LTE uses flat-IP architecture for the core network. LTE uses OFDMA in the downlink (DL) for efficient multiple access, and for countering multipath frequency-selective fading. OFDMA divides the available channel into a number of sub-carriers, and is naturally suitable for scalable bandwidth allocation by varying the fast Fourier transform size. In this paper, we concentrate only on the DL.
LTE’s enhanced Universal Mobile Telecommunications System (UMTS) Terrestrial Radio Access (E-UTRA) and evolved packet core network also involve the establishment of an all-IP network [3]. Any issues that degrade a network’s ability to deliver packets will degrade the quality of any real-time services of customers currently connected to the network. In the case of video services, this degradation is likely to result in the pausing of playback due to buffer starvation, macroblocking, or full loss of picture, depending on the video frames.
LTE supports a full range of multiple-antenna transmission techniques, including transmit diversity (TD) [4], spatial multiplexing (SM) [5], and closed-loop eigenbeamforming [6], which are suited for different objectives. TD is used for obtaining reliable transmissions, and is achieved by using space frequency block codes [7] in LTE. SM is used for obtaining enhanced throughput, and is achieved by using layered space time codes [5]. Eigenbeamforming is also used to improve the reliability of transmissions when accurate channel state information is available.
Traditional link adaptation techniques use only channel quality information to adapt the modulation/coding scheme (MCS) level used for transmissions. While it is helpful to adapt modulation or coding rates, the lack of an application layer feedback leads to wastage, or an insufficient increase in these modulation rates. An application layer feedback of video quality can be very helpful to fine-tune the modulation and coding rates in video delivery scenarios.
The contributions of this work are as follows: 1) this paper presents trade-offs between perceived video quality and transmission delay with variations in modulation and coding rates, 2) the trade-off can be used to derive an optimal modulation and coding rate for a given network condition, and 3) we use no-reference video quality metrics (blocking and blurring) to evaluate video transmission over an LTE network.
Section II gives a brief overview of the no-reference video quality assessment metrics (blocking and blurring) used in this experiment. Section III gives details of the LTE downlink link level Matlab simulator, followed by details of the experimental setup in Section IV. Section V gives details of the experiments conducted and the results, followed by conclusions in Section VI.
The two primary methods for measuring perceived video quality are subjective and objective methods. Subjective methods involve asking a collection of viewers to watch a video stream, which is rated between 1 and 5. For the purpose of a deployed service, this method of measuring video quality is clearly not feasible. Objective methods involve performing an analysis of the network or video stream data (typically, as close to the user as possible) in order to extract data that can be used as an input to an algorithm used to rate the quality of the video sequence.
A survey of existing efforts [8,9] in this direction indicates a large amount of literature on the spatial and temporal assessment of distortions in videos [10-12]. These metrics are quite suitable for characterizing the losses in a wireless environment. However, many of these metrics are full-reference (FR), and not suitable for mobile videos for two reasons: 1) it is not possible to have a source video available in the case of commercial deployments (online measurements). An FR strategy can only be used with experimental setups. 2) Wireless networks have frequent packet losses, which lead to inaccuracy in traditional FR calculations. Packet losses in a network lead to frame losses in a video, which lead to frame mismatches between the source and received videos, which lead to this inaccuracy [12].
Thus, there are efforts towards using no-reference (NR) metrics to measure video quality. Such metrics do not require any prior knowledge of the transmitted video. Human observers can easily assess the quality of a distorted image without examining the original image as a reference. In contrast, designing objective NR quality measurement algorithms is a very difficult task. Currently, NR quality assessment is feasible only when prior knowledge about the types of image distortion is available. This assumption is valid for all transmission purposes if we focus on quantizing and reducing the distortions typically caused by network transmissions of video.
Blocking artifacts [13] arise from the appearance of vertical and horizontal edges along a regular blocking grid resulting from the block-based processing in image and video coding standards. Typically, in a wireless scenario, packet loss may result in increased blockiness. The goal of a blocking effect measurement algorithm is to detect and estimate the power of a blocky signal along the horizontal and vertical blocking dimensions. The algorithm estimates the power of a blocky signal, and then reduces the DC value to remove the power contribution of a natural image, making it not subjective to the type of image. This metric is good for modeling the channel packet drops and its corollaries.
Blurring [14] is caused by the removal of high-frequency content from the original video signal. This metric is useful to see the variation in frame quality with a changing quantization parameter of a video codec, or loss in the enhancement bitstreams of a video.
NR quality evaluation metrics such as blocking and blurring are used to evaluate perceived video quality without any reference to the original videos. Using such metrics, it is possible for the base station (which is called eNB in LTE) to adapt the delivered stream based on video quality, and not the bit-rate [15].
The EvalVid framework [16] allows for the evaluation of the H.264 framework using subjective metrics (such as mean opinion score) and objective metrics (such as peak signal-to-noise ratio [PSNR]). As such, any derivations of EvalVid, such as EvalSVC [17], also restrict video quality evaluations to PSNR-based metrics, which have disadvantages of not being close to the human visual system, and being FR, which makes them impractical in consumer delivery scenarios.
III. LTE DOWNLINK LINK-LEVEL SIMULATOR
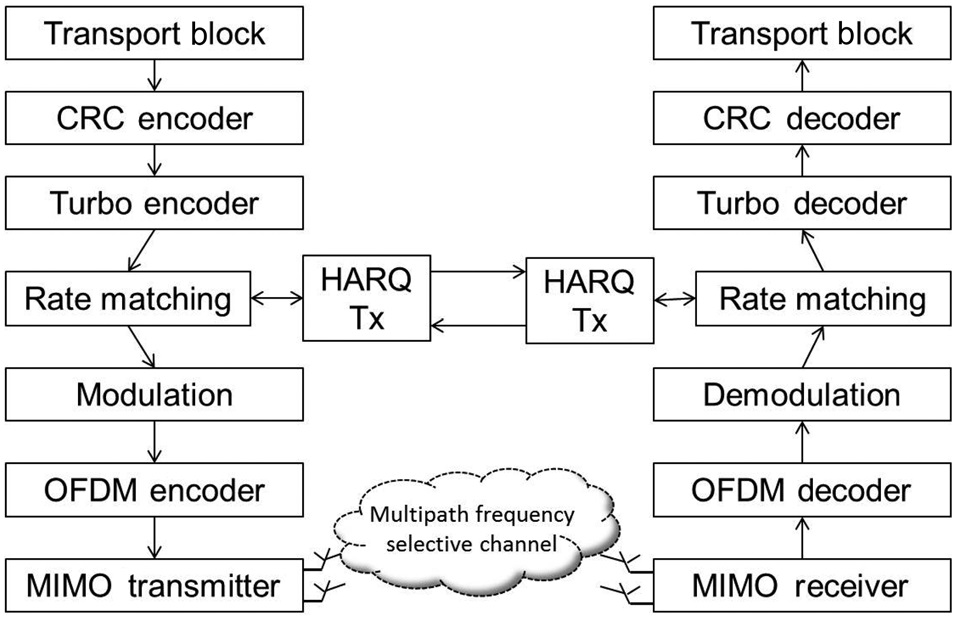
In this section, we briefly describe the LTE DL linklevel simulator framework (Fig. 1). The main features of the simulator are as follows:
1) MIMO modes (TD and spatial multiplexing),
2) Forward error correction using turbo codes,
3) OFDMA with cyclic prefix,
4) Incremental redundancy (IR) HARQ combining,
5) Transport block error detection using cyclic redundancy check,
6) Rate matching.
LTE uses a rate 1/3 parallel concatenated convolutional code consisting of two identical 8-state rate convolutional encoders connected in parallel using an internal interleaver. Viterbi decoding of the turbo codes complex due to the large number of states involved in a concatenated trellis. So, we use an algorithm based on an iterative maximum a posteriori detector [18] as a practical alternative decoding scheme.
In the DL, LTE uses an asynchronous and adaptive HARQ mechanism. The schedule of the HARQ transmissions is not pre-declared to the UE. This gives the eNodeB flexibility in scheduling according to priorities and available resources. LTE uses an IR HARQ as opposed to chase combining. LTE supports up to four redundancy versions for IR HARQ transmissions (or transmissions) denoted by
The rate matching converts the rate 1/3 output from the turbo encoder into the target coding rate. This is done by a block consisting of three sub-block interleavers, a circular buffer, and a bit-selection block [19]. The number of bits selected depends on the target coding rate. The start point (or offset) of the selected bits is determined by
[Table 1.] Long-term evolution (LTE) orthogonal frequency division multiple access parameters
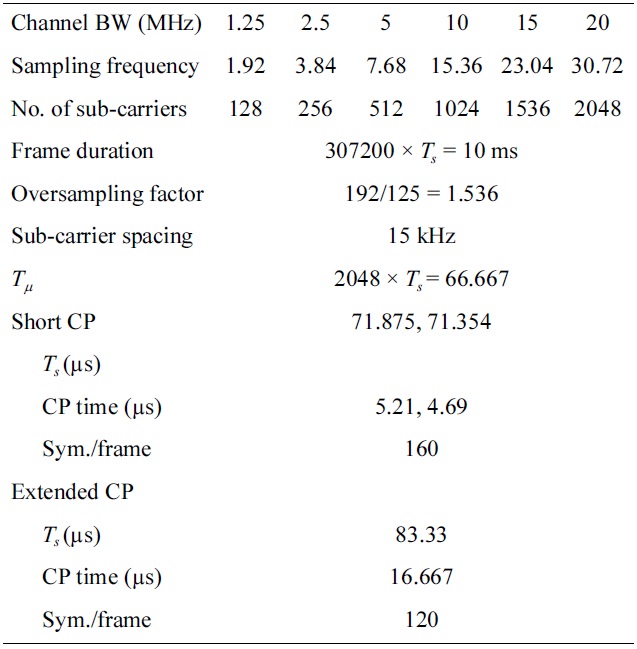
Long-term evolution (LTE) orthogonal frequency division multiple access parameters
the HARQ redundancy version of
LTE uses OFDMA for DL access. The available frequency is divided into sub-carriers of 15-kHz bandwidth. The LTE-specific OFDMA parameters are listed in Table 1 [20].
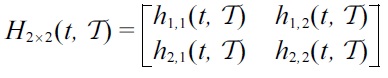
One of the main features of LTE is the use of multiple antennas, or MIMO technology, to enhance the throughput in an unreliable wireless channel. An
In LTE, TD is obtained by use of space frequency block codes (SFBC) as opposed to space time block codes. SFBC obtains TD using redundancy in the spatial and frequency domains. For a 2 × 2 MIMO system, the optimal diversity scheme is the Alamouti code [4]. The transmission matrix for the Alamouti code is given by:
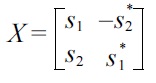
where
A tapped delay line model is used to model a multipath frequency-selective channel
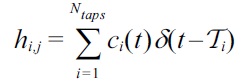
where
While the power delay profile is caused by the multipath effect, the motion of objects causes a Doppler spectrum, which gives the statistical distribution of the channel at a particular frequency. In addition, zero-mean additive white Gaussian noise (AWGN) is added at each receiver antenna, the variance of which is varied to obtain different SNR realizations. The received signal vector is finally given by:
y(t, T) = H(t, T)*X + N0
where
We integrated a video coding subsystem into our LTE link-level simulation developed in Simulink. We used Matlab v7.11 with Simulink for this set of experiments. The encoded video (motion vectors and bits) was transmitted using an LTE simulator. The receiver decodes the received video stream, which is used for NR evaluation. We also used a delay metric in our experiment to account for the transmission delay (and delay variations) caused by the use of different channel modulation schemes and turbo code rates. The HARQ retransmission value was kept to a moderate level of 2.
Delay measurement is difficult in Matlab, because the simulation is actually slower than real-time, so real values cannot be used directly as is done conventionally using real-time workshop features in Matlab. Instead, we implemented this feature by obtaining the difference between displayed frames in the encoder and decoder, normalized by the frames per second of the sample video.
Blocking artifacts arise from the appearance of vertical and horizontal edges along a regular blocking grid resulting from block-based processing in image and video coding standards. Typically, in a wireless scenario, packet loss may result in increased blockiness. The goal of the blocking effect measurement algorithm is to detect and estimate the power of a blocky signal along the horizontal and vertical blocking dimensions [13]. The algorithm estimates the power of the blocky signal and then reduces the DC value to remove the power contribution of a natural image, making it not subjective to the type of image. This metric is good for modeling the channel packet drops and their effect on video quality. The logarithm of the blocking values is used (direct logarithm base 2 without any scaling factor).
Blurring is caused by the removal of high-frequency
content from the original video signal. This metric is useful to see the variation in frame quality with a changing quantization parameter of the video codec or loss in the enhancement bitstreams in a video. The blur detection scheme is based on the histogram computation of nonzero DCT coefficients [14].
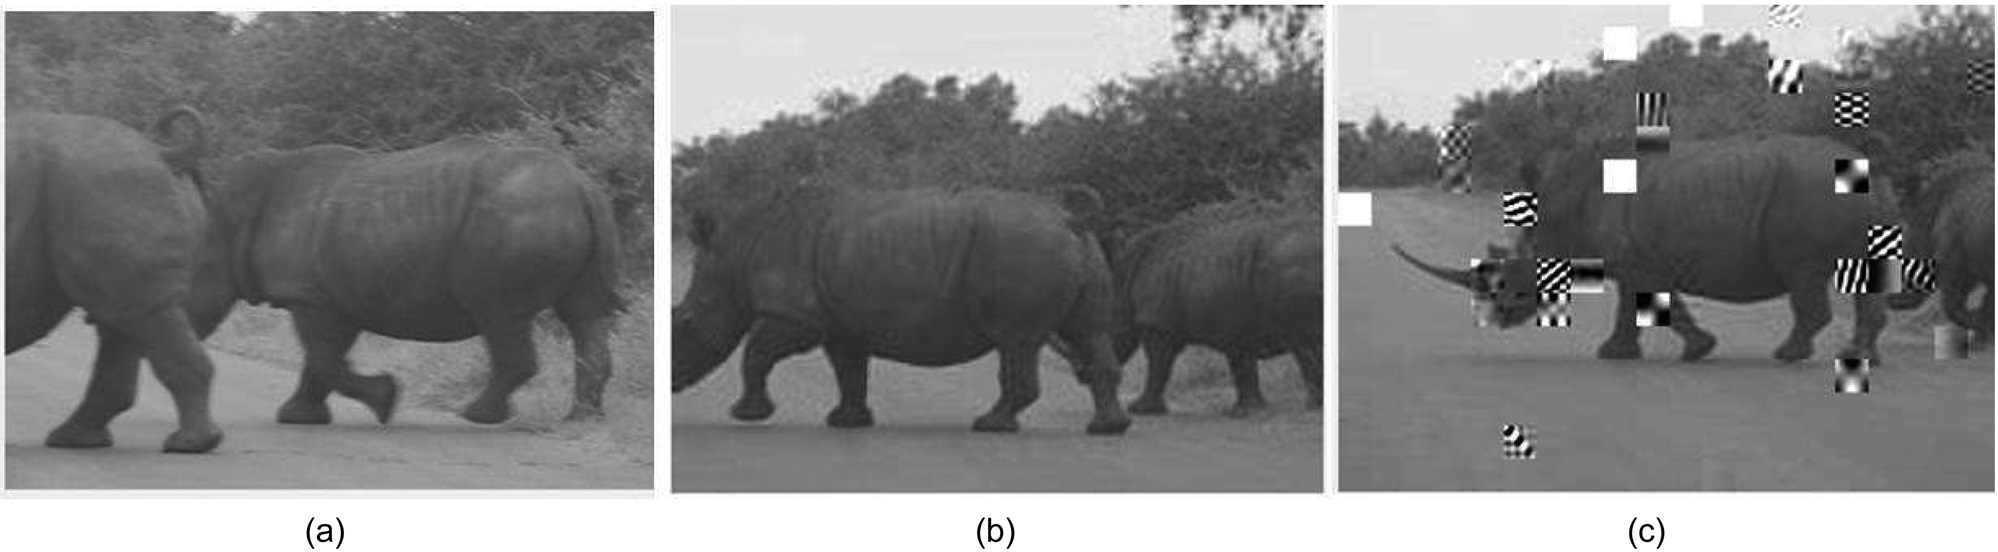
Fig. 2a shows a sample frame from test video. Fig. 2b shows a sample frame with blurring, while Fig. 2c shows a sample frame with blocking.
The measurement of blocking artifacts indicates a rapid decline in performance with increasing modulation. With 4-QAM, almost all the frames experience zeroblocking, while for 16-QAM, more frames experience high blocking. With 64-QAM, almost all the frames experience high blocking.
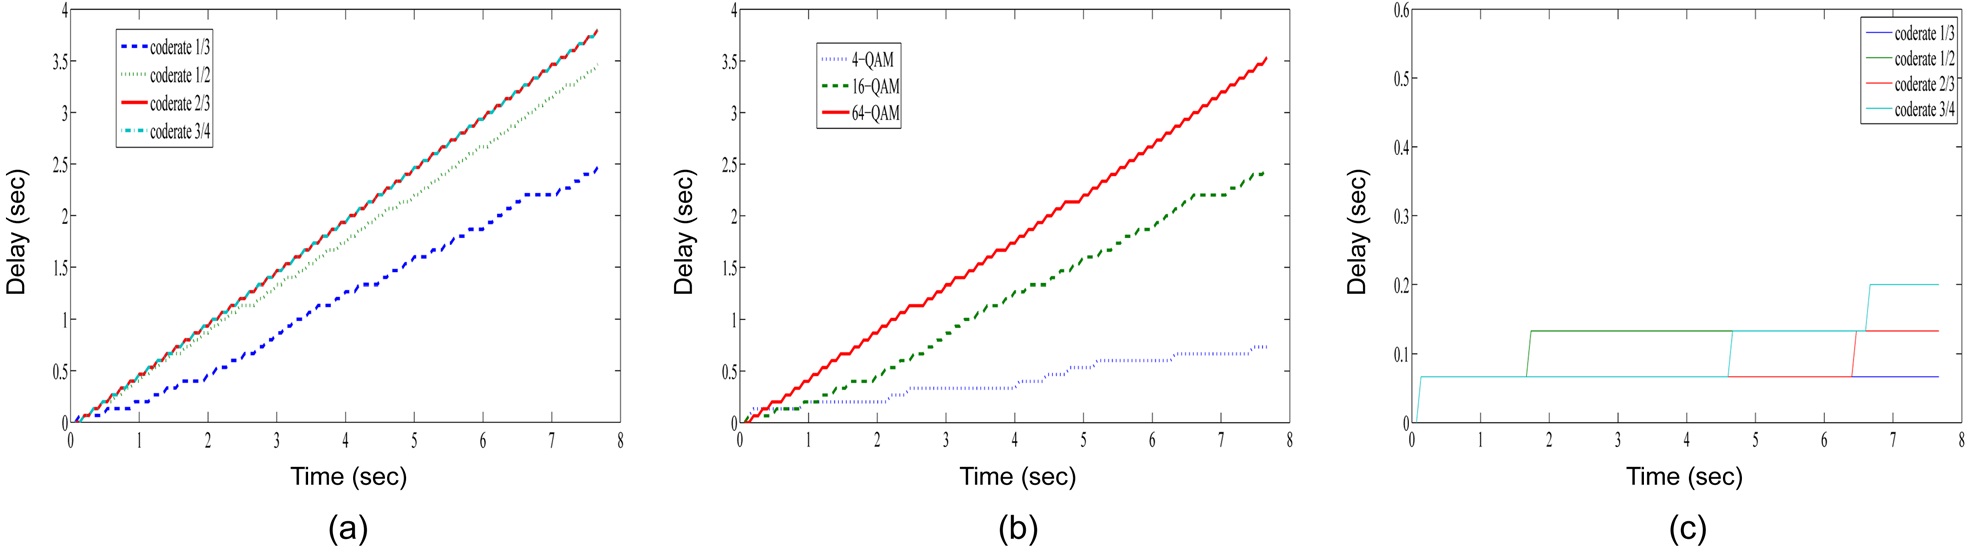
We illustrate the performance evaluation using the ‘rhino.avi’ sample video clip (115 frames, 7.67 seconds at 15 fps, resolution: 320 × 240). The channel conditions were poor, and the SNR was set to 0 to illustrate the variations with modulation. The code rate for the turbo encoder was set to 1/3. In Fig. 3a?c, we plot the video reception delay (the delay between the first transmission of a frame and the passing of received frame to the video display by the LTE receiver) in different channel conditions for different modulation rates and code rates. Note that this delay is cumulative, in that once a frame experiences a certain delay, subsequent frames experience higher delays. Individual frame delays are limited by the maximum number of HARQ retransmissions allowed. The slope of any delay curve represents the delay performance for the corresponding modulation scheme. We observe that higher modulation rates and higher code rates (3/4, 2/3) experience higher delays when the channel conditions are poor. This is due to the higher packet loss, and subsequently higher number of HARQ retransmissions involved when using higher modulation rates in poor channel conditions. The delay is very small in good channel conditions (Fig. 3c).
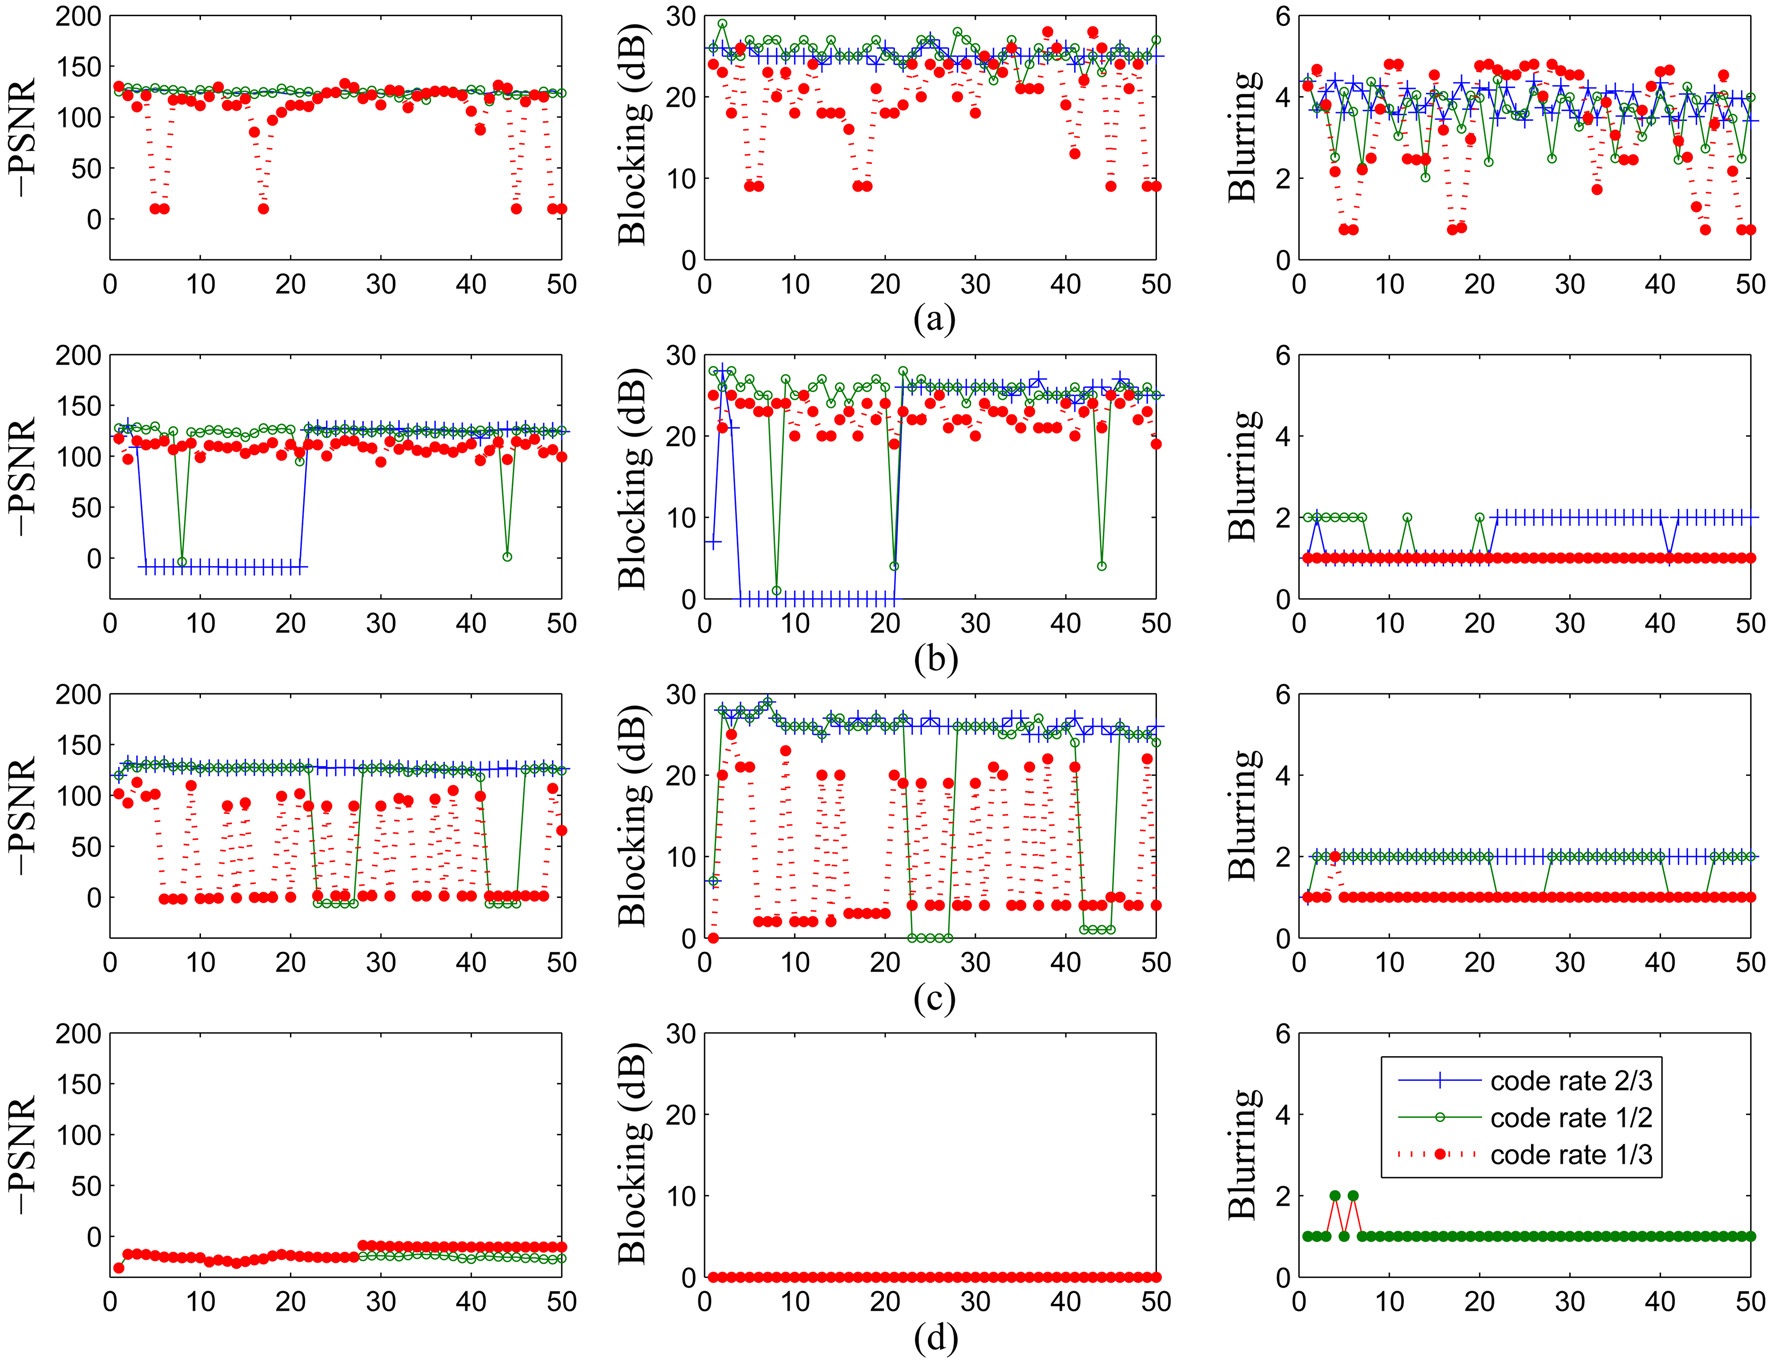
The performance of video delivery with the variation of code rates is characterized in Fig. 4. The modulation
rate was kept constant at 32 bits/symbol, while HARQ was set to the LTE default value of 4. Since we are working on an LTE simulator in Matlab, we had full access to the original video. Hence, we plot PSNR values for all received video files. When we plot blocking in decibels, we observe a strong negative correlation with the PSNR metric as compared to the blurring metric. For poor channel conditions (0 dB), only a few frames have good PSNR values (only when the code rate is low, up to 1/3). The same performance is observed for an SBNR of 10 dB, except for the case with a code rate of 2/3, where there is an unusual stretch of 15 seconds where the Matlab simulator does not incur major losses and the PSNR is very high. For SNR = 13 dB, we can see the distinct performance for the three code rates and also how blocking correlates strongly to PSNR. In an earlier set of results, we showed that changing the SNR also leads to changing the delay performance, depending on which modulation rate is chosen.
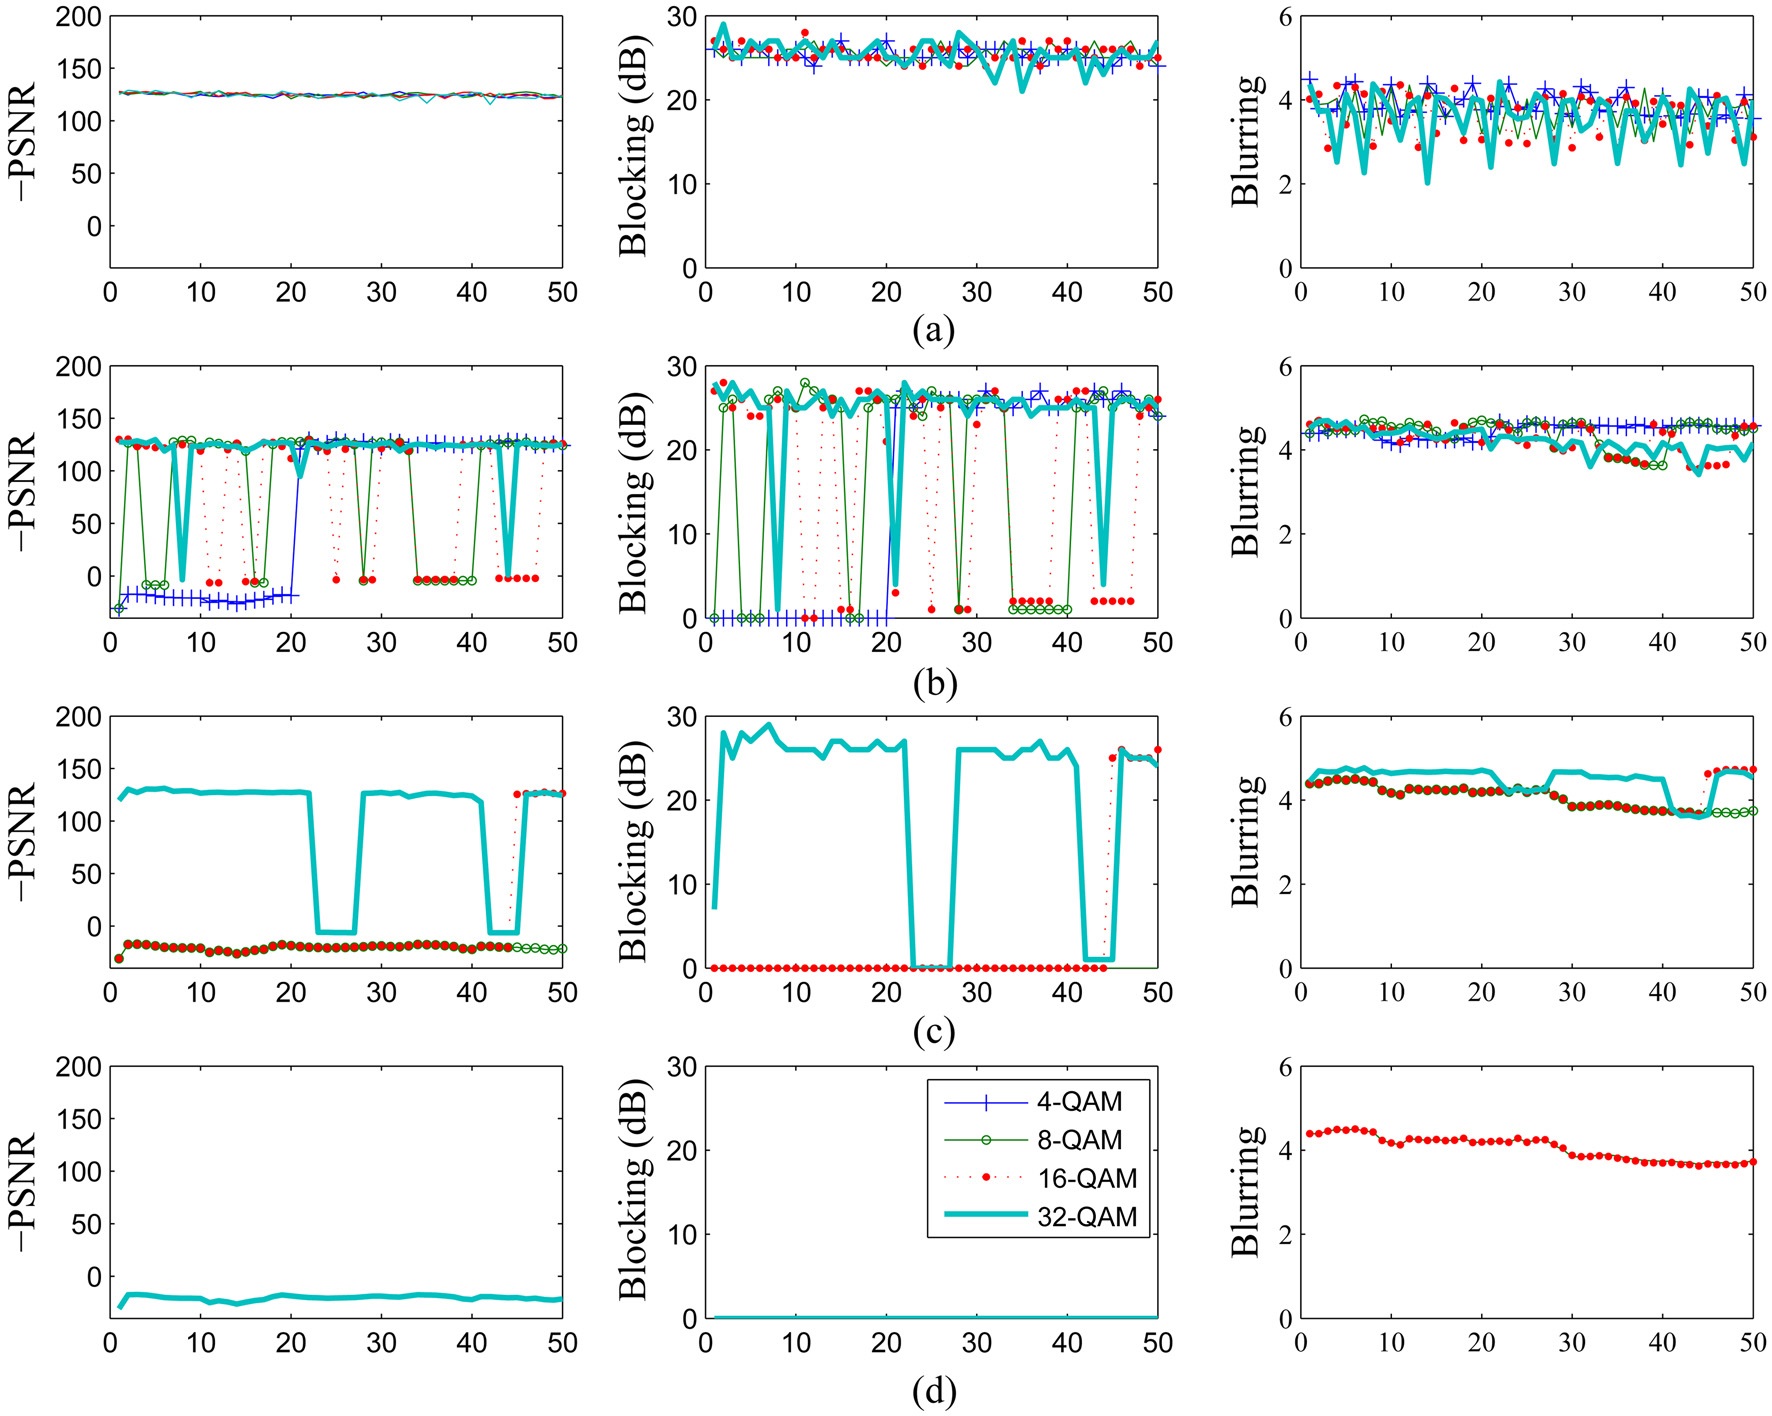
Fig. 5 shows the variations in quality with the variation of the modulation scheme at a fixed code rate. For a low SNR (0 dB), all the modulation rates give poor performance, leading to extremely low PSNR values (close to -130). Thus, the blocking values are close to 30 (log scale). However, the blurring values have small oscillations,
ranging from 2 to 4. In most of the plots, we observe that the performance of 4-QAM is similar to that of 8-QAM. Hence, the plots for 4-QAM overlap the plot for 8-QAM. For SNRs of 10 and 13 dB, we can observe a very strong correlation between blocking and PSNR values.
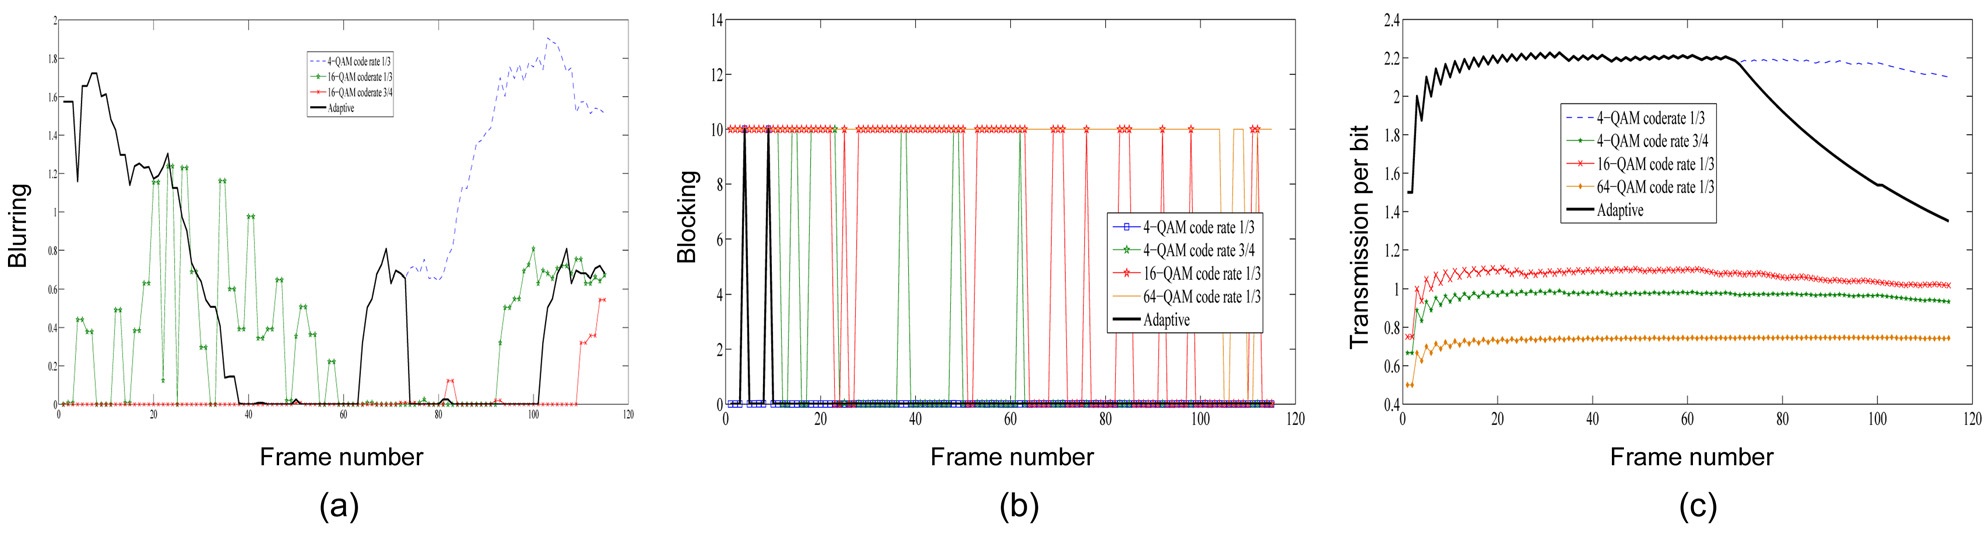
In Fig. 6, we vary the channel SNR from poor to good scenarios with time. This represents a situation where a user starts a video download in bad channel conditions and is moving towards better channel conditions while in the process of video downloading. Specifically, we increase the SNR by 1 dB for every 4 frames transmitted. An adaptive profile tried to use the highest modulation and lowest code rate to achieve the least blocking. Fig. 6 shows how an adaptive profile can reduce the blocking artifacts. For the first 70 frames of the simulation, the adaptive profile chooses 4-QAM with a code rate of 1/3, and then shifts to 4-QAM with a code rate of 3/4, followed by 16-QAM for high SNR (more than 100 frames). The advantage of such an adaptation is illustrated in Fig. 6c, which shows the number of transmissions per bit for when HARQ is set to 2. For the case of high blocking,
the value saturates at 2 times the original value (for all profiles). For 4-QAM at a code rate of 1/3, even before saturation (at low SNR) this value is improved. For higher modulations, this value is saturated quickly and does not recover (as in the case of 64-QAM). For high SNR, there is a slight dip in the curves. The adaptive profile changes the code rate and modulation with changes in SNR, and thus shows significant improvement over 4- QAM at a code rate of 1/3 with similar image quality (in terms of blocking).
We have presented a cross-layer approach to adaptive modulation and coding (AMC) in an LTE scenario using NR blocking and blurring metrics. NR metrics can be used in practical deployment scenarios for link-adaptation based on blocking and blurring values, instead of using channel conditions (Channel Quality Index metric [CQI]) as a reference. In future work, we would like to conduct an in-depth analysis of AMC using these metrics and their gain over using CQI values.