The trend toward increasing complexity of electronic devices and environments has made the computational burden of a realistic system for a full-wave electromagnetic (EM) analysis a growing concern. The power balance (PWB) method to assess statistical variations of EM fields was proposed as an efficient alternative method, in conjunction with the concept of the topology analysis [1], and its utility for large complex structures has recently been discussed [2] along with the theoretical background of statistical treatment. However, its validity over various amounts of power losses inside the same environment remains to be analyzed.
The aim of this paper is to propose an experimental validation model that uses a reverberation chamber to verify the availability of this statistical EM analysis method. Reverberation chambers have been widely used as test in the area of electromagnetic compatibility (EMC) measurements or for multi-input multi-output communications. We have focused the stochastic “ensemble” as the most fundamental feature of this chamber [3]. Measurements are performed under several non-ideal conditions, which correspond to the EM power losses in each environment. The PWB method is validated by comparing the results with those of the PWB analysis of a proposed experimental model.
Ⅱ. A Validation Model and PWB Analysis
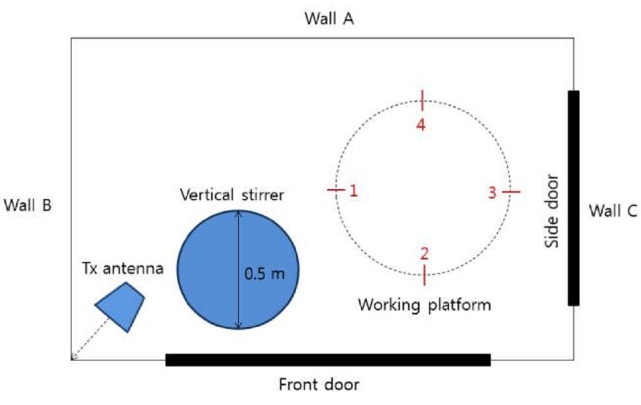
The proposed model in this paper was developed using the reverberation chamber located at Korea Advanced Institute of Science and Technology. The chamber configuration is shown in Fig. 1. The chamber size is 1.8 m×1.2 m×1.4 m. The vertical mode stirrer is present to the left of the main door. The flat absorber (60 cm×60 cm), front door (80 cm×80 cm), and side door (60 cm×60 cm) are used to incorporate the EM losses in various situations. Detailed measurement conditions are discussed in Section III.
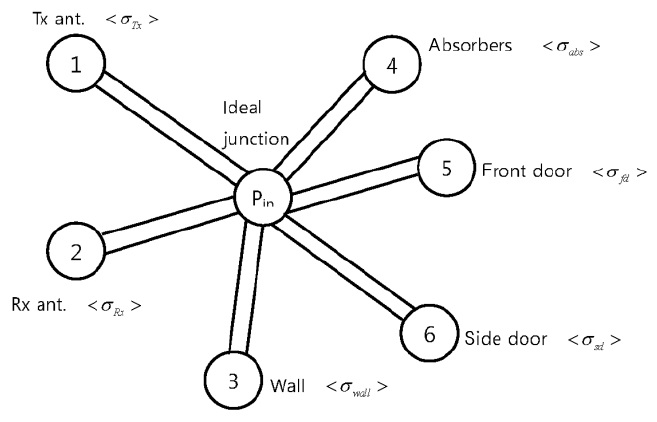
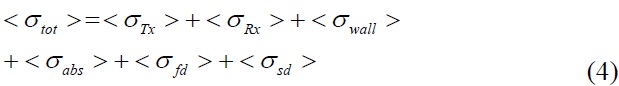
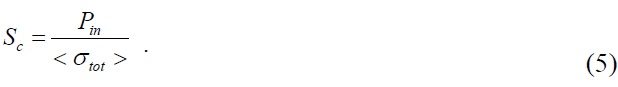
The PWB method outlined in [2] is used to characterize the proposed model shown in Fig. 1 by the topology network drawn in Fig. 2. The center ideal junction adds the total of the dissipated EM power,
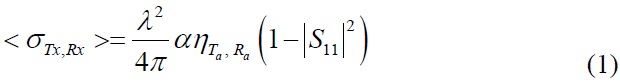
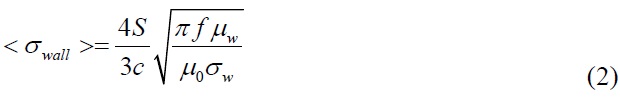
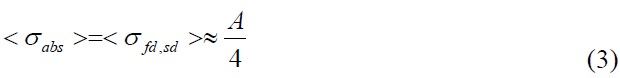
where
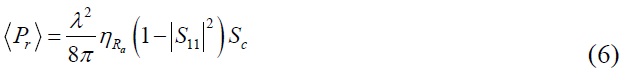
and the mean power density
Ⅲ. Measurement Results and Validations
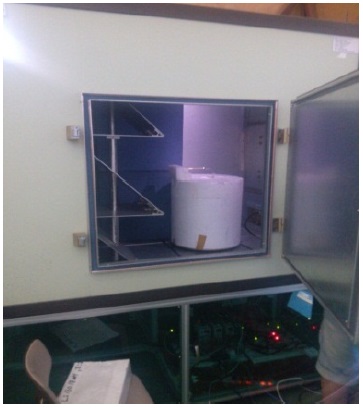
Measurement data were collected by rotating the mode stirrer through 2001 equally-spaced positions from a variety of test conditions. The experimental configuration is described in Fig. 3. Several aperture losses were added to the chamber model in order to increase cross section <
where the < > symbol denotes the ensemble average.
[Table 1.] All measurement conditions correspond to the totalpower loss
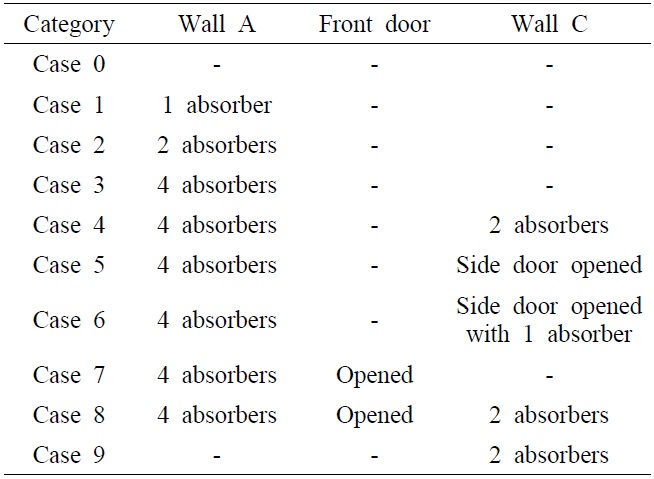
All measurement conditions correspond to the totalpower loss
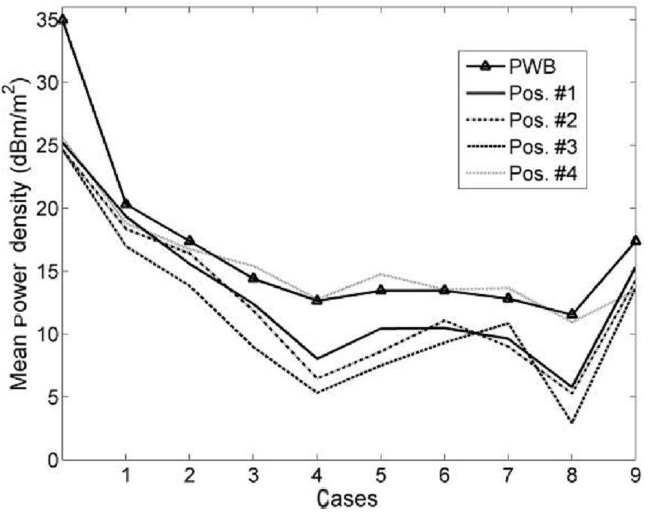
The measurement results for all conditions in Table 1 are plotted in Fig. 4. Also shown in the figure is the result of the PWB analysis from Eq. (5) for all experimental conditions. The large difference for the case 0 is mainly due to the insufficiency of the total power losses inside the environment for dissipating the feeding power [2]. Among the measurements, the curves are in good agreement except for the case of position 4, which shows a remarkable difference of a maximum 8 dB from the others. This is attributed to the fact that the measurement position is too close to the chamber wall and to the absorbers that incorporate the radiation losses; hence, the measurement is strongly influenced by the boundary field transition [5]. This correspondence allows the conclusion that the equivalence between the volume and ensemble average may be extended to the non-ideal lossy situation. The discrepancy between the PWB and the measurements also becomes more apparent as the environment losses increase, but it still shows relatively favorable correspondence within 10 dB, which is an adequate safety margin in the area of EMC.
In this paper, we have proposed an experimental validation model that uses a reverberation chamber to verify the PWB method. The reverberation chamber can be used to simulate the statistical “ensemble” field and environment losses by employing a mode stirrer and changing the experimental conditions. Good agreement was found between the measurements and the PWB analysis, indicating the efficiency of this statistical method for the analysis of general complex structures.