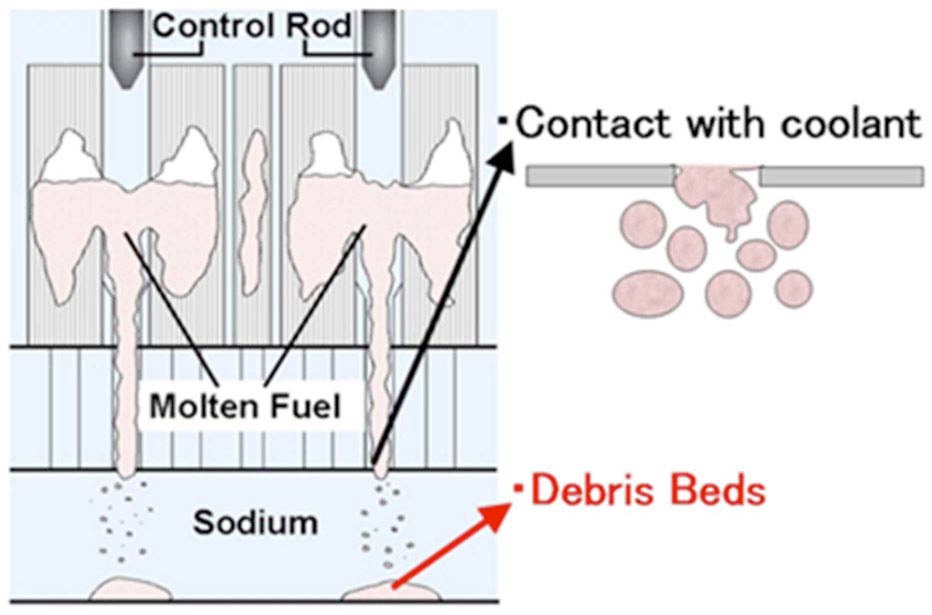
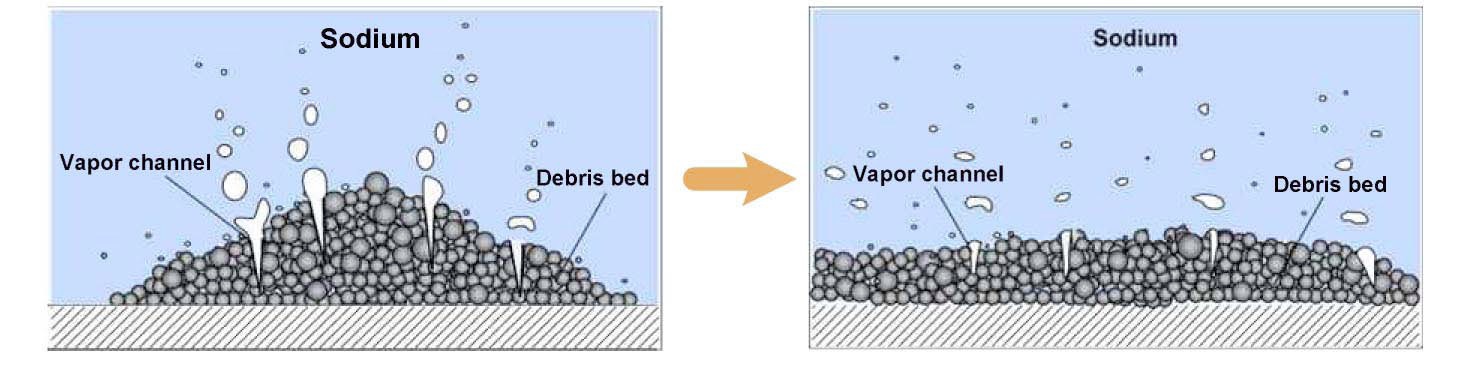
The disaster in March 2011 at the Fukushima Dai-Ichi nuclear power plant in Japan has caused many people to realize that severe accidents, including core disruptive accidents (CDAs), might occur, even if their probability is extremely low. During a postulated CDA in a sodiumcooled fast reactor (SFR), possibly as a consequence of rapid quenching and fragmentation of core materials, a multiphase flow system can form that could be composed of a mixture of liquid sodium, molten fuel, molten structure, refrozen fuel, solid fuel pellets, fission gas, fuel vapor, and other materials[1]. A deposition of this system will lead to the formation of debris beds over the core-support structure and/or in the lower inlet plenum of the reactor vessel, as depicted in Fig. 1 [2]. Typically, the debris bed, with particle size widely distributed, possibly ranging from several tens of microns to a scale of millimeters [3], will form roughly conically-shaped mounds. However, coolant boiling caused by decay heat, might lead ultimately to the leveling of the debris bed [4,5]. This mechanism, as illustrated in Fig. 2, defines the term ‘debris-bed self-leveling’.
To prevent the penetration of the reactor vessel by molten fuel, and distribute molten fuel or core debris formed in a CDA into non-critical configurations, in-vessel retention devices are used in some SFR designs [6]. A multi-layer debris tray installed in the bottom region of the vessel is one such device [7,8]. During a hypothetical
CDA, after being quenched and fragmented into fuel debris in the lower plenum region, discharged molten fuel is expected to accumulate on the different layers of the debris tray [7,8]. To stably remove the decay heat generated from the debris bed on the tray, the size, retention capability, and allocation of the tray should be carefully designed. Self-leveling is an important inducing factor to trigger molten fuel to transfer among the trays. In addition, selfleveling behavior will greatly affect the heat removal capability of debris beds [2,9]. Thus, the study of this behavior is of essential importance to the design of the tray.
Unfortunately, over the past decades, although some information on debris bed hydrodynamics and heat transfer has been available [10], very little work related to selfleveling has been performed. Most of these studies generally assume that the upper surface of the debris bed is level. Noting the importance of self-leveling in the heat removal capability, Hesson
Recently, to clarify the mechanisms underlying this behavior, several series of experiments were elaborately designed and conducted under the close collaboration between the Japan Atomic Energy Agency (JAEA) and Kyushu University (Japan). In those experiments, to simulate the coolant boiling during CDAs, various boiling methods, including depressurization boiling and bottom-heated boiling [2,4,5,9], as well as gas-injection [10,14-20], were employed. In addition, based on some experimental data from a preliminary test, applicability of empirical predictors to this behavior was investigated as well [16]. Although in the past the results of some individual tests were reported in published articles [2,4-5,9-10,14-19], no complete panorama has been described until now. Focusing on this aspect, this paper is dedicated to the synthesis and comparative analyses of those experiments. Conditions of the performed experiments are described in detail in Section 2, while the obtained results and their interpretations are discussed in Section 3.
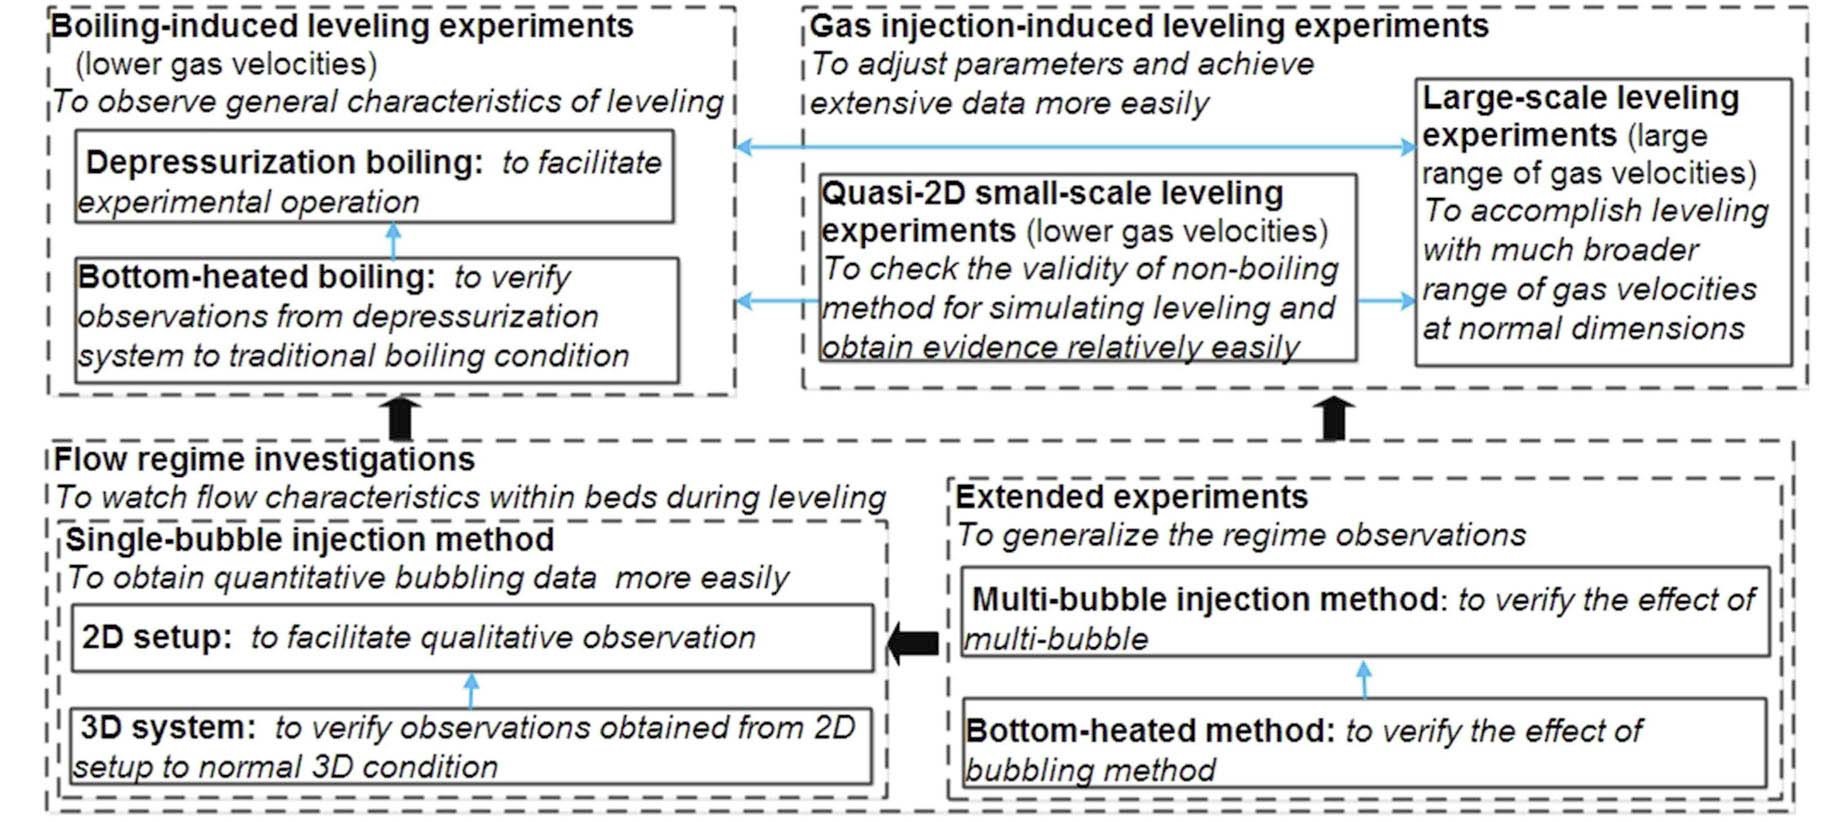
The performed leveling-related experiments are illustrated in Fig. 3. Overall, it seems that those experiments can be generally divided into two categories, namely the microscopic flow regime investigations and macroscopic leveling experiments.
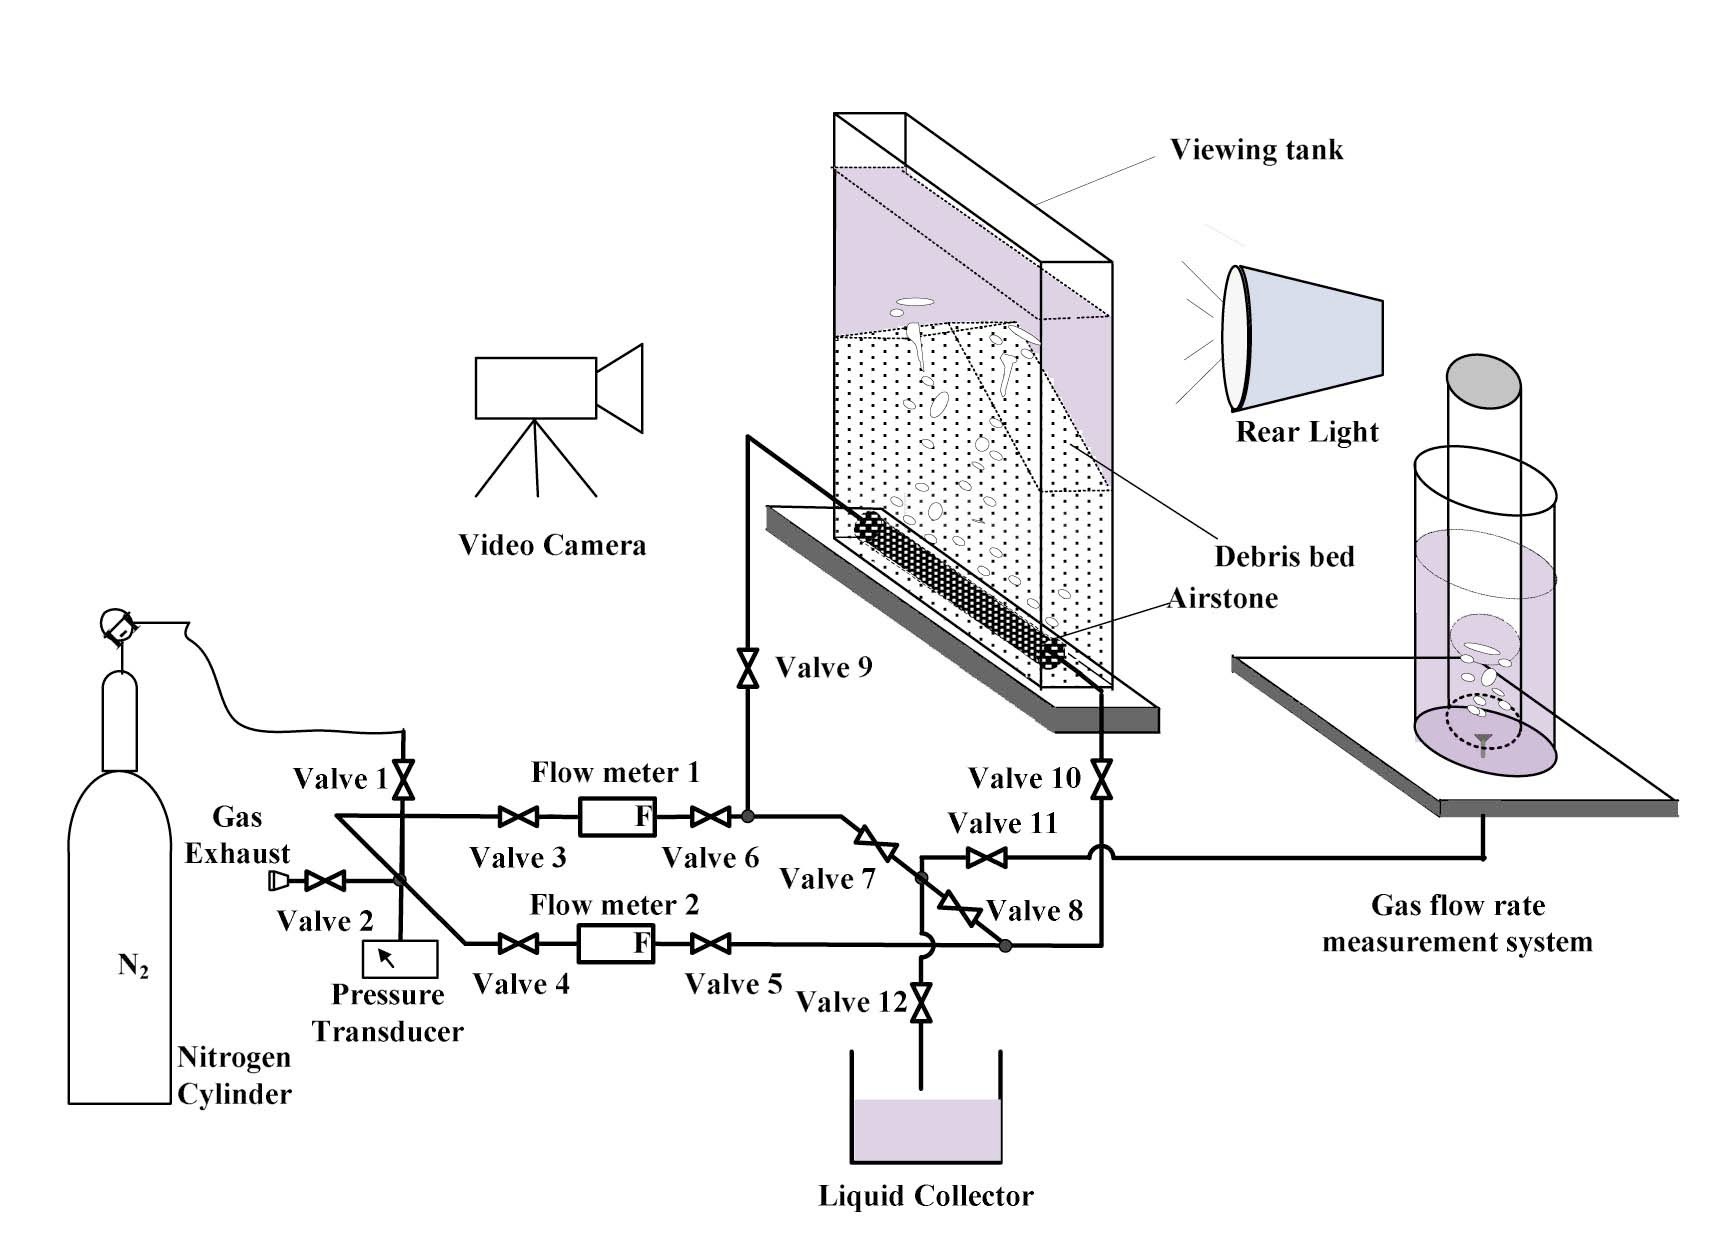
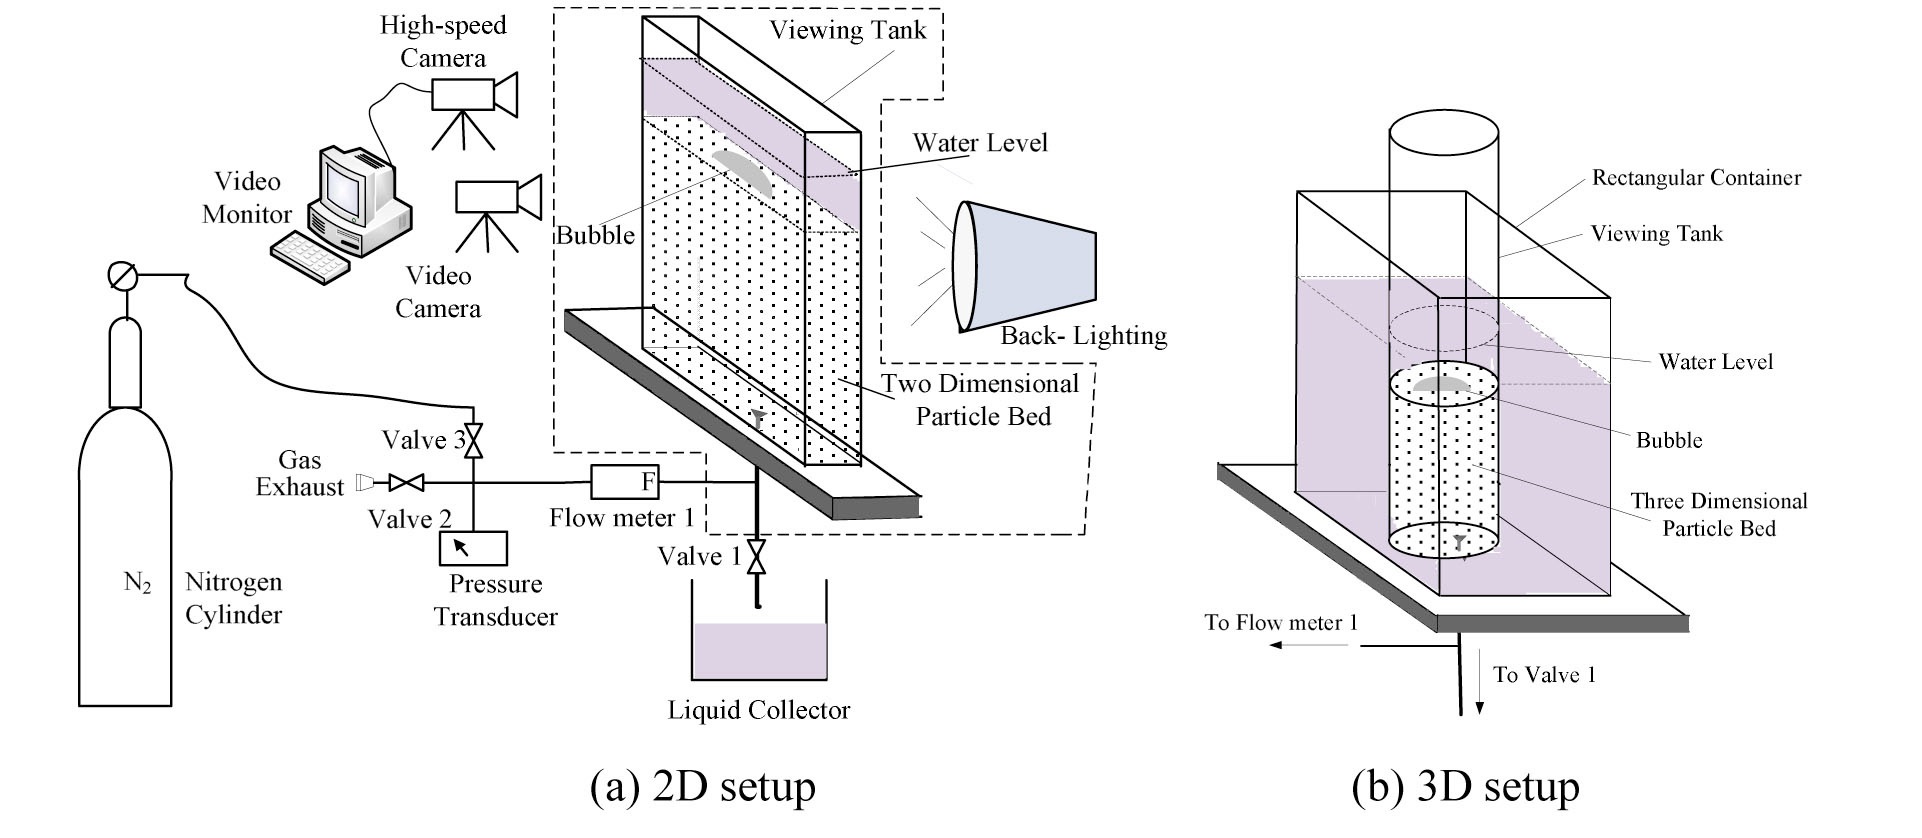
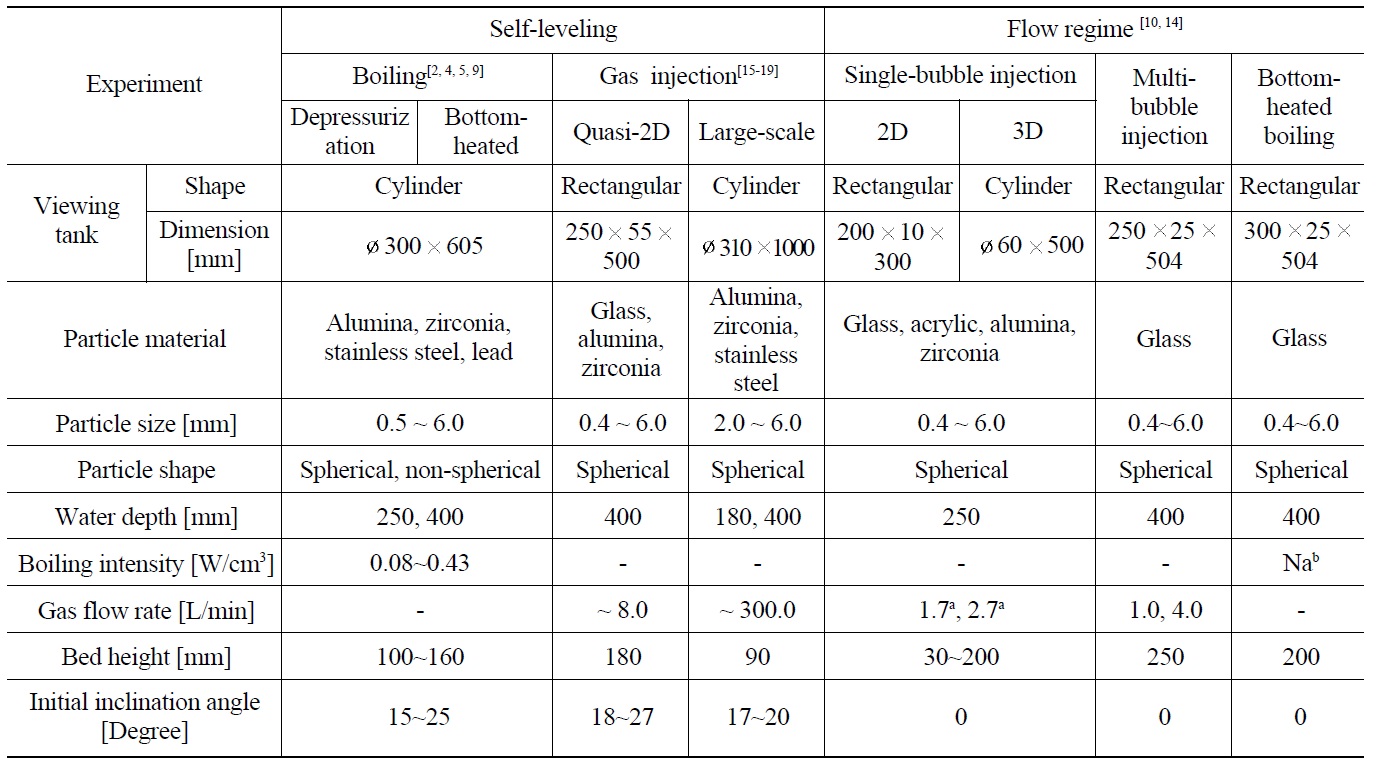
The flow regime investigations, which consist of several series of well-organized tests performed at various bubbling conditions, are devoted to showing the flow characteristics within particle beds, thus obtaining convincible visual evidence (esp. bubble-particle interaction) for supporting the understandings of the leveling behavior. To facilitate the qualitative identification, as well as acquirement of quantitative data, the investigations were primarily conducted by injecting a single train of nitrogen bubbles through a narrower two-dimensional (2D) rectangular viewing tank (200 mm×10 mm×300 mm)[10,14], though the obtained findings were quantitatively verified in a normal three dimensional (3D) system and in more general bubbling conditions, such as multi-bubble injection and bottom-heated boiling. The schematic view of the 2D setup using the single-bubble injection is shown in Fig. 4 (a), while its 3D counterpart can be visualized by substituting the apparatus in the dashed box with the apparatus shown in Fig. 4(b). Evidently, the major difference between the 2D and 3D systems is that for the 3D system a comparatively larger cylindrical container (60 mm diameter and 500 mm height) was employed. In addition, to avoid the convex distortions caused by the cylinder, a transparent container (80mm×80mm×390mm) was installed outside the cylinder and filled with the same liquid as that inside.
As for the leveling series, although in real reactor situations coolant is heated to its boiling point by the decay heat of fuel debris (thereby initializing self-leveling of the debris bed), depressurization, instead of conventional boiling methods, was principally employed to simulate an axially increasing void distribution in the particle bed [2]. On the other hand, to provide a more convincing argument validating the use of the depressurization method, a detailed series of conventional bottom-heated scenarios was also conducted. The bottom-heated boiling was chosen among the various conventional methods after comprehensive comparisons of cost, level of difficulty, and reliability of experimental results [2]. Compared with the more costly
volume-heated boiling method, bottom-heated boiling can also provide reasonable experimental information. The lag in axial heat transfer from the bottom to the top of the particle bed can be greatly reduced as high-thermal-conductivity materials were used as the components of the beds.
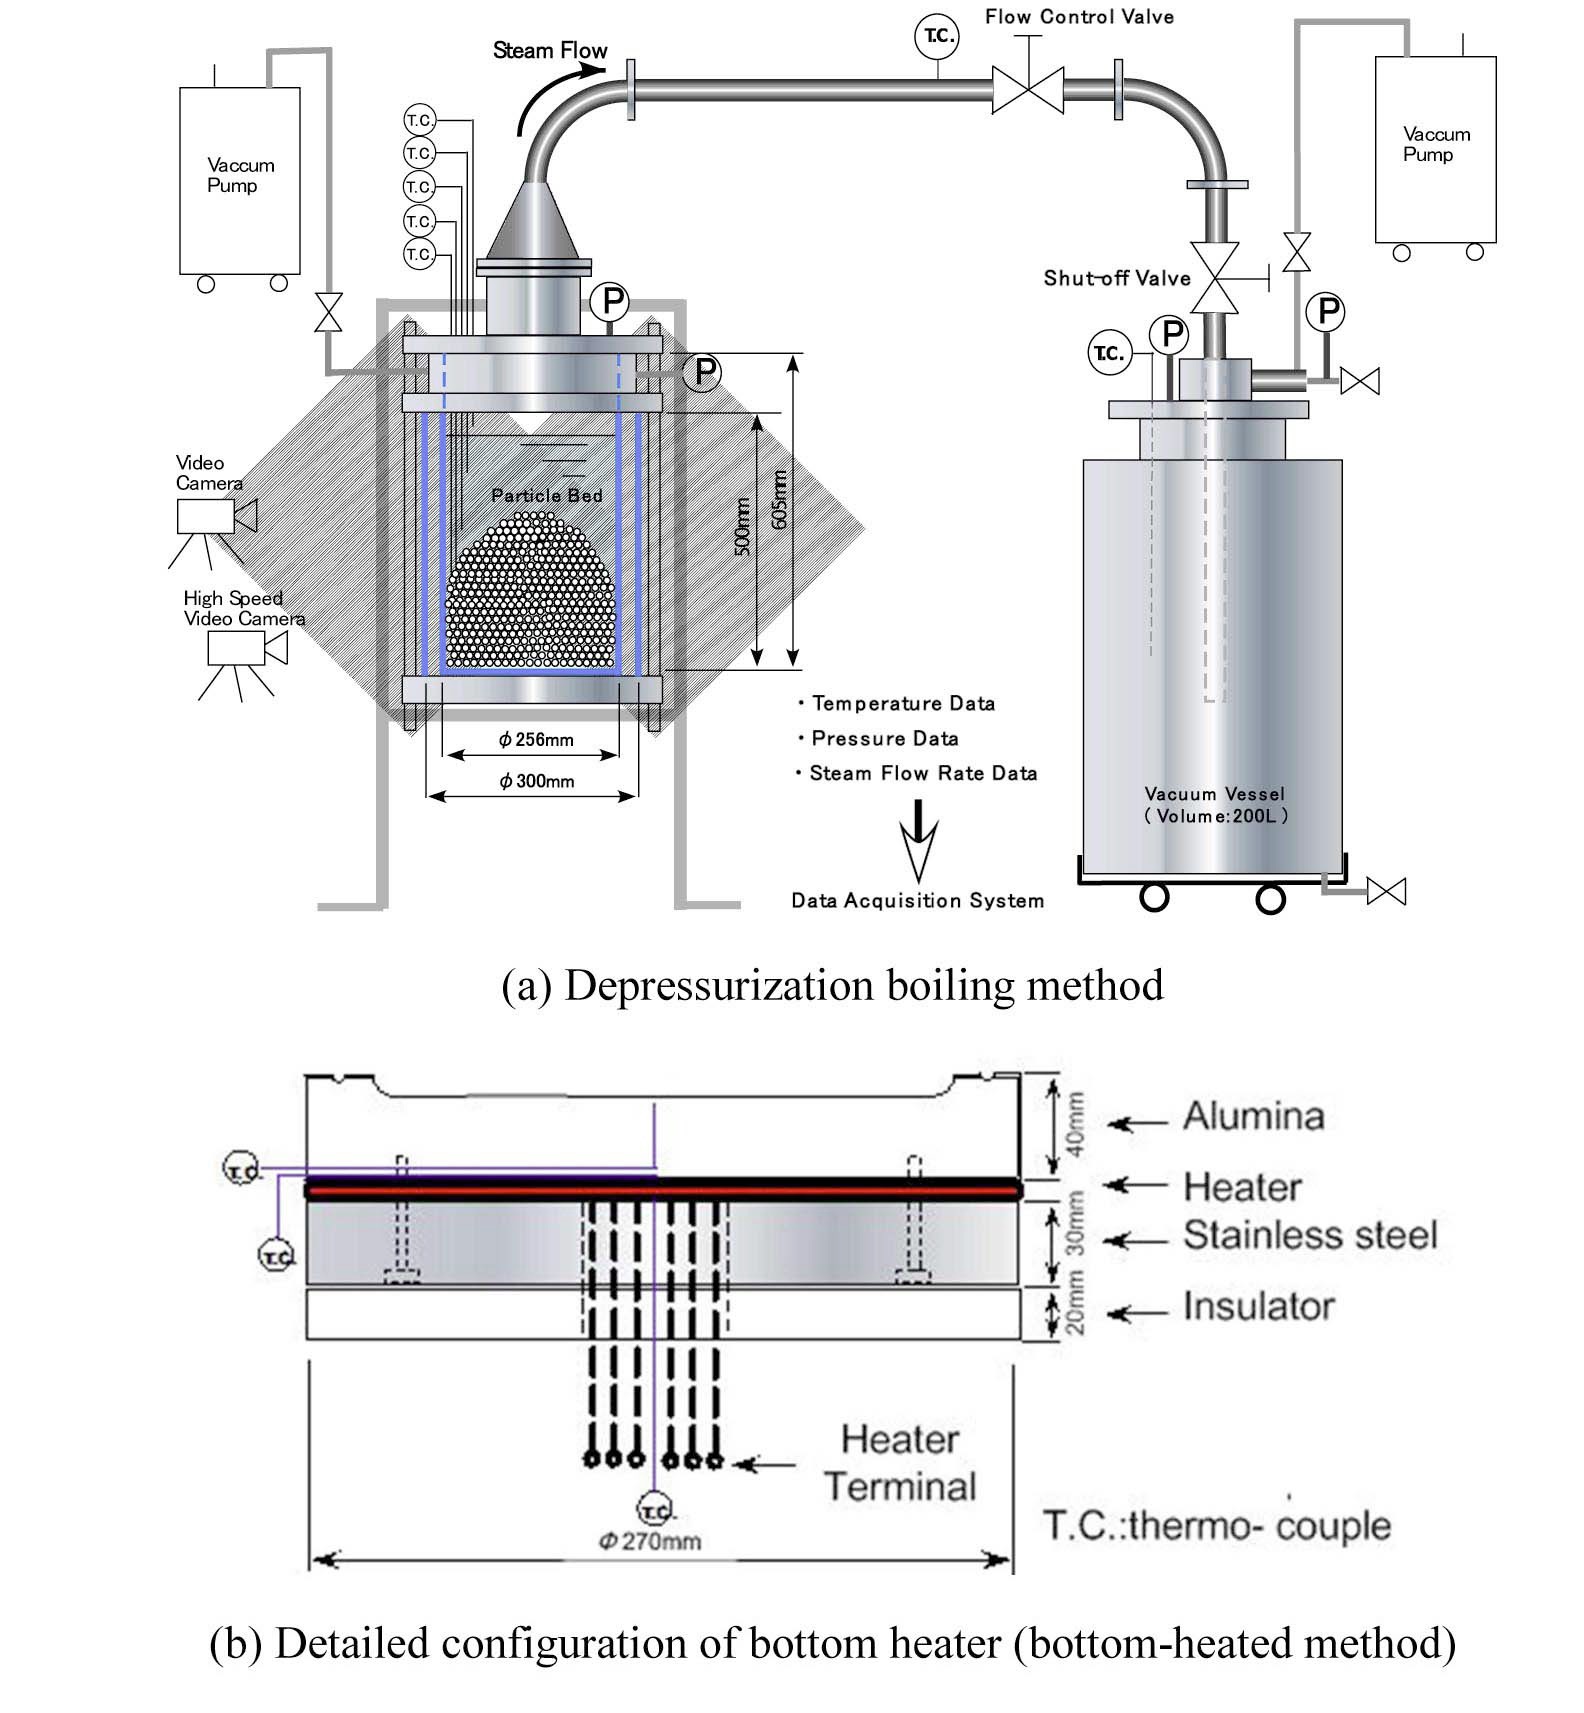
The experimental setup used in the depressurization method is shown schematically in Fig. 5 (a). The particle bed is contained in a double-walled glass cylindrical tank (on the left side, 605 mm in height and 300 mm in diameter) with a vacuum gap to minimize radial heat loss (a connecting vacuum pump maintains a vacuum at all times). An inverted funnel, with the apex connected to a 200 L vacuum vessel via a piping tube, covers the upper portion of the water tank. Before starting an experiment, a vacuum pump evacuates the vessel. Most components used in the bottom-heated method are the same as those in a depressurization setup, aside from the bottom portion of the test tank, which is equipped with a heater, as illustrated in Fig. 5(b). This heater is actually a thin hot plate sandwiched between an aluminum cylinder and a stainless steel cylinder. Power to the heater can be easily regulated via a voltage adjuster.
Compared to boiling methods, a gas phase can be adjusted and controlled more easily using the gas-injection method. Therefore, extensive experimental runs become more viable completion which supports empirical model development and future code verifications. For this reason, two series of leveling experiments, namely the quasi-2D small-scale one and a large-scale one, were performed. Fig. 6 depicts the schematic set-up of the quasi-2D system. With effective dimensions of 500 mm height, 250 mm width and 55 mm gap thickness, a rectangular viewing tank made of glass was utilized to permit visual observation and video-recording. Over the bottom of the viewing tank, an air-stone (30 mm in diameter, 223 mm in height) served
as the gas distributor, ensuring a relatively uniform percolation of nitrogen gas. It is worth pointing out that the quasi- 2D experiment plays a bridging role for all the experiments demonstrated in Fig. 3.
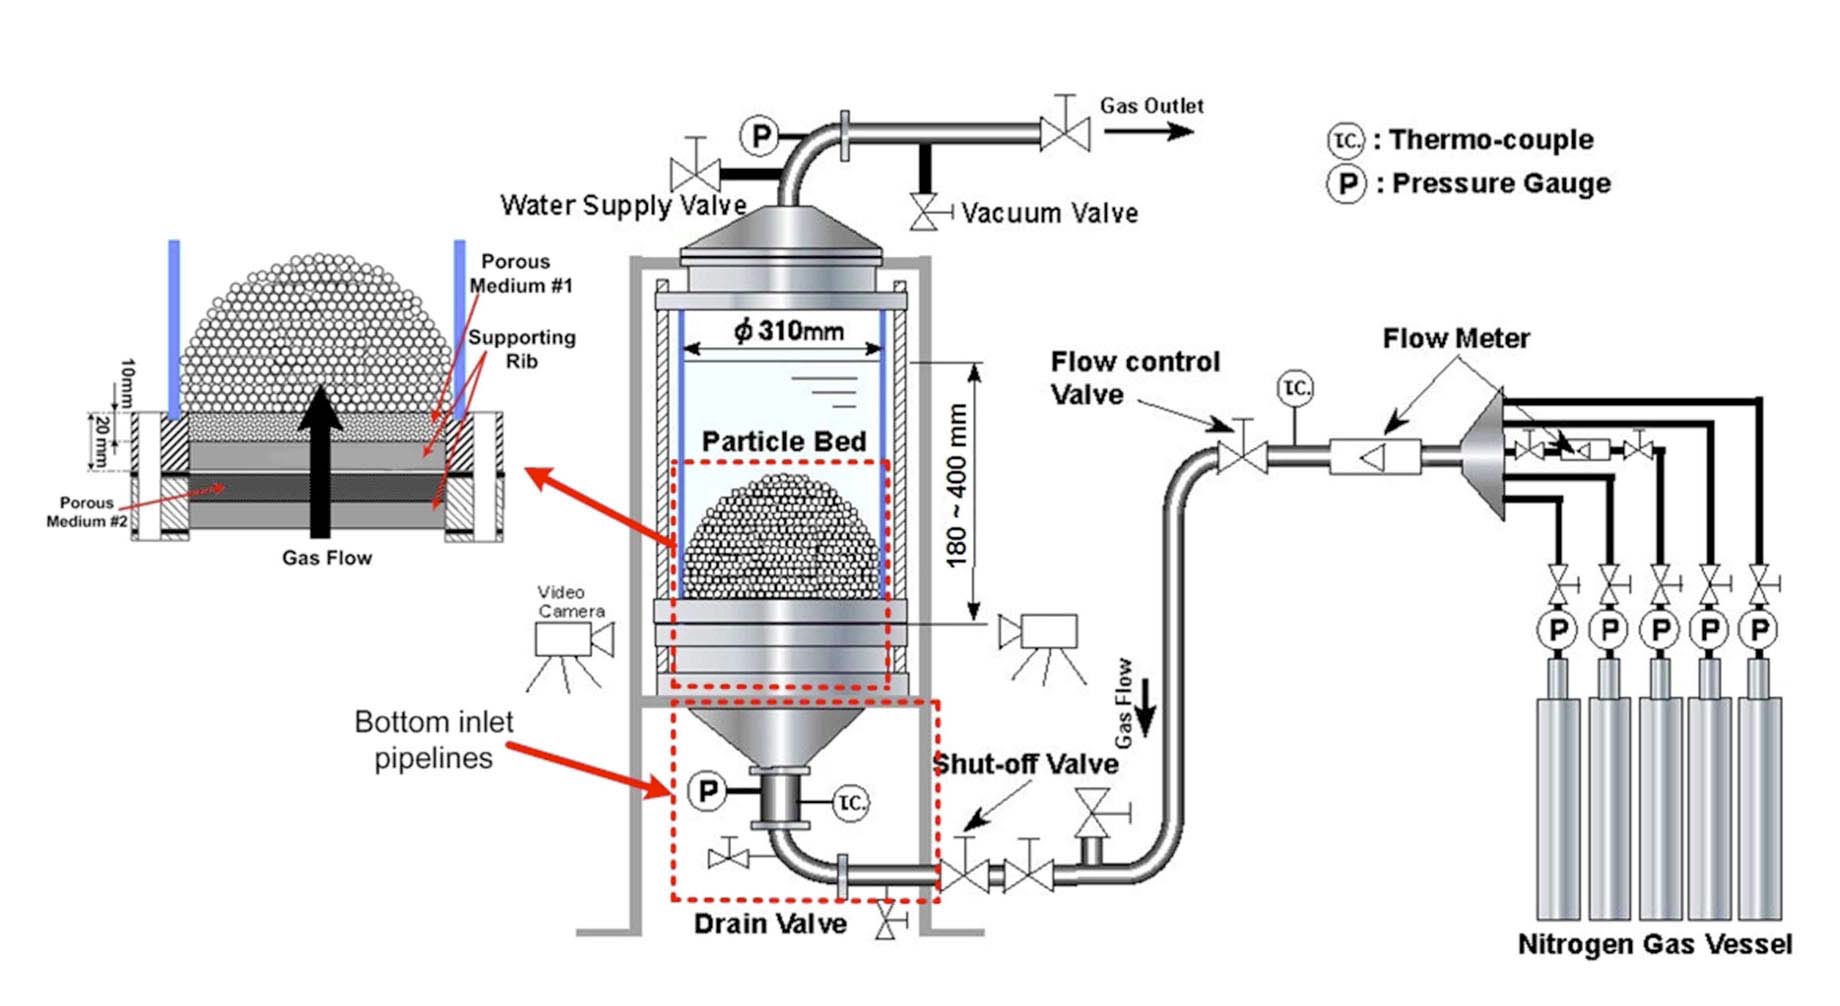
The large-scale experiments, shown in Fig. 7, were specifically performed to reduce the wall effect, as well as to achieve experimentation at much larger gas velocities needed for the future extrapolation of experimental findings
[Table 1.] Conditions of Experiments
Conditions of Experiments
to actual reactor conditions. Similarly, to ensure a comparatively uniform percolation of nitrogen gas, porous media were employed over the bottom of the viewing tank (Sumitomo Electric make). It is validated that with this system, equipped with five nitrogen gas vessels, a driving flow rate up to 10000 L/min (equivalent to boiling intensities of several tens of W/cm3) is theoretically feasible by regulating the gas delivery pressure [18].
To obtain the general characteristics of leveling behavior, various experimental parameters were used. Table 1 summarizes the specific conditions of each experiment.
3.1 Flow Regime Investigations
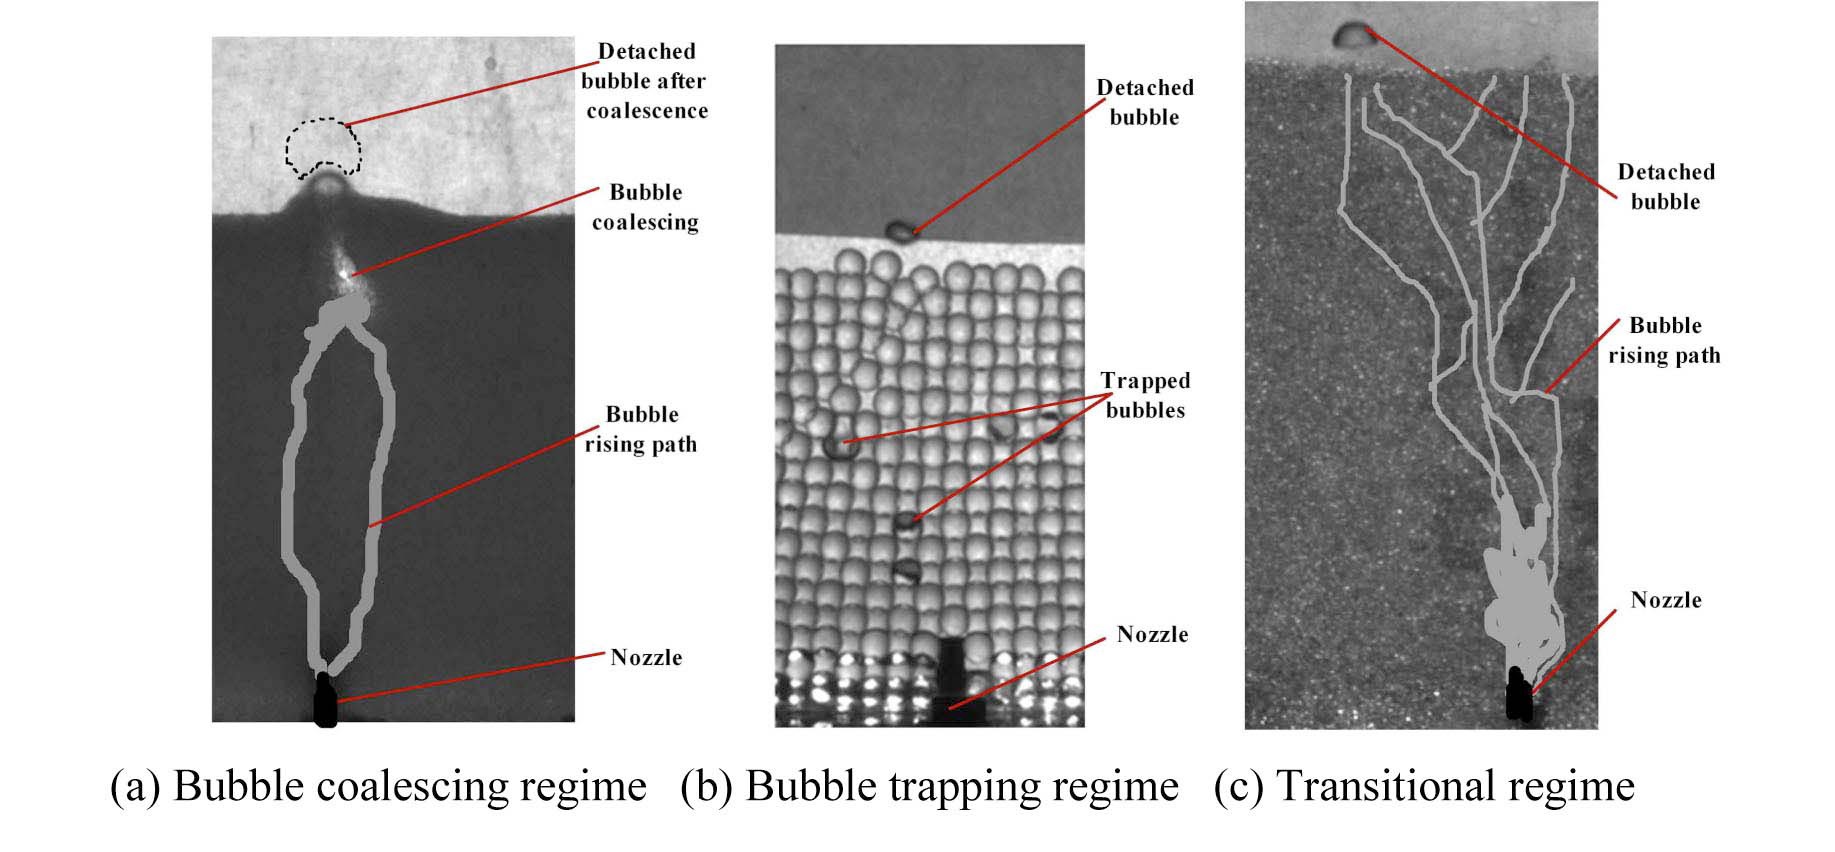
Based on the different interaction mechanisms observed between solid particles and bubbles, three types of bubbling behavior could be identified, as illustrated in Fig. 8 [10,14].
(1) Bubble coalescing regime. This regime could be observed with 0.4 mm ≤ dp < 1.0 mm for glass particles under the single-bubble injection condition. As shown in Fig. 8(a), in this regime continuous bubble paths called coalescence trails are formed. Near the top of the particle bed, some particles become buoyant by the rising bubble due to their lighter weight, which reciprocally delays the rising bubble and causes contiguous trailing bubbles to coalesce. Large trails are thereby formed before detaching from the particle bed.
(2) Bubble trapping regime. This regime exists with 2.0 mm < dp ≤ 6.0 mm for glass particles within the single-bubble injection condition. As shown in Fig. 8(b), while coalescence trails could not be observed in this regime, bubbles can be clearly seen to weave slowly around particles and are quite susceptible to being trapped because of the larger inertial resistance exerted from large heavy particles.
(3) Transitional regime. This regime was observed with 1.0 mm ≤ dp ≤ 2.0 mm for glass particles within the single-bubble injection condition. As shown in Fig. 8(c), particles in this regime seem to be too heavy to be suspended or made buoyant by rising bubbles,
and too light to provide enough resistance to promote bubble trapping. Therefore, bubbles seem to surface more easily from the particle bed, compared to the other two regimes described above. In addition, similar to the bubble coalescing regime, coalescence trails can be observed that are found to be more widely dispersed inside particle beds.
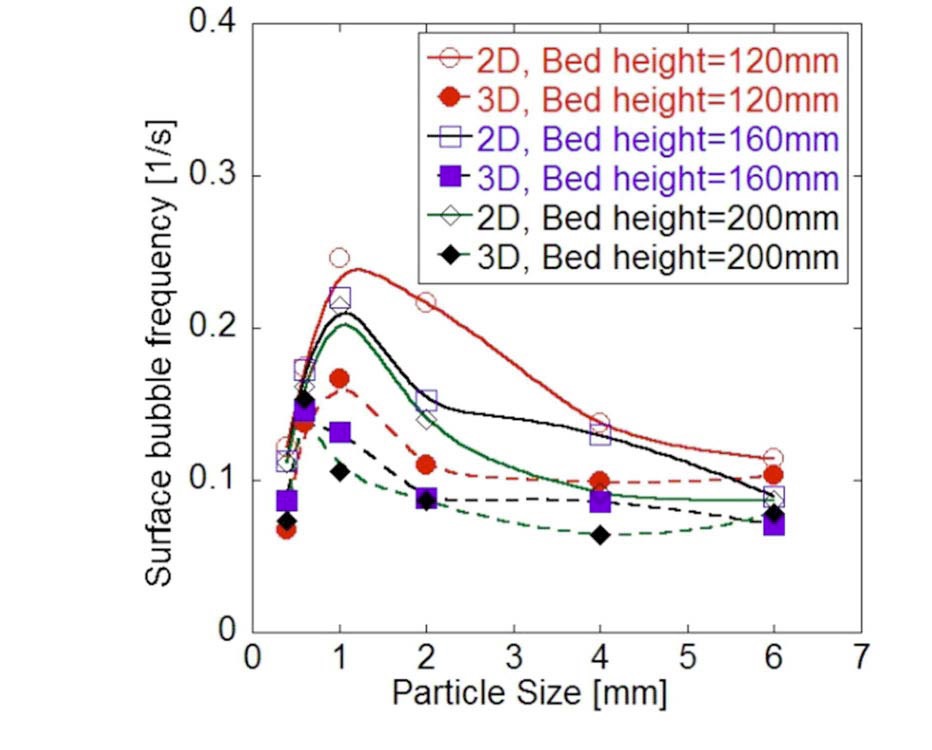
Figure 9 shows the changes of surface bubble frequency with various sizes of glass particles for both 2D and 3D systems using single-bubble injection. It can be seen that whatever the dimension and particle bed height are, the surface bubble frequency, which is defined as the reciprocal of the mean time intervals between the bubbles surfacing from particle beds [14], initially increases when particle size increases until a maximum is attained, and then decreases. This can be explained by the fact that for smaller particles (0.4 mm) particle beds are packed with rather smaller-sized pores and light particles are very easily suspended
by rising bubbles, but that as a result hinders bubble movement. However, as particle sizes increase, particles are heavier and less prone to this buoyancy effects. When particle size exceeds 2 mm, bubble trapping becomes more and more significant due to the increase of particle weight, which consequently makes bubble departure frequency smaller.
Similar tendencies could be found for other types of particles (e.g. alumina) with extremes obtained at different values of particle diameter [14]. This result testifies to the influence of particle density on the regime transition. Moreover, based on the detailed qualitative observation and quantitative analyses, it was further recognized that the multi-bubble injection and bottom-heated boiling experiments generally support the arguments on bubbling behavior inside particle beds, as observed from the singlebubble injection conditions [20]. In addition, the influence of the bubbling rate, namely gas flow rate or boiling intensity, on the regime transition is confirmable as well from these extended experiments. All these suggest that the observed flow regimes should be common characteristics over a wide range of conditions. These findings provide significant arguments for the following analyses of leveling behavior.
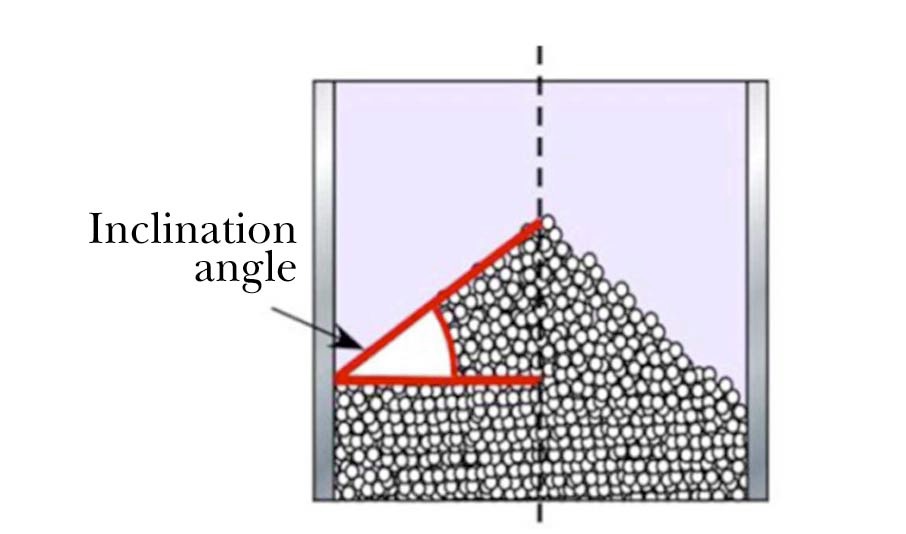
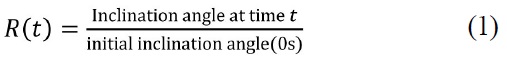
To quantitatively compare the characteristics of the leveling behavior at various parameters, the transient inclination angle of bed mounds was measured. As shown in Fig. 10, the tangent of the inclination angle equals the ratio of the maximum height of the apex to the radius of the viewing tank. Thus, the inclination angle defines the overall average shape of the particle bed rather than its local periphery shape. To quantify the transient behavior associated with the leveling, we further introduce
3.2.1 Effect of Boiling Mode
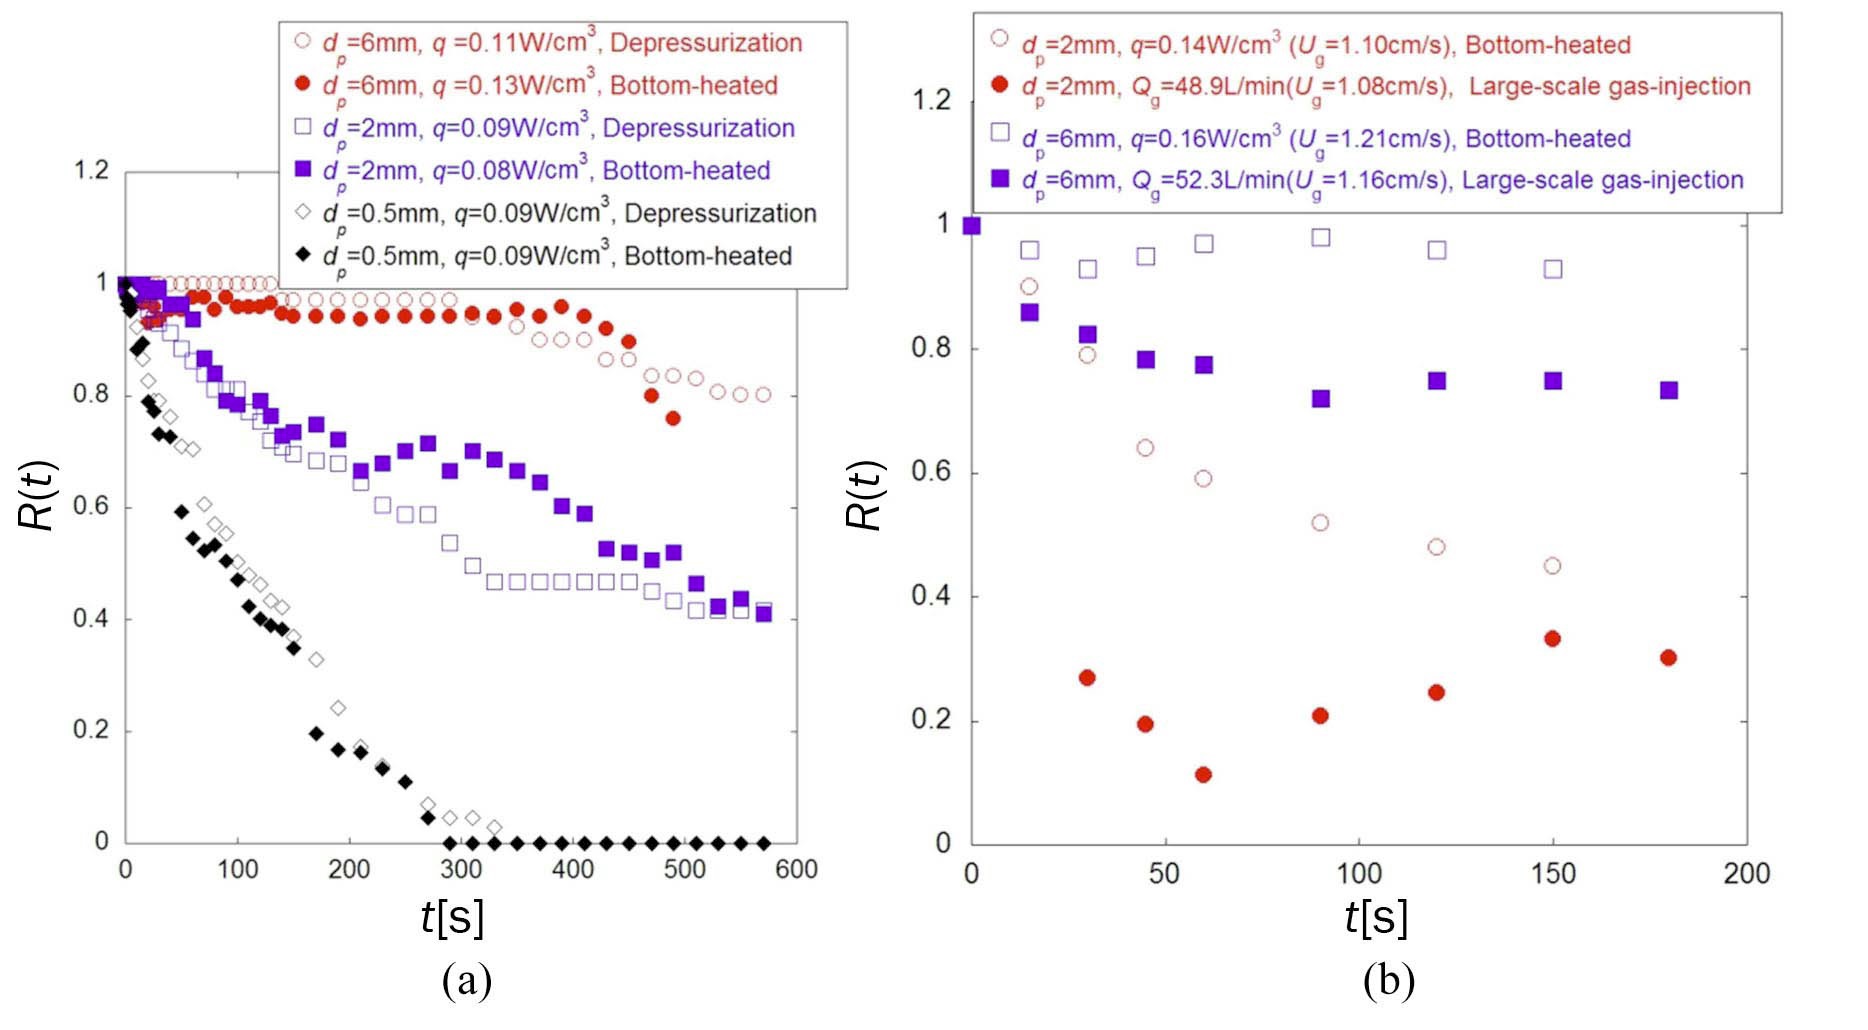
Figure 11(a) summarizes the transient inclination angle profiles of runs conducted by the depressurization and bottom-heated boiling methods for different particle sizes. Generally speaking, good agreements on the self-leveling onset and progression are obtained between comparable runs of the two methods. It seems that the difference in boiling has no notable difference on the leveling behavior, though some microscopic differences do exist. For instance, in the depressurization experimental runs, boiling takes place initially at the apex vicinity of the particle bed, then extends to the periphery [2]. This is reasonable for the depressurization cases, because the pressure head in the apex vicinity is comparatively lower than in other places of the bed. In addition, particles in the bed can provide a sufficiently large nucleation surface needed for depressurization boiling. However, in bottom-heated runs, especially runs with small particle diameters, boiling initially starts at the periphery, then extends to the whole bed. This is mainly because the periphery height of the bed is lower than the apex and closer to the heater. Therefore, the temperature is higher there than in the vicinity of the apex, especially when small particles are used.
Figure 11(b) demonstrates the comparisons of bed inclination angles for several typical runs using bottomheated and gas-injection methods. The comparisons are achieved using an effective gas velocity (
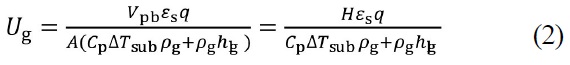
Evidently, from Fig. 11(b) it is seen that whatever the particles are, the self-leveling seems to proceed comparatively faster in the cases using the gas-injection method. This should be primarily due to the difference in the ‘boiling’ or ‘gas-percolation’ patterns of the two systems. Currently, the bottom-heated and depressurization boiling experiments are focused on an early subcooled boiling period [2], in which steam condensation occurs and boiling intensity is not constant, but increases as the water subcooling decreases. On the other hand, in the gas-injection system, the simulated 'boiling' to some extent resembles quasi-steady bulk boiling characteristics more. As a result, a relatively larger intensity of gas flows in the beds under the gas-injection conditions might lead to a much faster development of self-leveling, especially for lighter particles during the initial periods.
3.2.2 Effect of Bubbling Rate
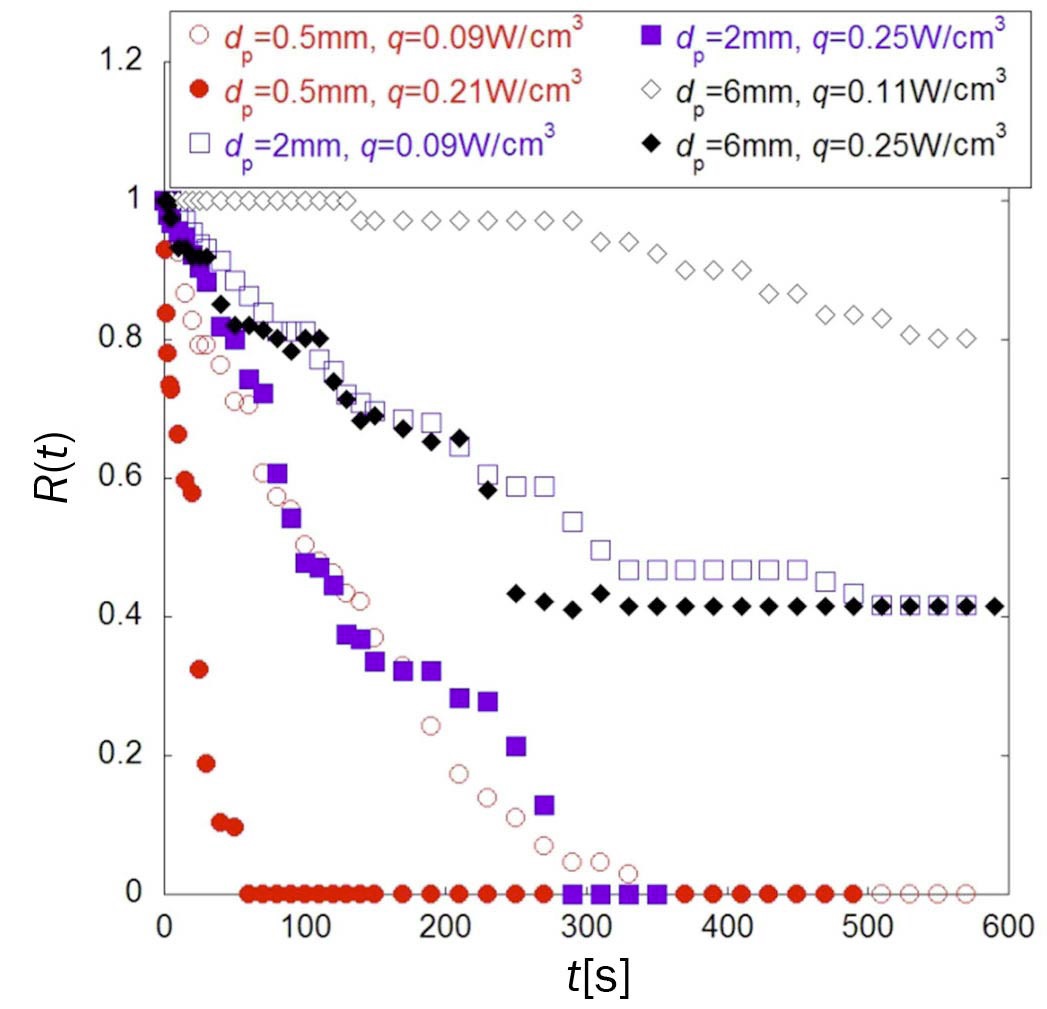
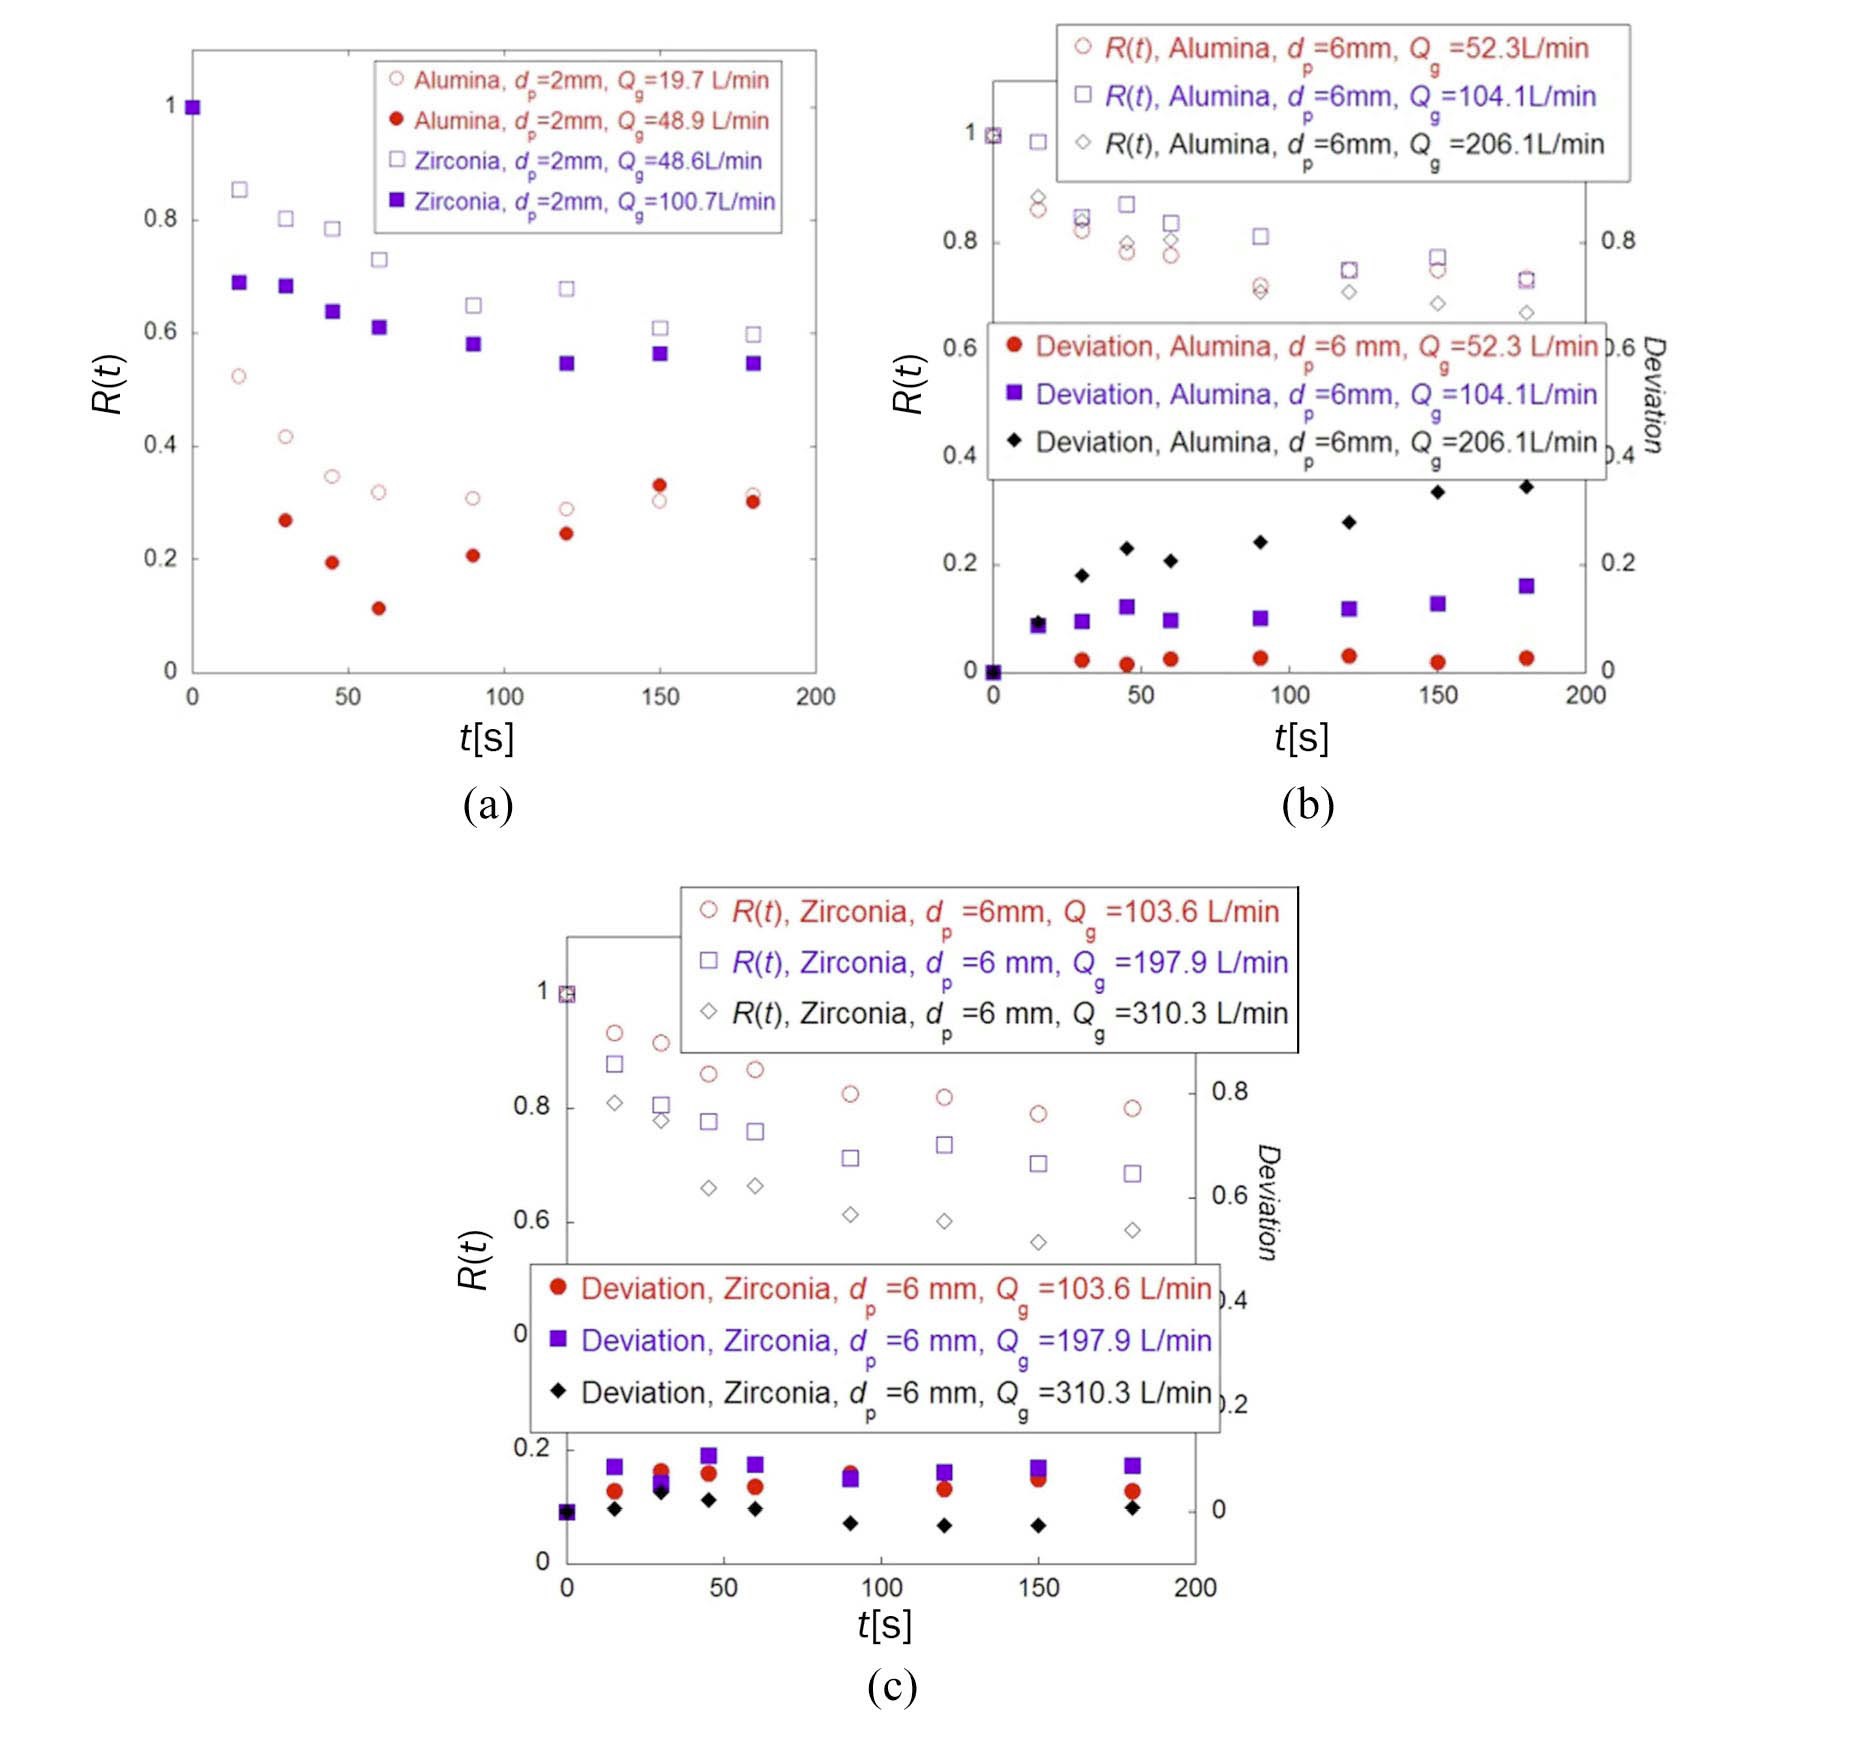
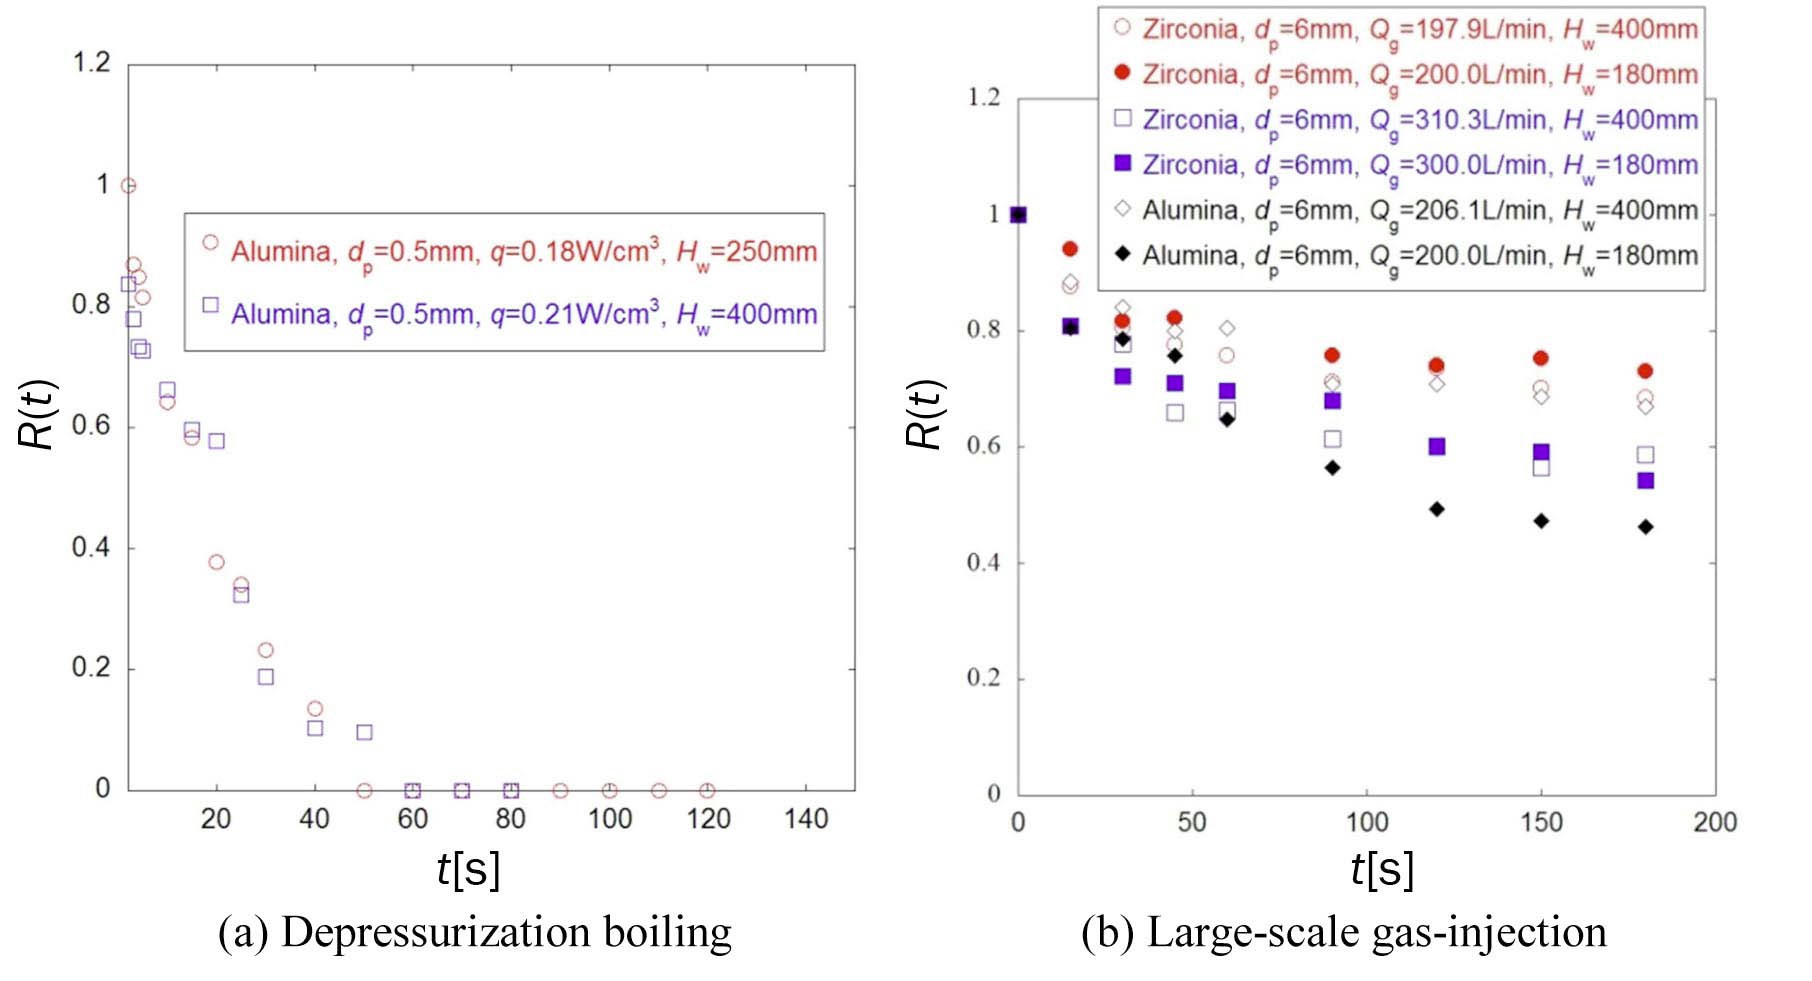
Figures 12 and 13 summarize the transient leveling behavior for the typical experimental runs under both boiling and large-scale gas-injection conditions. Overall,
it seems that with the exception of the cases using 6 mm alumina particles under gas-injection conditions, a higher gas flow rate or boiling intensity seems to facilitate the leveling and result in faster decrease in
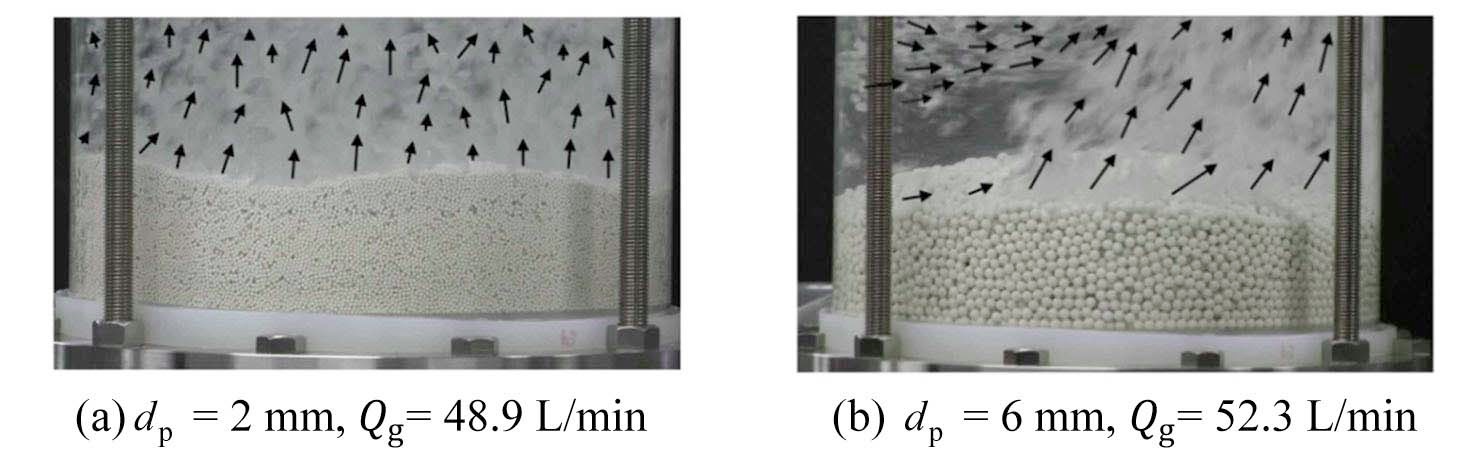
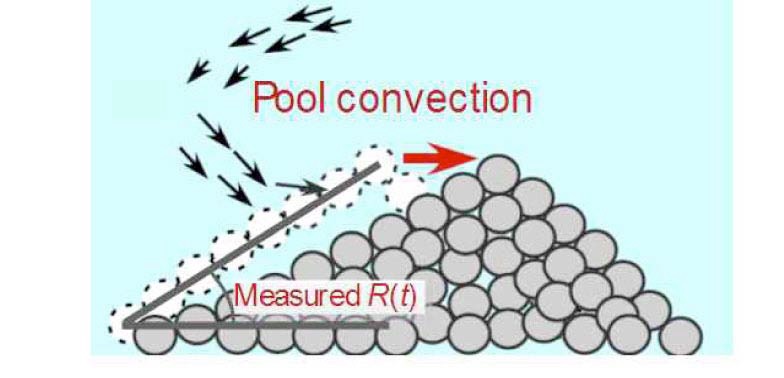
With the increase of the gas flow rate, the difference is not so remarkable for the cases using 6 mm alumina beads within large-scale gas-injection conditions. The reason for this might be due to the relatively violent convection observed in the water pool. Currently, it is observable that for beds composed of smaller-sized beads (e.g. 2 mm) (see Fig. 14(a)), which seems to be less of an obstruction to bubble movements, bubbles are observed to pass through much more easily and more uniformly. For beds packed with larger-sized particles (e.g. 6 mm) (see Fig. 14(b)), however, due to the comparatively greater inertial resistance of a single particle, as well as larger pores formed between particles, bubbles are quite susceptible to becoming obstructed, and are forced to weave around the gaps and finally detach the beds nonuniformly [19]. The uneven distribution of detaching bubbling bundles over the cross-section tends to stir up the water pool and quite likely to cause convections within the pool. The convective flows further move the mound apex to the periphery area, as displayed in Fig. 15, making
However, it should be also noted that for the 6 mm zirconia particles (see the variation of
prominent, which might be a consequence of relatively larger inertial resistance exerted due to a larger density. The less striking effect of liquid convection in the water pool, on the other hand, ensures a pure influence of gas flow rate in comparison to alumina particles (see
3.2.3 Effect of Water Depth
Figure 16 compares experimental runs with different water depths. As shown in Fig. 16(a), for the boiling cases, the water head seems to have less of an impact on selfleveling. Similar findings are generally observable at gasinjection conditions, with the profiles at different water levels almost overlapping (see the Zirconia runs with two representative gas flow rates [around 200 L/min and around 300 L/min] in Fig. 16(b)). However, for the runs in which the impact of liquid convection is much noticeable, such as experimental runs using 6 mm alumina beads, an apparent difference is observable (see Fig. 16 (b)), which should be due to the fact that higher water height promotes the formation of liquid convection, consequently leading to varied inclination angles.
3.2.4 Effect of Particle Size and Density
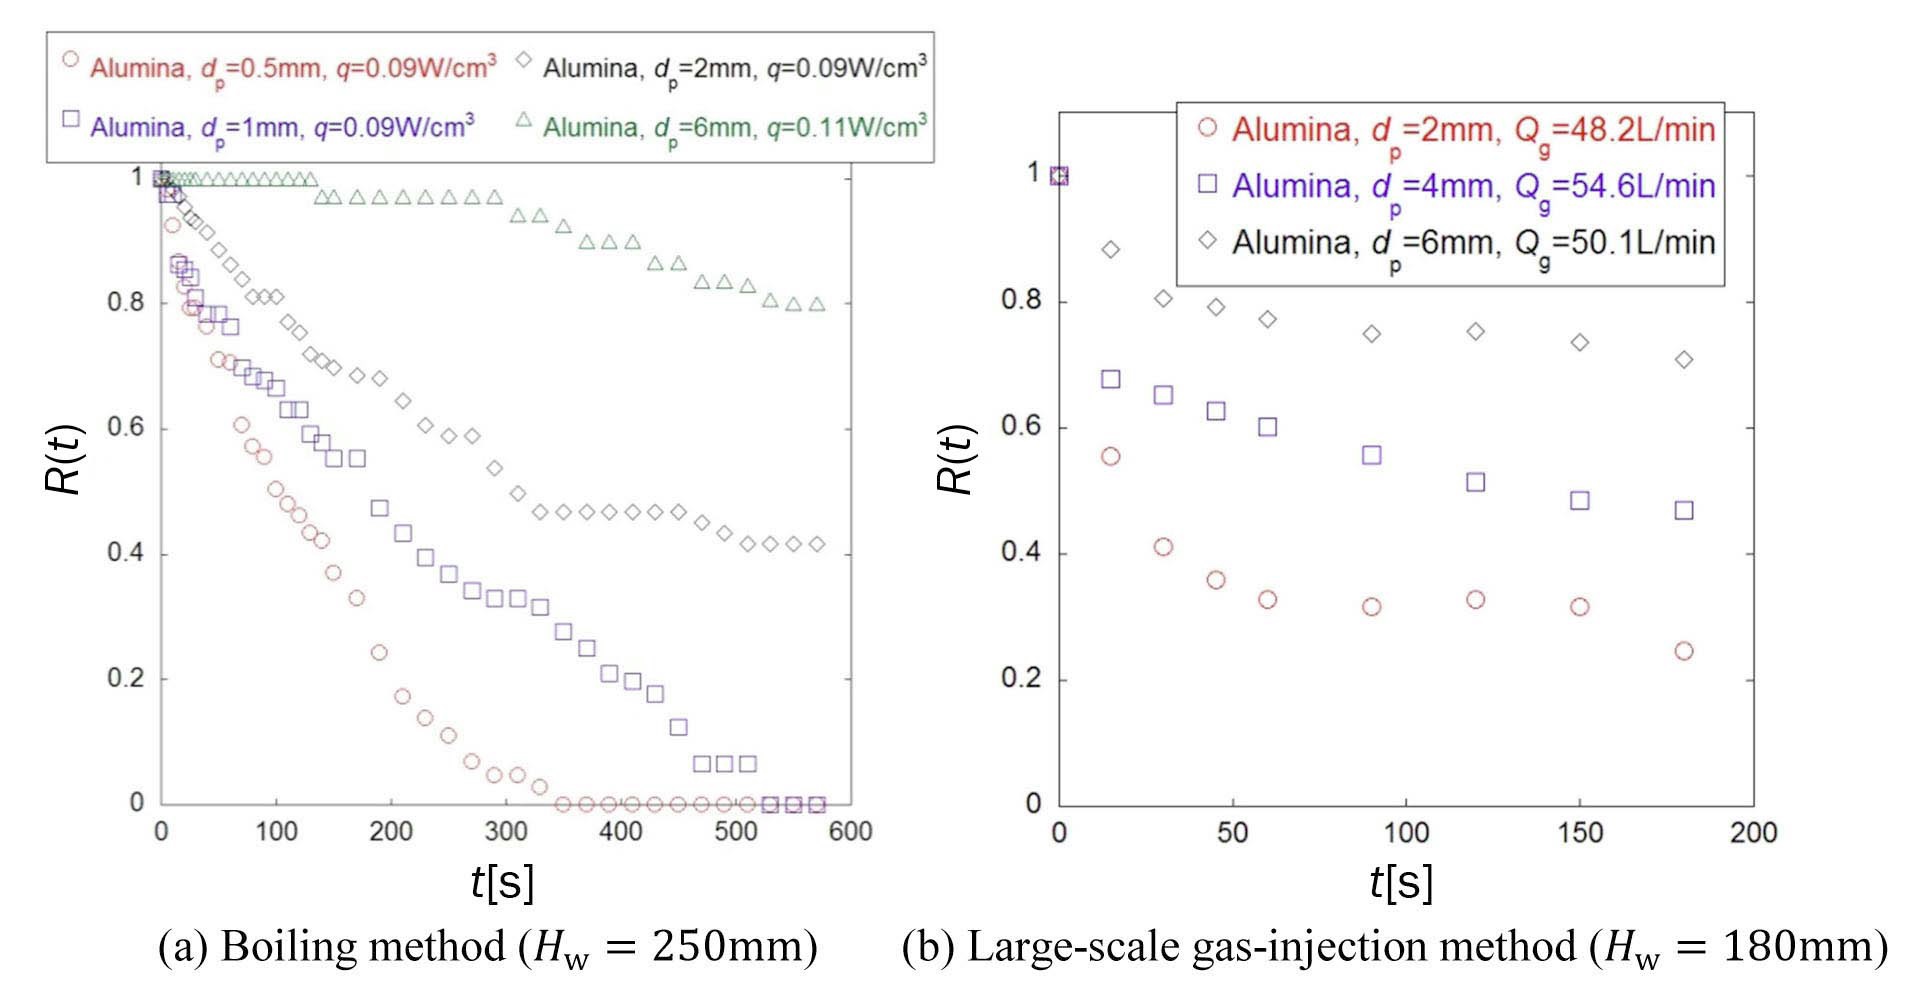
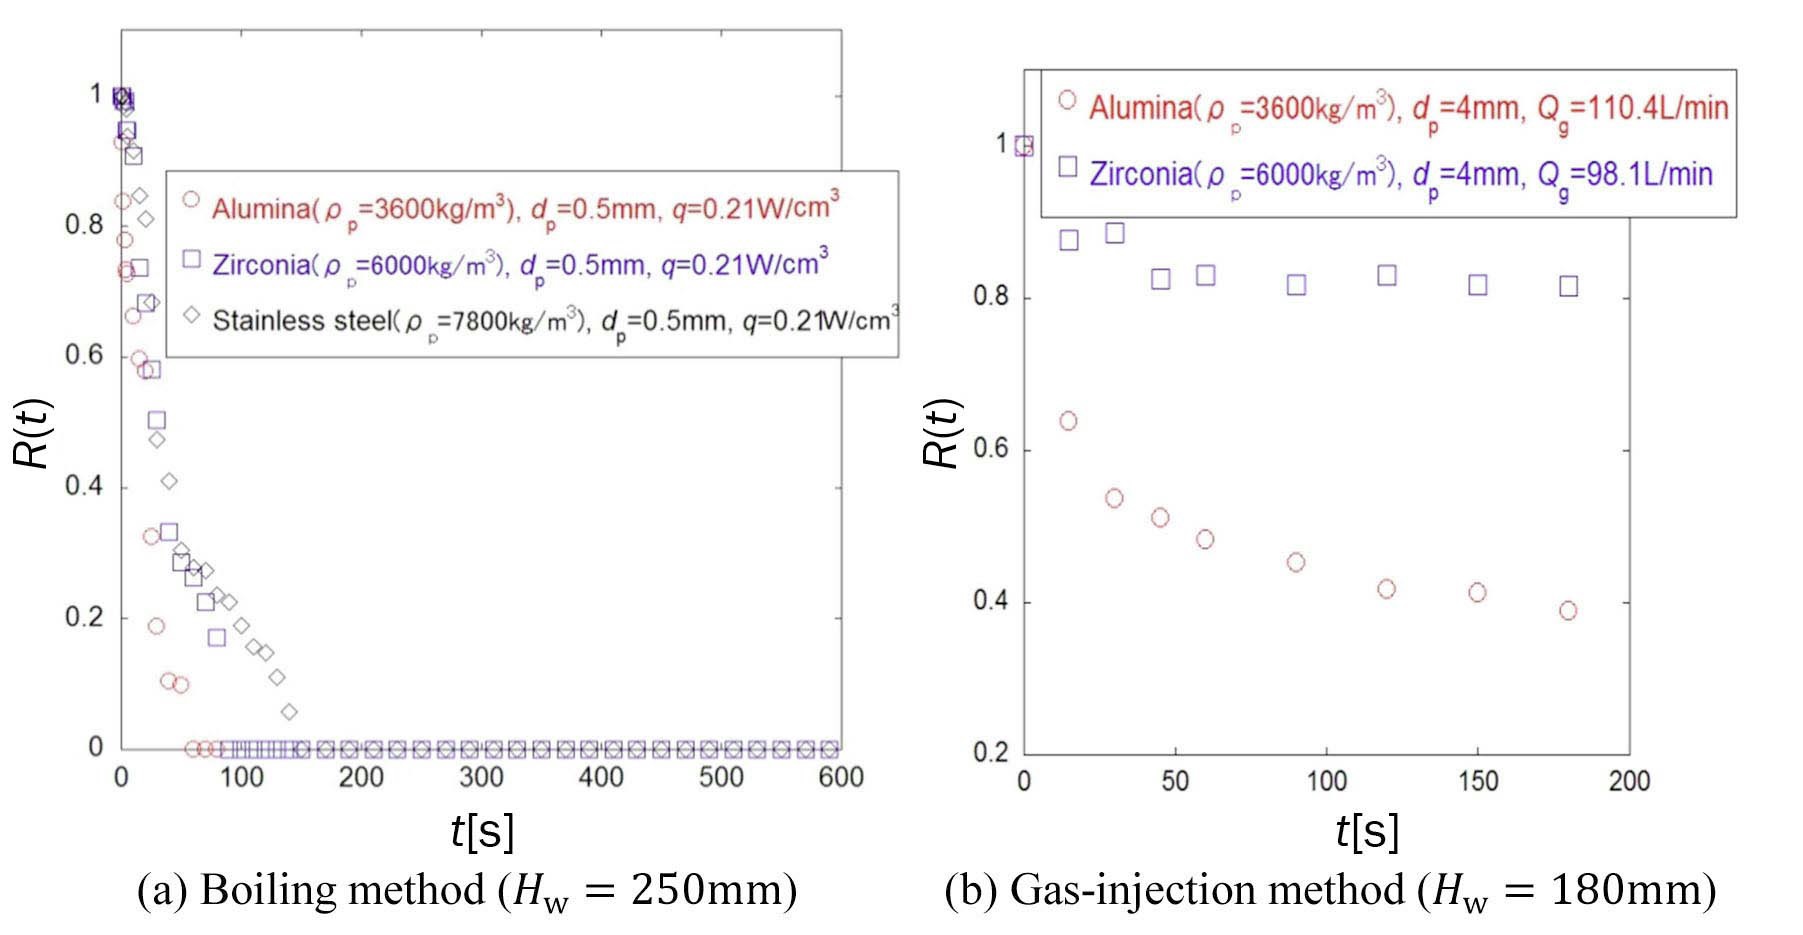
Figures 17 and 18 respectively depict the transient variation of particle beds with particle size and density for several typical runs at both boiling and large-scale gasinjection conditions. It is apparent that a slower decrease in
3.2.5 Effect of Particle Shape
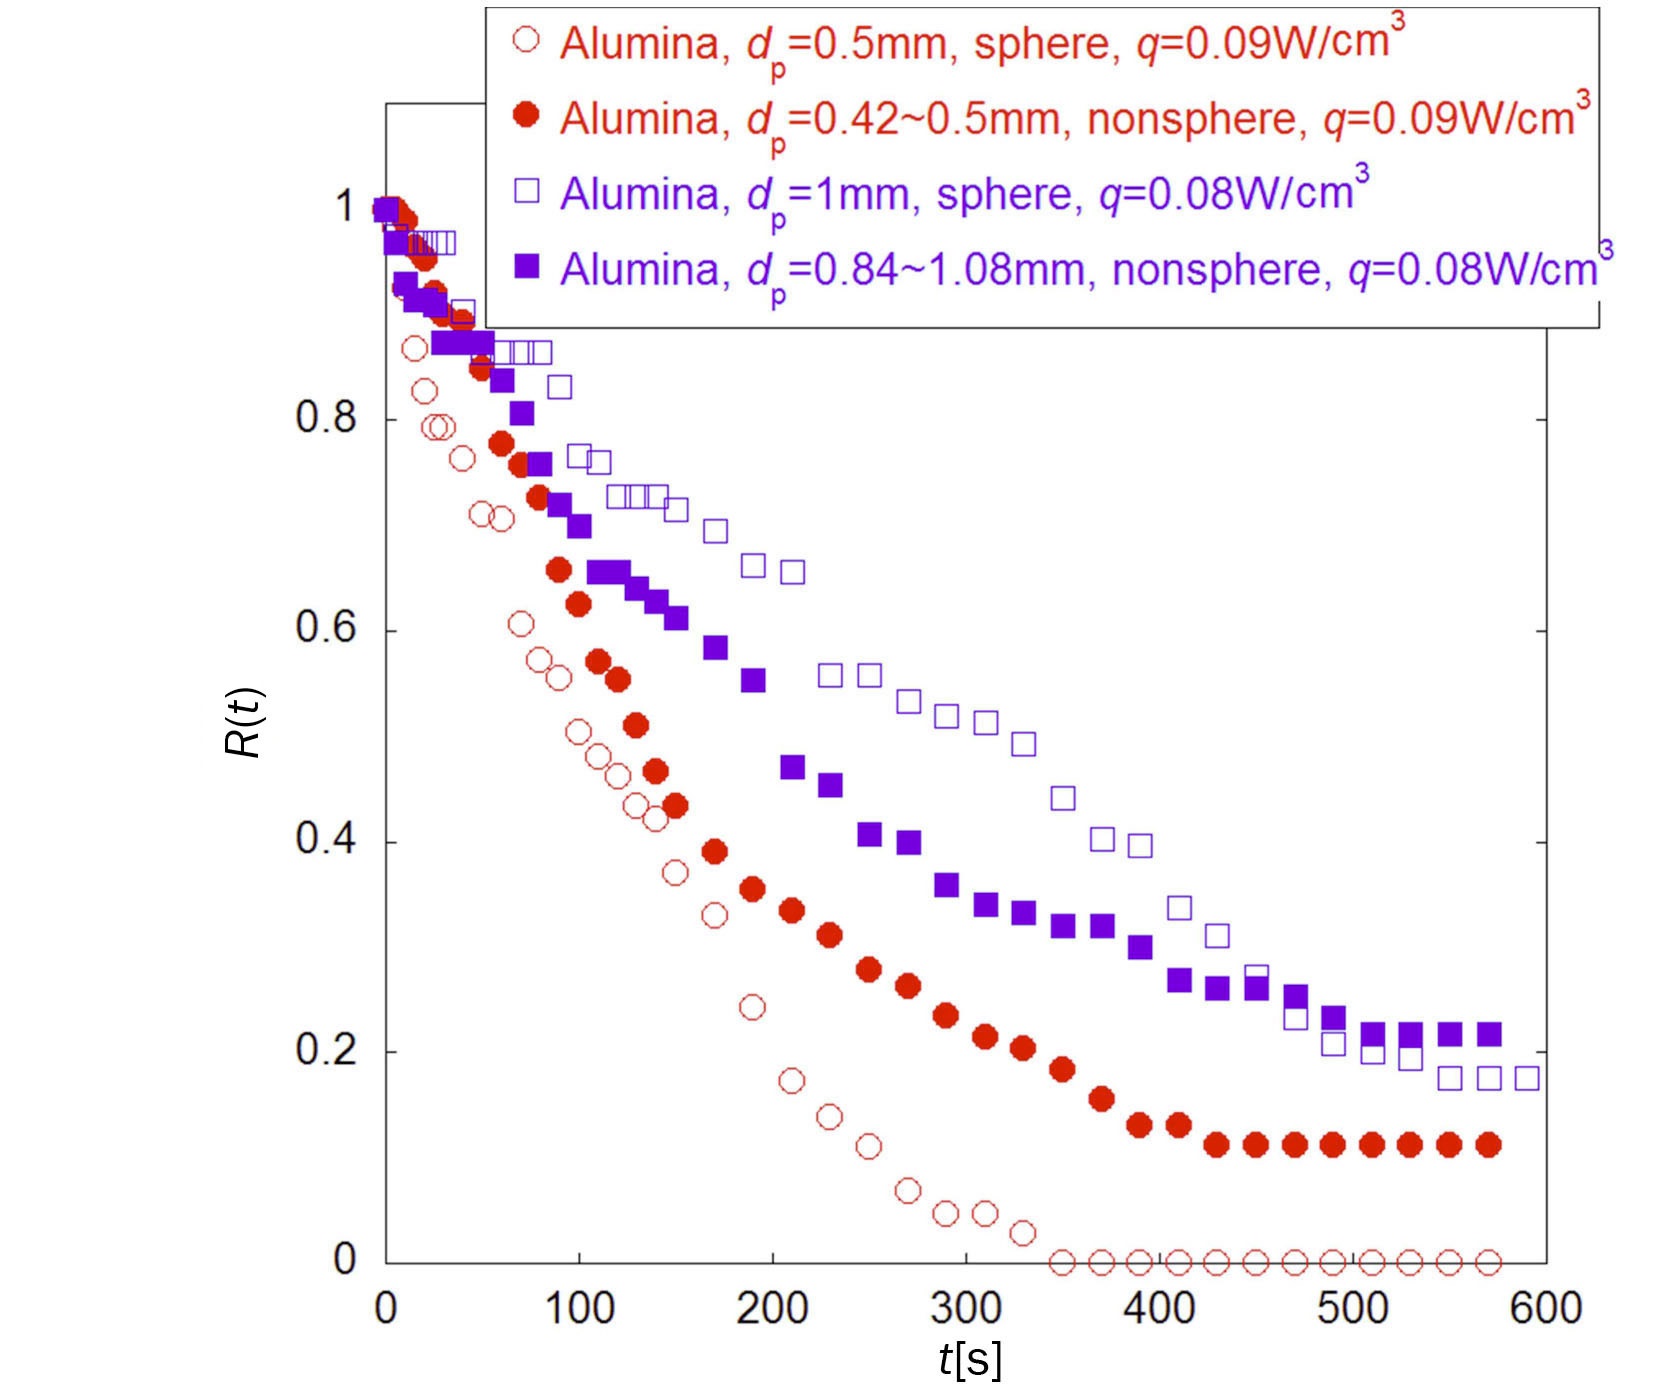
Figure 19 summarizes the effect of particle shape on self-leveling under boiling conditions. It is evident that in the runs with non-spherical particles, self-leveling proceeds more slowly or is less likely to occur. This should be owing to the influence of particle shape on bed packing, as well as additional collisions and frictions caused by shaperelated parameters, such as roughness or eccentricity. For future modeling, these influences should appear.
3.2.6 Effect of Column Geometry
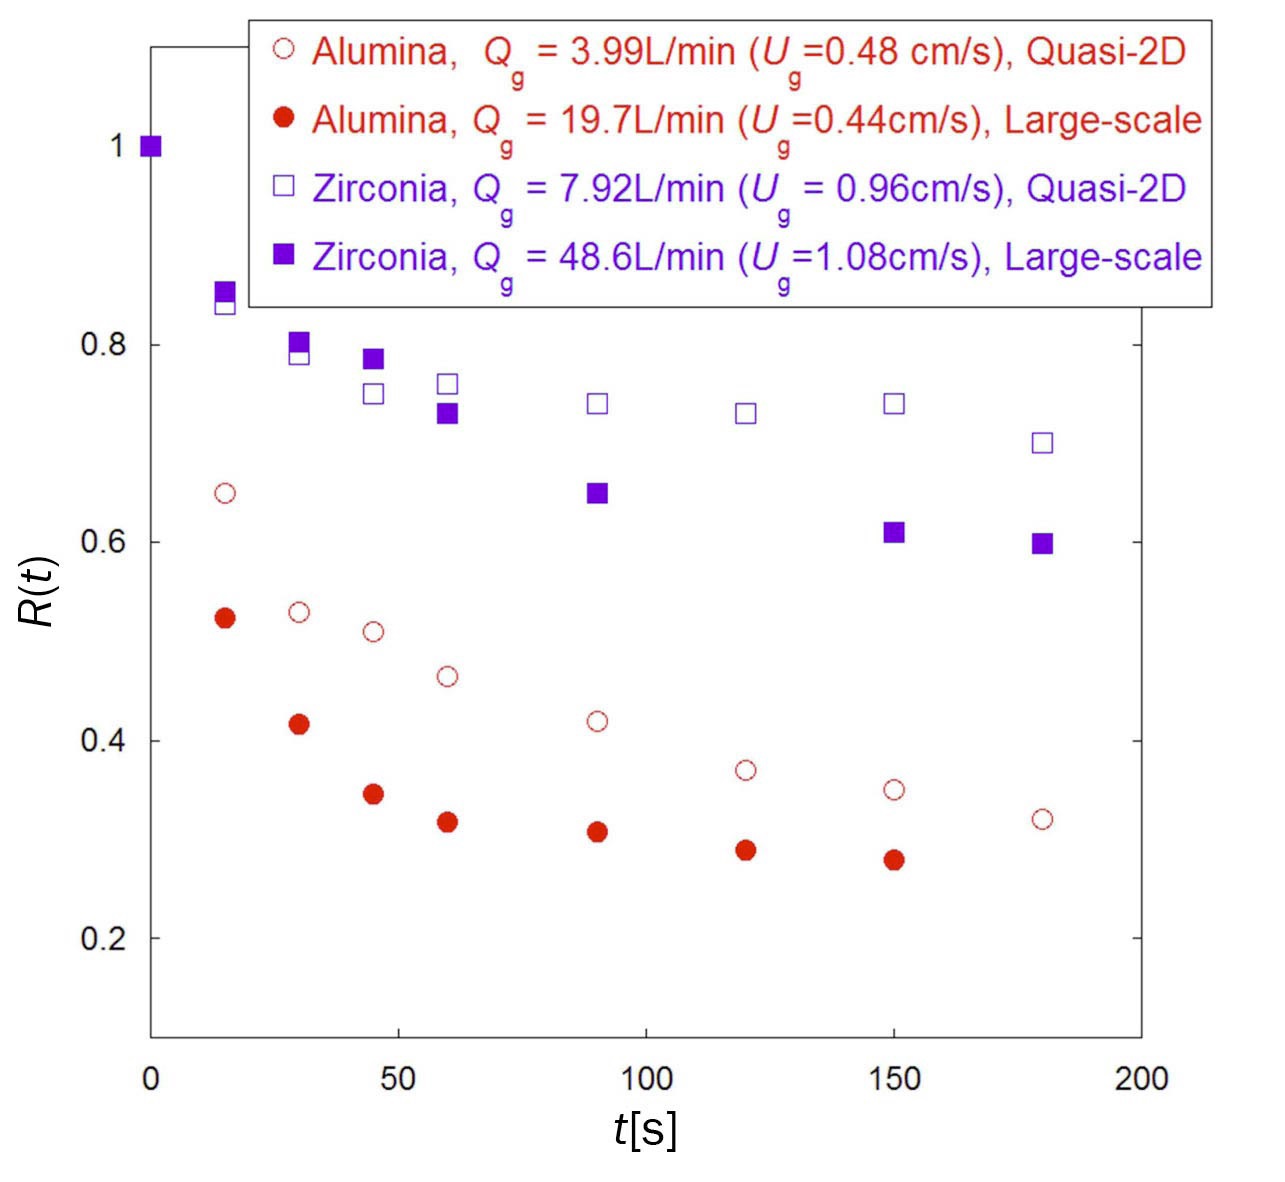
During the development of empirical correlations for the quasi-2D gas-injection experiments [16], it was believed that the column geometry or wall effect might be one of the principal contributors to the variation of empirical constants. Figure 20 shows the time variation of several typical cases under different column geometries. Overall, it seems that the larger the column dimension is, the faster the self-leveling proceeds. Therefore, the influence of the wall effect is confirmable.
Debris bed self-leveling behavior is of essential importance to the heat removal capability for fast reactors during CDAs. To clarify the mechanisms underlying this phenomenon, several series of experiments were performed in recent years under the constructive collaboration between JAEA and Kyushu University.
From the flow regime investigations, it was verified that due to the different interaction mechanisms observed between solid particles and rising bubbles, different regimes of bubbling behaviors were identified. Those bubbling behaviors are general characteristics over a wide range of bubbling conditions. Moreover, it was also validated that the particle size, particle density and bubbling rate do have influence on the regime transition. These findings provide significant evidence for the understanding of leveling experiments.
From the macroscopic leveling experiments, it was found that though the self-leveling proceeds in a similar manner under the bottom-heated and depressurization boiling modes, much of the difference is observable for experimental runs under the boiling and gas-injection conditions. Particle size, particle density, particle shape, bubbling rate, and column geometry were recognized to have a noticeable influence on the leveling development. In addition, due to the liquid convection in the water pool, the influence of water depth, which is not so remarkable within performed subcooled boiling experiments, was observed to be crucial in the large-scale gas-injection experiments, particularly for those runs performed using larger-size, lower-density particles at higher gas flow rates.
A Cross-section area [mm2]
Cp Specific heat capacity of the vapor [J/(kg K)]
dp Particle diameter [mm]
H Bed height [mm]
Hw Water height [mm]
hlg Vaporization heat of the coolant [J/kg]
Qg Gas flow rate [L/min]
q Power density of debris bed [W/cm3]
R(t) Ratio of inclination angle at time t to the initial angle (0 s) [-]
t Time [s]
ΔTsub Sub-cooled degree [K]
Ug Gas velocity based on cross-section of particle bed [cm/s]
Vpb Volume of particle bed [mm3]
Greek Letters
εs Solid holdup [%]
ρp Particle density [kg/m3]
ρg Vapor density [kg/m3]