The Advanced Power Reactor 1400 (APR1400), with electrical power of 1400 MWe, is a new pressurized light water reactor developed by the Korea Hydro & Nuclear Power Company (KHNP). KHNP is now constructing six APR1400 units in Korea (four reactors) and in the UAE (two reactors).
The General Design Criterion (GDC) 1, “Quality Standards and Records,” as set forth in Appendix A, “General Design Criteria for Nuclear Power Plants,” for Title 10, Part 50, of the Code of Federal Regulations (10 CFR Part 50), “Domestic Licensing of Production and Utilization Facilities,” requires that nuclear power plant structures, systems, and components important to safety are designed, fabricated, erected, and tested to quality standards commensurate with the importance of the safety functions to be performed. The US Nuclear Regulatory Commission (US NRC), Regulatory Guide 1.20, Revision 3 provides a means of satisfying this GDC by presenting a comprehensive vibration assessment program (CVAP) that the staff finds acceptable for use in verifying the structural integrity of reactor vessel internals (RVI) for flow-induced vibrations [1].
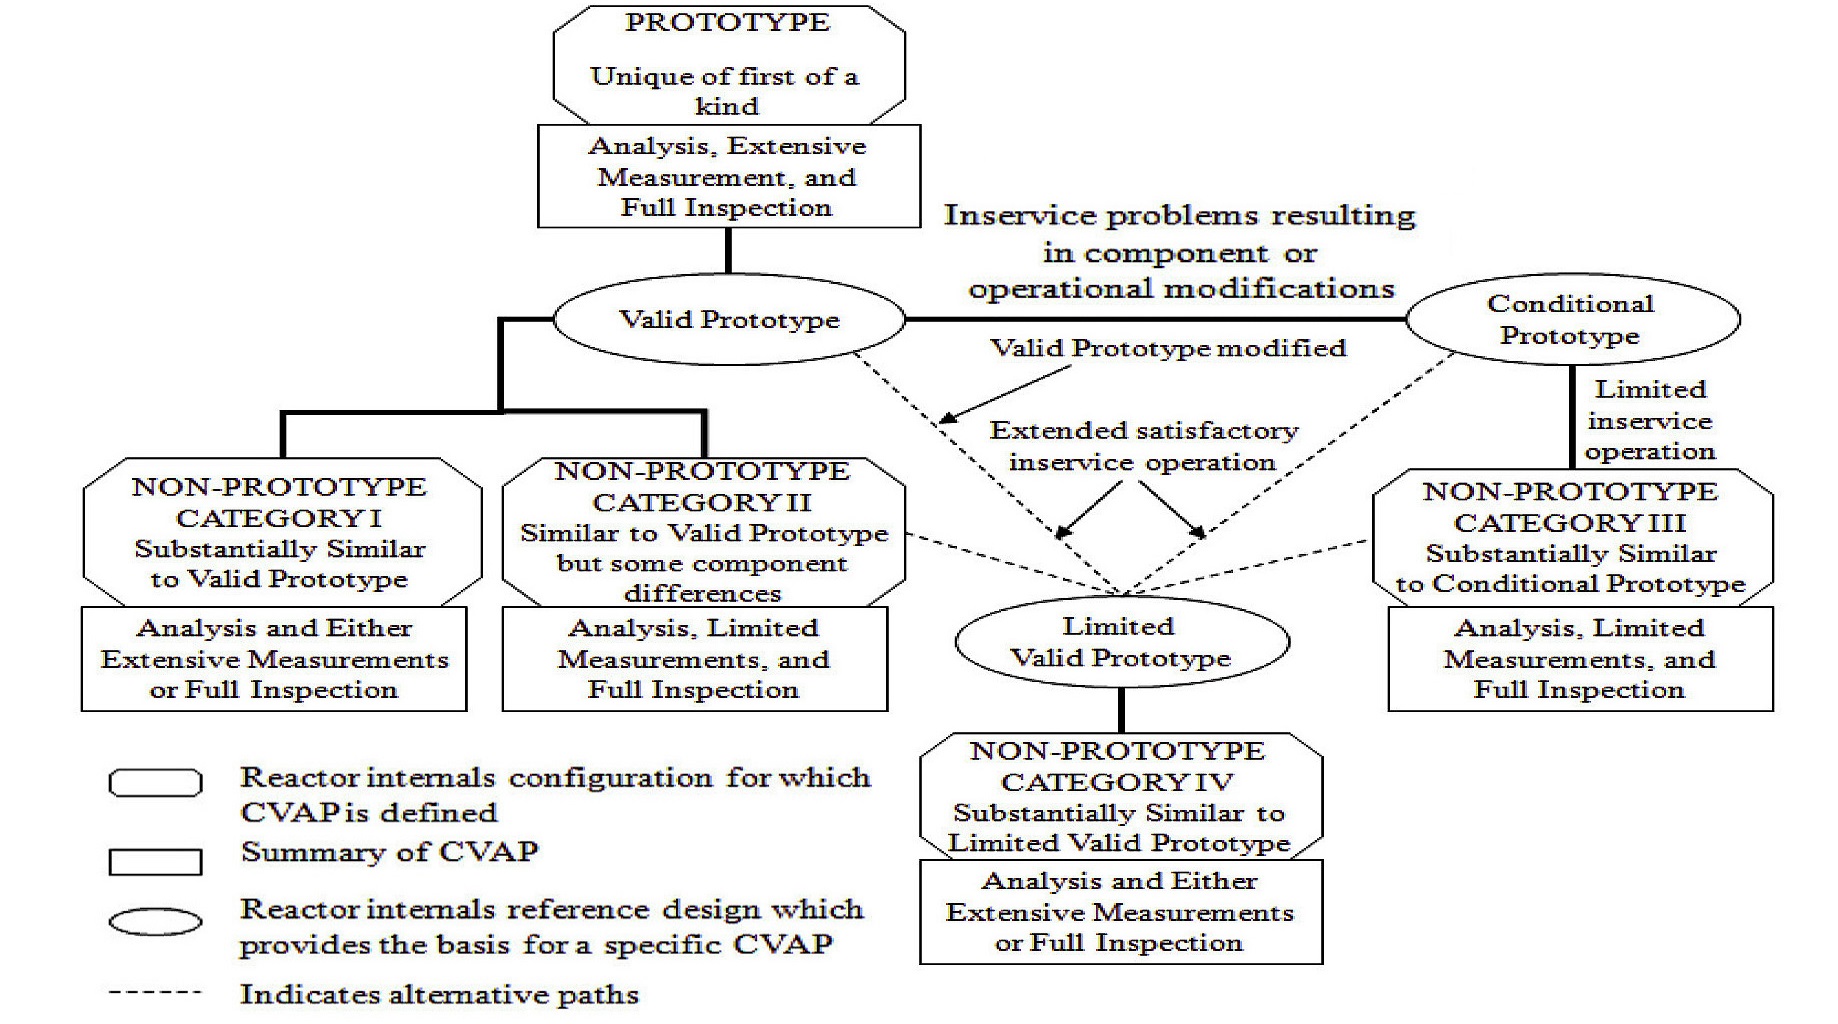
The CVAP consists of a vibration and stress analysis program, a vibration and stress measurement program, an inspection program and an assessment program. It is categorized according to the design, operating parameters, and operating experience with potential prototypes. The CVAP outlined in the US NRC Regulatory Guide 1.20 is summarized in Fig. 1.
The prototype of the APR1400 design is the Palo Verde nuclear power plant, unit 1. To validate the APR1400 design as a utility independent of a construction permit and an operating license, the Non-Prototype Category Ⅱ, shown in Fig. 1, serves as the APR1400 RVI CVAP. The completion of the analytical program supplied the vibration and stress measuring transducer types, the measurement locations, and the test acceptance criteria [2-9].
The vibration and stress measurement program of the RVI CVAP should be implemented in conjunction with the preoperational and startup testing processes. Therefore, a measurement system has to be designed and manufactured to confirm the analysis results and determine the safety margin of the RVI prior to the measurement of the first APR1400 CVAP.
To design the vibration and stress measurement system for the APR1400 RVI CVAP, we investigated the APR1400 design data [10-16], analysis results [3,5-10], and materials of other plants prior to the initiation of the CVAP [17,18]. Also, for the core part of the measurement system, the
transducer that will be installed inside the reactor, performance tests were carried out in a harsh environment to guarantee an impeccable measurement program for the CVAP.
In this paper, we successfully designed a measurement system that can be used with the first construction project of the APR1400 in Korea.
2. SELECTION OF MEASURING INSTURMENTS AND MEASUREMENT PURPOSES
2.1 Measurement Environments of the CVAP and Test Conditions
The RVI CVAP in this paper is essentially an integrity test of an actual nuclear power plant during the preoperational and the initial startup testing process. In particular, the measurement program could not be conducted again, because it includes a critical path, a hot functional test (HFT), for the construction of a nuclear power plant. It is important to make all necessary preparations, from the selection and testing of suitable measuring instruments to the design of a measurement system, because the measurement can only be done one time [2,10].
First, we investigated the thermal-hydraulic design of the reactor internals for the measurement environments of the APR1400 RVI CVAP. The reactor vessel (RV) operating pressure is 158.2 kgf/cm2 (2250 psi) and the operating temperature is 291.3 ℃ (556.3 ºF).
The hydraulic forcing functions in the reactor are assumed to have two types of hydraulic loads. The first type is the deterministic loads that are caused by the propagation of the pump-induced periodic variations in pressure through the reactor, and the second is the random excitation that is assumed to have a constant amplitude-versusfrequency value, due to the turbulence induced by flow in the reactor.
The pump pulsations are generated at multiples of the reactor coolant pump rotational speed (1200 rpm / 20 Hz) and the reactor coolant pump-blade-passing frequency (120 Hz). The frequency response of the measuring instruments has to measure a minimum of 480 Hz, as many as four times at 120 Hz [5-10,17,18].
To derive the lead wire lengths of the measuring instruments, the structural design of the RVI was investigated. The length of the lead wire to overcome the harsh environment of a reactor must be a minimum of 20 m [2].
The measuring instruments used with the APR1400 RVI CVAP have to satisfy the following requirements, based on the APR1400 reactor design materials and the measuring cases of the CVAP values of other nuclear power plants.
First, the transducers have to endure the RV operating temperature of 291.3 ℃ and the operating pressure of 158.2 kgf/cm2, as well as the thermal-hydraulic environment created by the reactor coolant pumps. Second, the transducers have to be installed in the reactor, and all other electric devices (signal filters, amplifiers and converters, a data acquisition system (DAS), a computer, and the monitoring equipment) have to be outside of the reactor. Third, the lead wire in the reactor must consist of a hard cable (e.g., a mineral-insulated cable) due to the high pressure, the high temperature and the thermal hydraulic environment. Fourth, the sensitivity of the sensor is very important, as the structural responses by the flow-excited acoustic resonances and potential adverse flow effects can have very small values. Therefore, it is necessary to review the sensitivity at the CVAP in the past. In this paper, the sensitivities of the transducers have the same values used in the RVI CVAP for the Yonggwang nuclear power plant, unit 4 [2,18]. Fifth, the frequency response of the instruments has to be considered in parallel with the natural frequency of the reactor internals and the deterministic forcing frequency [2,5-9]. Sixth, any defective fraction must be confirmed. The measurement can only be done one time, because the measurement program will be conducted during the HFT, which is the critical path for the construction of a nuclear power plant. We noticed that some instruments failed to function in other measurement cases for a CVAP from other countries [17]. Unfortunately, the mean time between failures (MTBF), the mean time to failure (MTTF), the criterion of the expected life span, and codes and guidelines generally do not exist. We ensured against these risks by considering successfully measuring sensors in the past [2,17,18]. Seventh, the hard cable inside the reactor and the soft cable outside the reactor require minimum distances of 20 m and 30 m, respectively, when the structure of the reactor internals and the extreme environments in the reactor are considered.
Table 1 shows the requirements of a sensor for the APR1400 RVI CVAP, as presented above.
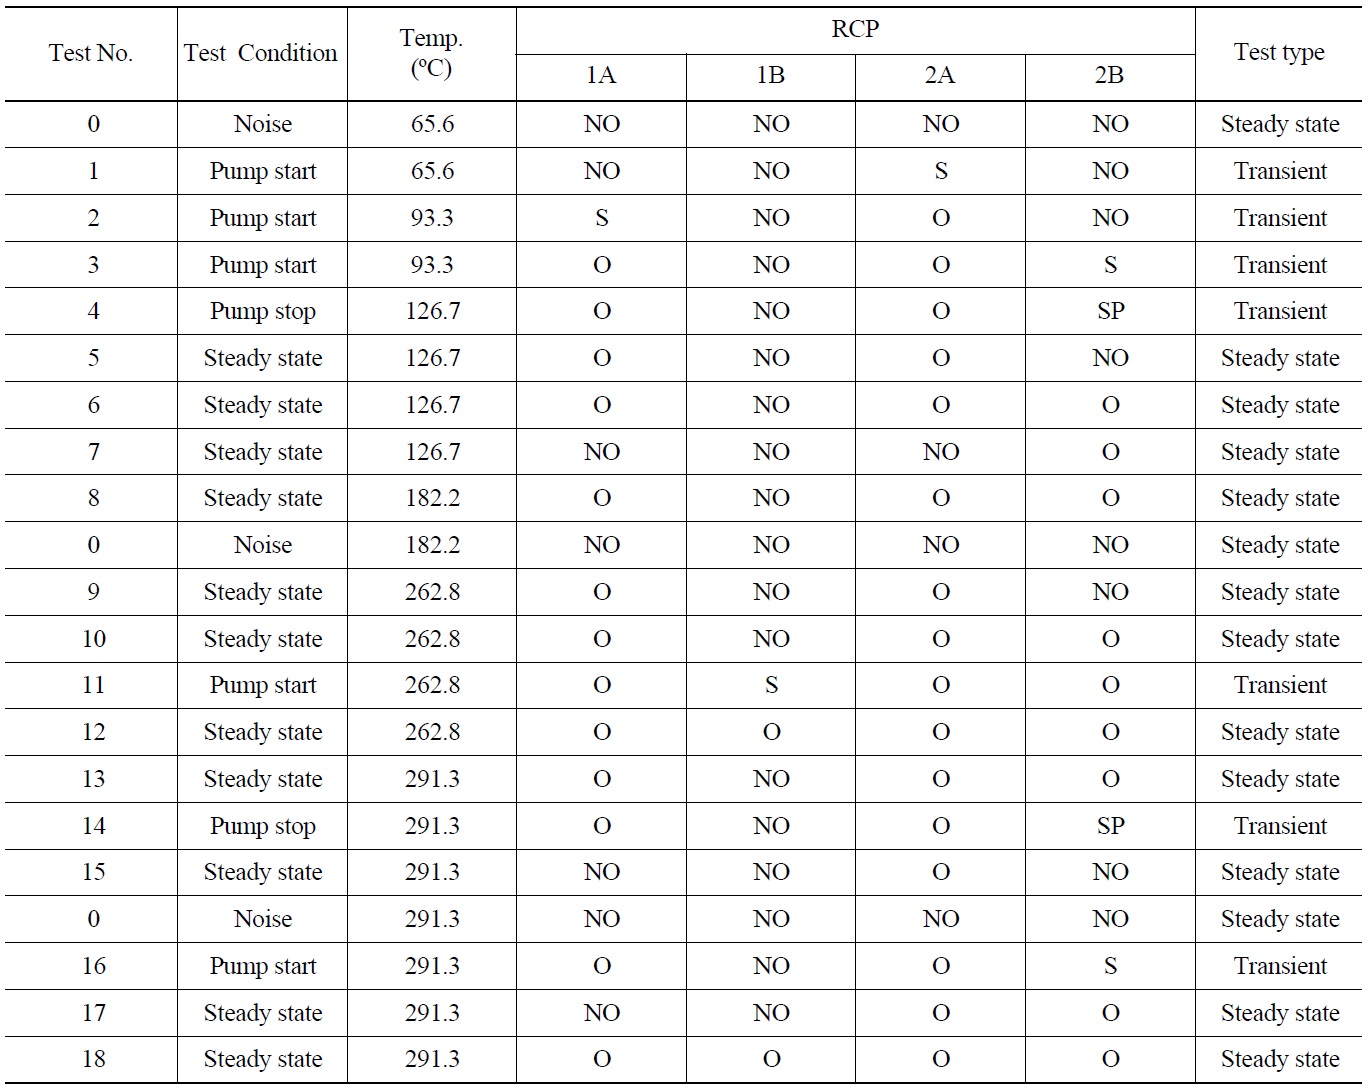
The test conditions for the APR1400 RVI CVAP are set according to the test procedure for the APR1400 CVAP measurement as one of the tests during the HFT prior to nuclear fuels loading.
The flow rate and the temperature are altered, and the response will vary depending on these test conditions (i.e., as a function of the dynamic pressure). Given that the fluid density is higher at a lower temperature, it is assumed that the vibration response in a cold full flow condition will be maximized.
The data is saved in a no-pump operation condition to obtain the background noise, and the pump startup and shutdown transient conditions to record the vibration characteristics corresponding to the normal and partial loop operation settings during various flow conditions.
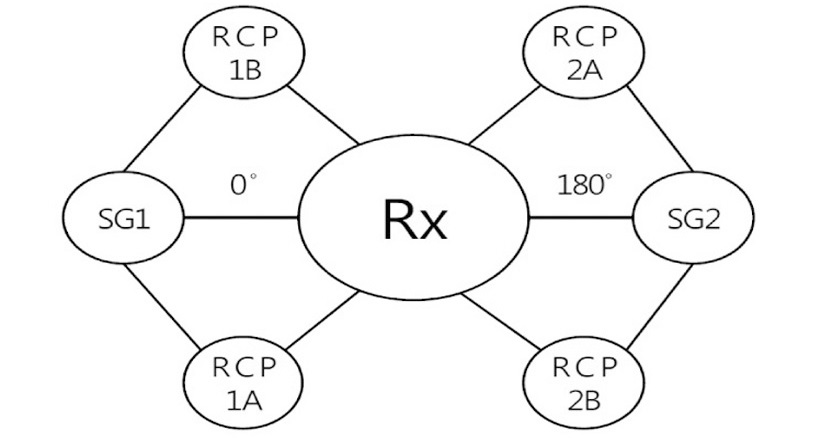
Table 2 and Fig. 2 show the vibration test program for the reactor internals and an outline of the reactor coolant system of the APR1400 system.
The US NRC, Regulatory Guide 1.20, Revision 3 requires that non-prototype reactor internals components be subjected to at least 106 cycles of vibration (i.e., computed at the components’ minimum significant response frequency), or no less than the valid prototype, to ensure that sufficient visual effects are produced, so as to assess the component integrity properly. The Palo Verde nuclear power plant unit 1 documented for the valid prototype required at least 106 cycles of vibration on the critical component (the core support barrel; CSB) to establish a meaningful indication of the component’s function. Based on a conservatively low calculated minimum natural frequency of 7.05 Hz for the APR1400 and its CSB, 1.70 days of normal operation under a primary flow involving four pumps was required.
2.2 Measurement Locations and Purposes
The vibration and stress analysis program of the RVI CVAP is utilized as a means of theoretically verifying the structural integrity of the system, and for the selection of the appropriate vibration and stress measurement locations. However, the measurement locations could not be determined only by the analysis results [3].
[Table 1.] Suggested Specifications of Transducers for the APR1400 RVI CVAP in this Study
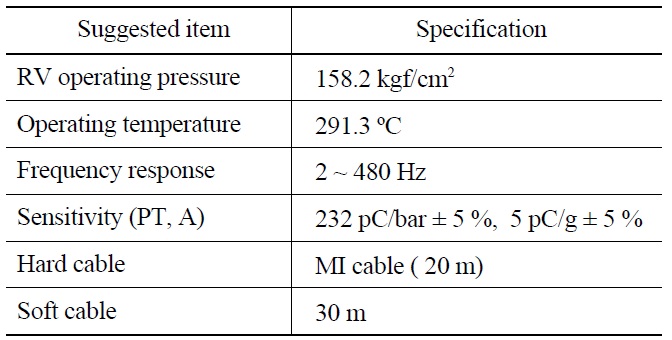
Suggested Specifications of Transducers for the APR1400 RVI CVAP in this Study
There are two types of measurement programs, extensive measurements and limited measurements, according to the classification of reactor internals relative to the CVAP. They are categorized according to the design, operating parameters, and operating experience with potential prototypes. Moreover, the measurement program has considerable influence over the construction period of a nuclear power plant, as safety of the reactor must be verified when some design factors of the reactor are changed for the measurement program of the CVAP.
As noted in the introduction in this paper, the Non- Prototype Category Ⅱ involves an analysis, limited measurements, and a full inspection. Therefore, the APR1400 RVI CVAP using the Non-Prototype Category Ⅱ should be selected for one or more structures in the reactor internals for limited measurements [1,3]. The response results in the previous study show that the upper guide structure (UGS) and the inner barrel assembly (IBA) possess the necessary levels of structural integrity [5-9]. Specifically, the fatigue margin of the UGS and the IBA are 6.59 and 2.90, respectively; however, these structures can be included as components in the measurement program of the Non-Prototype Category Ⅱ for the APR1400 CVAP [5-7].
In earlier research related to the APR1400 CVAP, Ko determined the selection criteria of the measurement locations for the APR1400 CVAP to solve matters of grave concern [3], and affirmed that the arrangement and size of the CSB and the lower support structure (LSS) of the APR1400 are nearly identical compared to a valid prototype (the Palo Verde nuclear power plant, unit 1). However, the UGS assembly design was altered for better integrity, made possible by a change in the loads path of the control element assembly shroud (CEA shroud). Moreover, the design and operating conditions of the APR1400 design are quite similar to that of the valid prototype, except for the increase in the thermal capacity (6 %) and the increase in the operating coolant flow rate (1.56%).
The vibration and stress measurement results of the RVI CVAP for unit 1 of the Palo Verde nuclear power plant demonstrate that the measured values are very low in comparison to the test acceptance criteria. Therefore, Ko asserted that when the vibration and stress measurement
[Table 2.] Vibration Test Conditions of the APR1400 RVI CVAP

Vibration Test Conditions of the APR1400 RVI CVAP
programs of the APR1400 CVAP are used, the CSB and the LSS should be omitted and the UGS assembly should instead be selected [3,5]. We determined the measurement locations for the APR1400 CVAP based on the selection criteria of the classification of the regulatory guide, the hydraulic and structural analysis results, the possibility of installation and disassembly, whether or not there was a design change of the APR1400, and the design materials of the APR1400 and measurement data of the prototype reactor.
The instruments of the pressure transducers, accelerometers and strain gages are mounted on specified components, in this case the UGS and the IBA, and at specific locations. The lead wires of the transducers inside the reactor vessel will be routed to outside the reactor through penetration into the pressure boundary in the reactor vessel head, creating a control element drive mechanism (CEDM) spare nozzle. All of the transducers, lead wires and attachments (conduits, sensor covers, stalks, and others) inside the reactor will be removed after the measurement program is completed.
The IBA is a part of the UGS assembly, and the structure improves the design of the flow-induced vibration and the seismicity [11-16,18]. However, the IBA will be measured at the APR1400 RVI CVAP because it was designed for the first APR1400.
[Table 3.] Locations and Purposes of the Sensors for APR1400 RVI CVAP

Locations and Purposes of the Sensors for APR1400 RVI CVAP
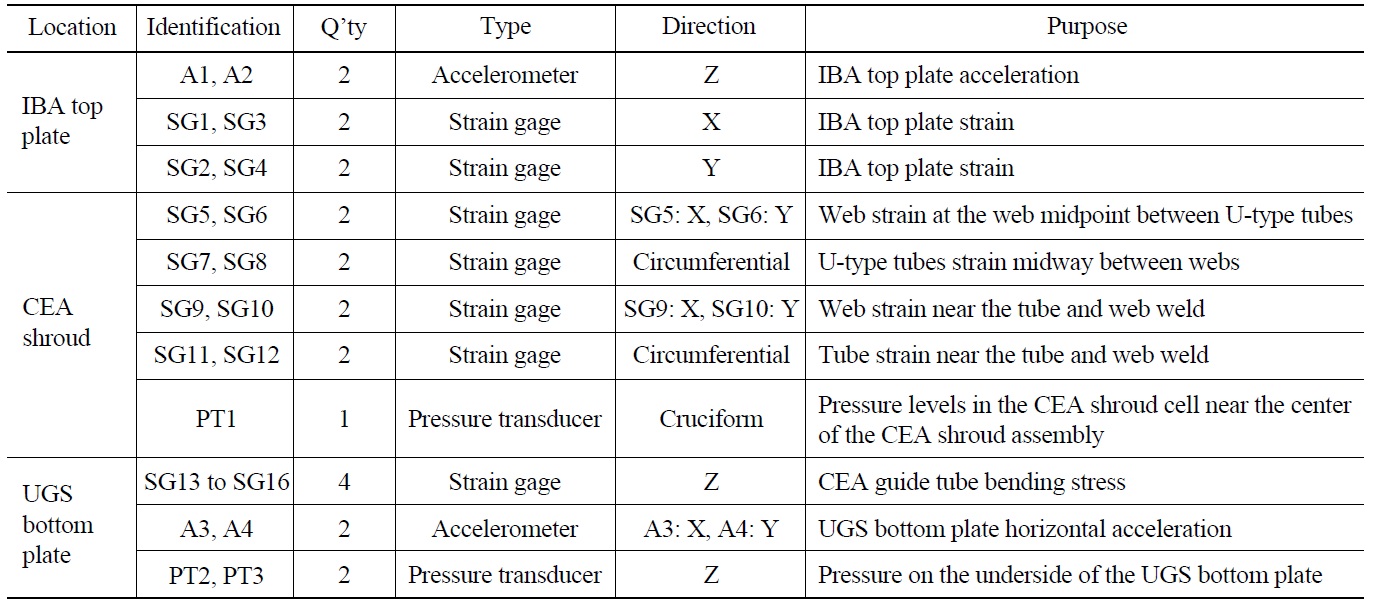
The types and locations of the sensors are selected in the UGS assembly according to the structural analysis results. Table 3 shows the measurement locations and objectives of the instruments for the APR1400 RVI CVAP.
A1 and A2 on the IBA top plate serve to measure the acceleration in the Z direction. SG1 and SG3 along with SG2 and SG4 for the stress on the IBA top plate will be attached at the X and Y directions, respectively. The strain gages can be used at a high temperature and in a welded environment [2,6].
The CEA shroud is an important structure in the reactor internals, because it prevents interference between the control element assemblies and guides them as they modulate the fission.
The measuring objectives of the strain gages at the CEA shroud are various; SG5 (X direction) and SG6 (Y direction) are instrumented to acquire the web strain data at the web midpoint between the U-type tubes; SG7 and SG8 will be installed to obtain the U-tubes strain, midway between the webs in the circumferential direction; SG9 (X direction) and SG10 (Y direction) will be welded to obtain the web strain near the tube and web weld; and SG11 and SG12 are placed to gain the tube strain near the tube and the web weld in the circumferential direction.
The pressure levels in the CEA shroud cell caused by the hydraulic loads should be measured by PT1 near the center of the CEA shroud assembly in the cruciform direction.
The UGS bottom plate is the location where the greatest hydraulic loads can be expected. The main flow of the coolant by the RCPs changes sharply to the outlet nozzles of the reactor vessel at the UGS bottom plate.
PT2 and PT3 serve to measure the pressure data on the underside of the UGS bottom plate in the Z direction.
To confirm the horizontal acceleration at the UGS bottom plate, A3 (X direction) and A4 (Y direction) are set to 0 and 180 degrees, respectively. SG13 to SG16 are measured to obtain the bending stress on the CEA guide tubes at the Z direction.
3. PERFORMANCE TEST OF THE TRANSDUCERS AND DESIGN OF MEASUREMENT SYSTEM
3.1 Performance Test of Transducers for APR1400 CVAP
The environment of the preoperational test, including the pre-core HFT in water, has a pressure of 158.2 kgf/cm2 and a temperature of 291.3 ℃. All of the transducers installed inside the reactor should endure these conditions. The insulation tests should be performed for all of the transducers at the test pressure and temperature in water to verify their integrity.
In this study, we conducted performance tests to validate the integrity of the pressure transducer and the accelerometer; the strain gage was excluded because it has sufficient use experience for measurements of the CVAP and is unrelated to the pressure.
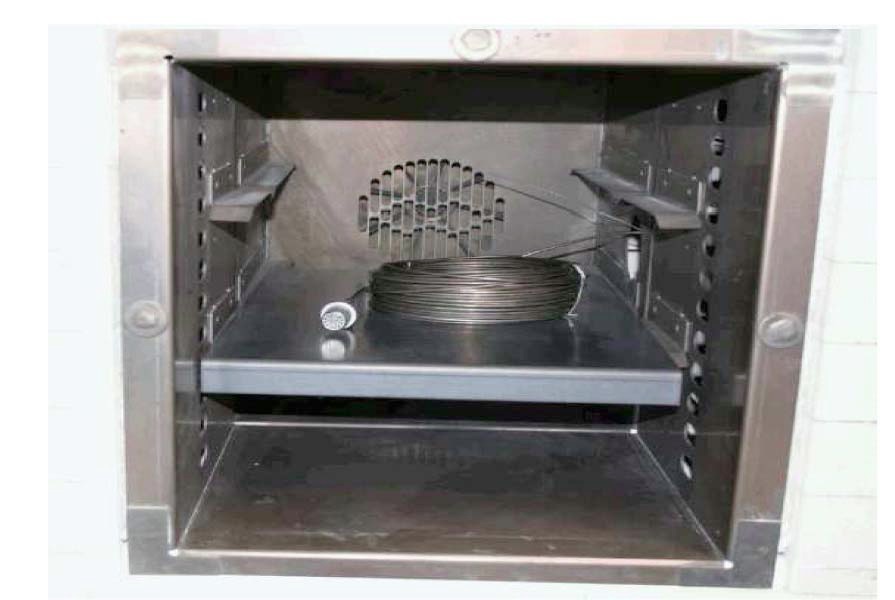
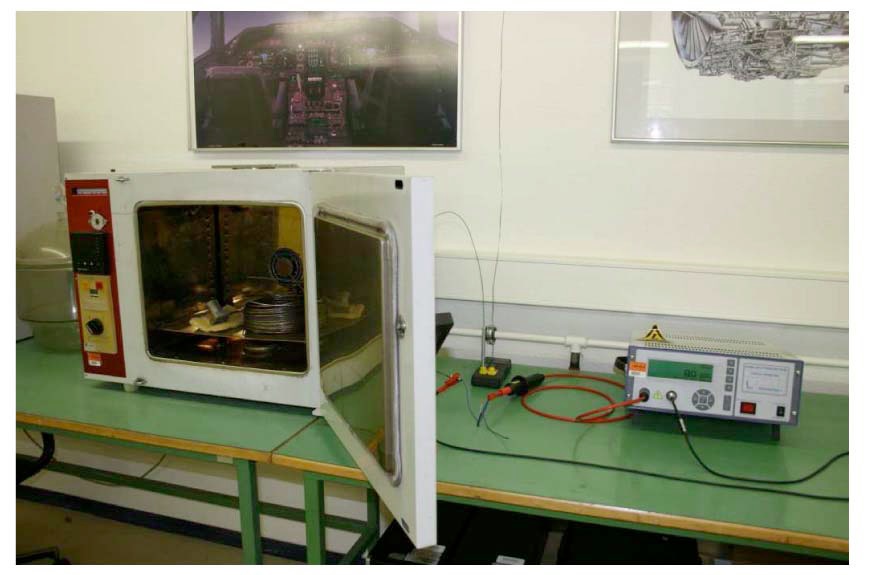
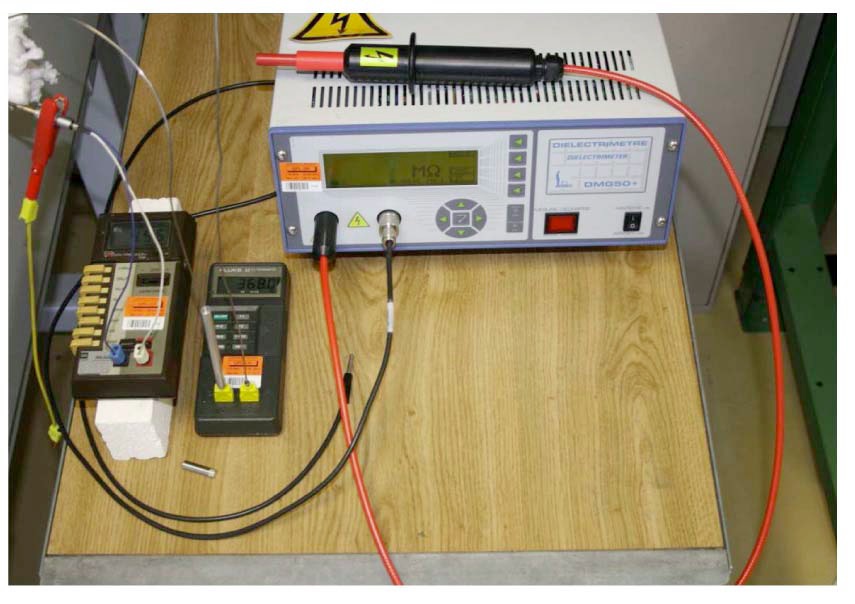
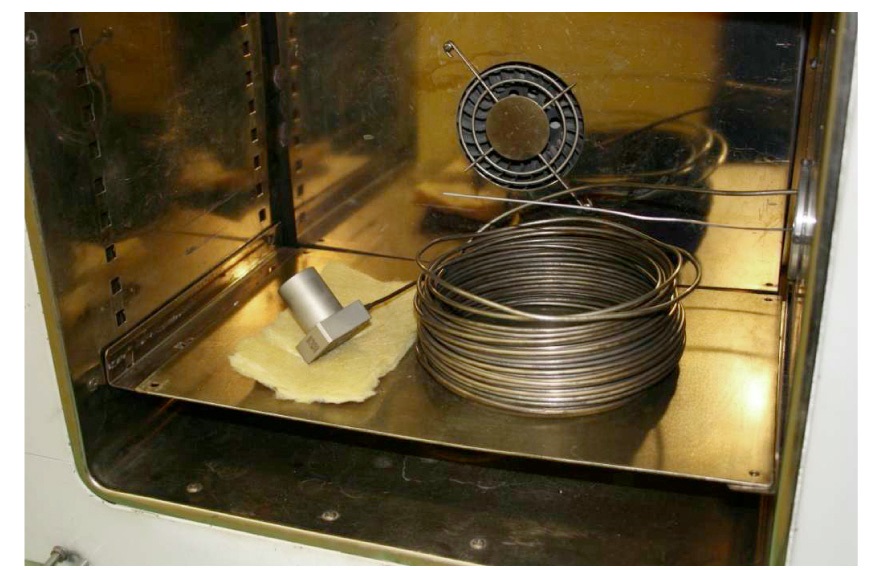
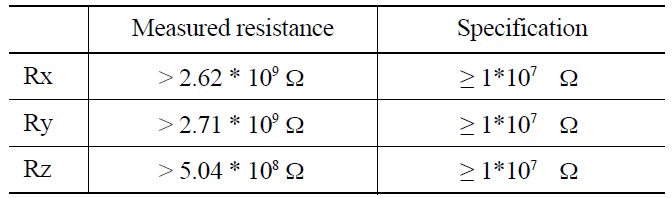
Fig. 3 shows a picture of the pressure transducer in the oven for the resistance test at 300 ℃. Fig. 4 shows an image of the test setup. The lead wire for the measurements, the hard cable, was connected to the pressure transducer in an oven. The transducer was subjected to a temperature of 300 ℃ and the resistance measurement was carried out. The resistance was measured by means of a megohmmeter at a test voltage of 50 Vdc, after which the values were recorded. These test results were obtained as shown in
Table 4. According to the test results, the high-temperature requirements for the pressure transducer were satisfied.
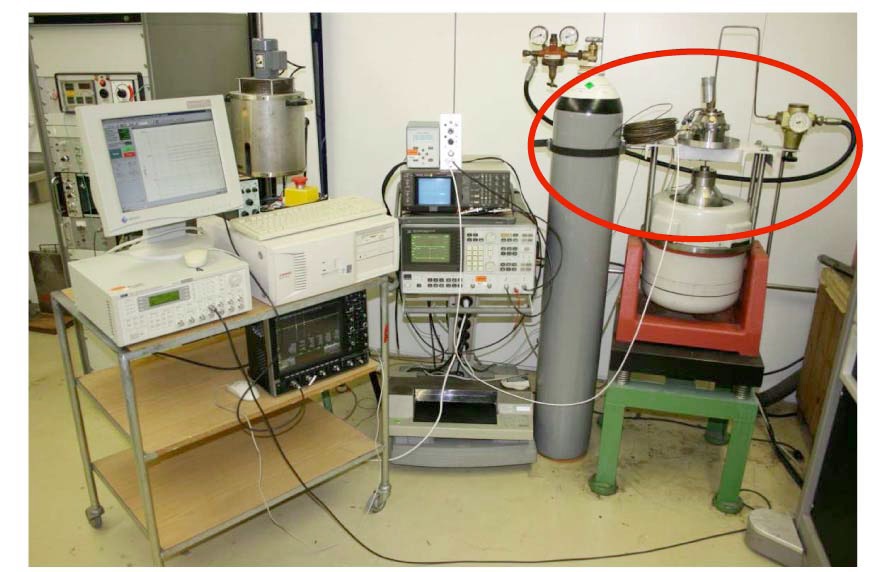
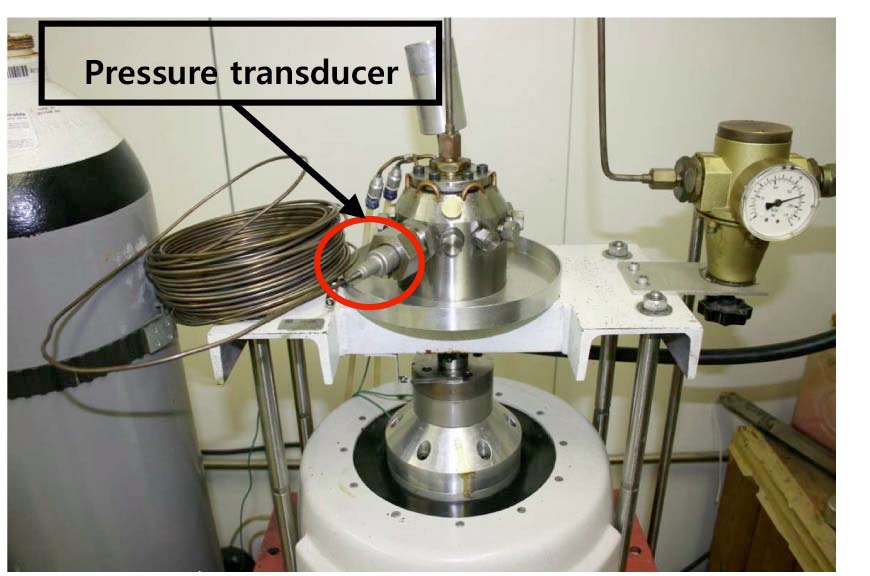
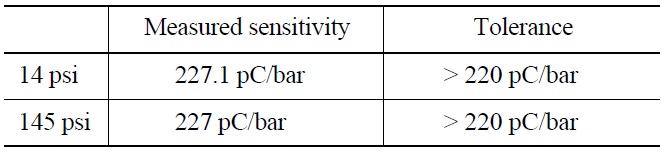
Fig. 5 shows an image of the test setup for the dynamic pressure sensitivity of the pressure transducer. Fig. 6 is the magnified image of the circle in Fig. 5 to show the pressure of the pressure transducer. The transducer was applied at a static pressure of 1740 psi. The sensor was adjusted to a dynamic peak pressure of 14 psi and the sensitivity measurement was performed at 20 Hz. The dynamic pressure was regulated to a psi peak of 145 and the sensitivity measurement was conducted at 20 Hz. The sensitivity values were then recorded. These test results were obtained as shown in Table 5. A sensitivity tolerance of the pressure transducer should be larger than 220 pC/bar because the sensitivity specification of the pressure transducer is 232 pC/bar ± 5 %. According to the test results, the high-pressure requirements for the pressure transducer were satisfied.
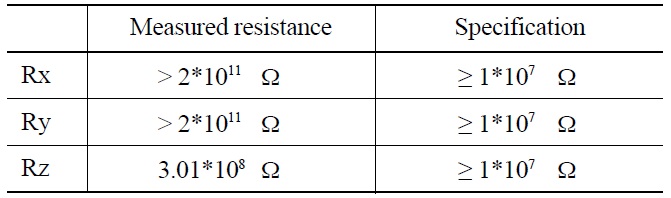
Fig. 7 shows an image of the accelerometer in the oven used for the insulation resistance test at 300 ℃. Fig. 8 is an image of the test setup. The lead wire for the accelerometer is connected to a megohmmeter for the resistance measurement. The transducer was subjected to a temperature of 300 ℃ and the insulation resistance measurement was carried out. The resistance was measured at a test voltage of 50 Vdc and the values were recorded. These test
[Table 4.] Results of the Resistance Test for the Pressure Transducer at 300℃
Results of the Resistance Test for the Pressure Transducer at 300℃
[Table 5.] Results of the Sensitivity Test for the Pressure Transducer with Pressure and Vibration

Results of the Sensitivity Test for the Pressure Transducer with Pressure and Vibration
results were obtained as shown in Table 6. According to the test results, the high-temperature requirements for the accelerometer were satisfied.
As shown above in the performance test results, the selected transducers can be used in the measurement system for the APR1400 RVI CVAP.
[Table 6.] Results of the Insulation Resistance Test for the Accelerometer at 300 ℃
Results of the Insulation Resistance Test for the Accelerometer at 300 ℃
3.2 Design of the Vibration and Stress Measurement System
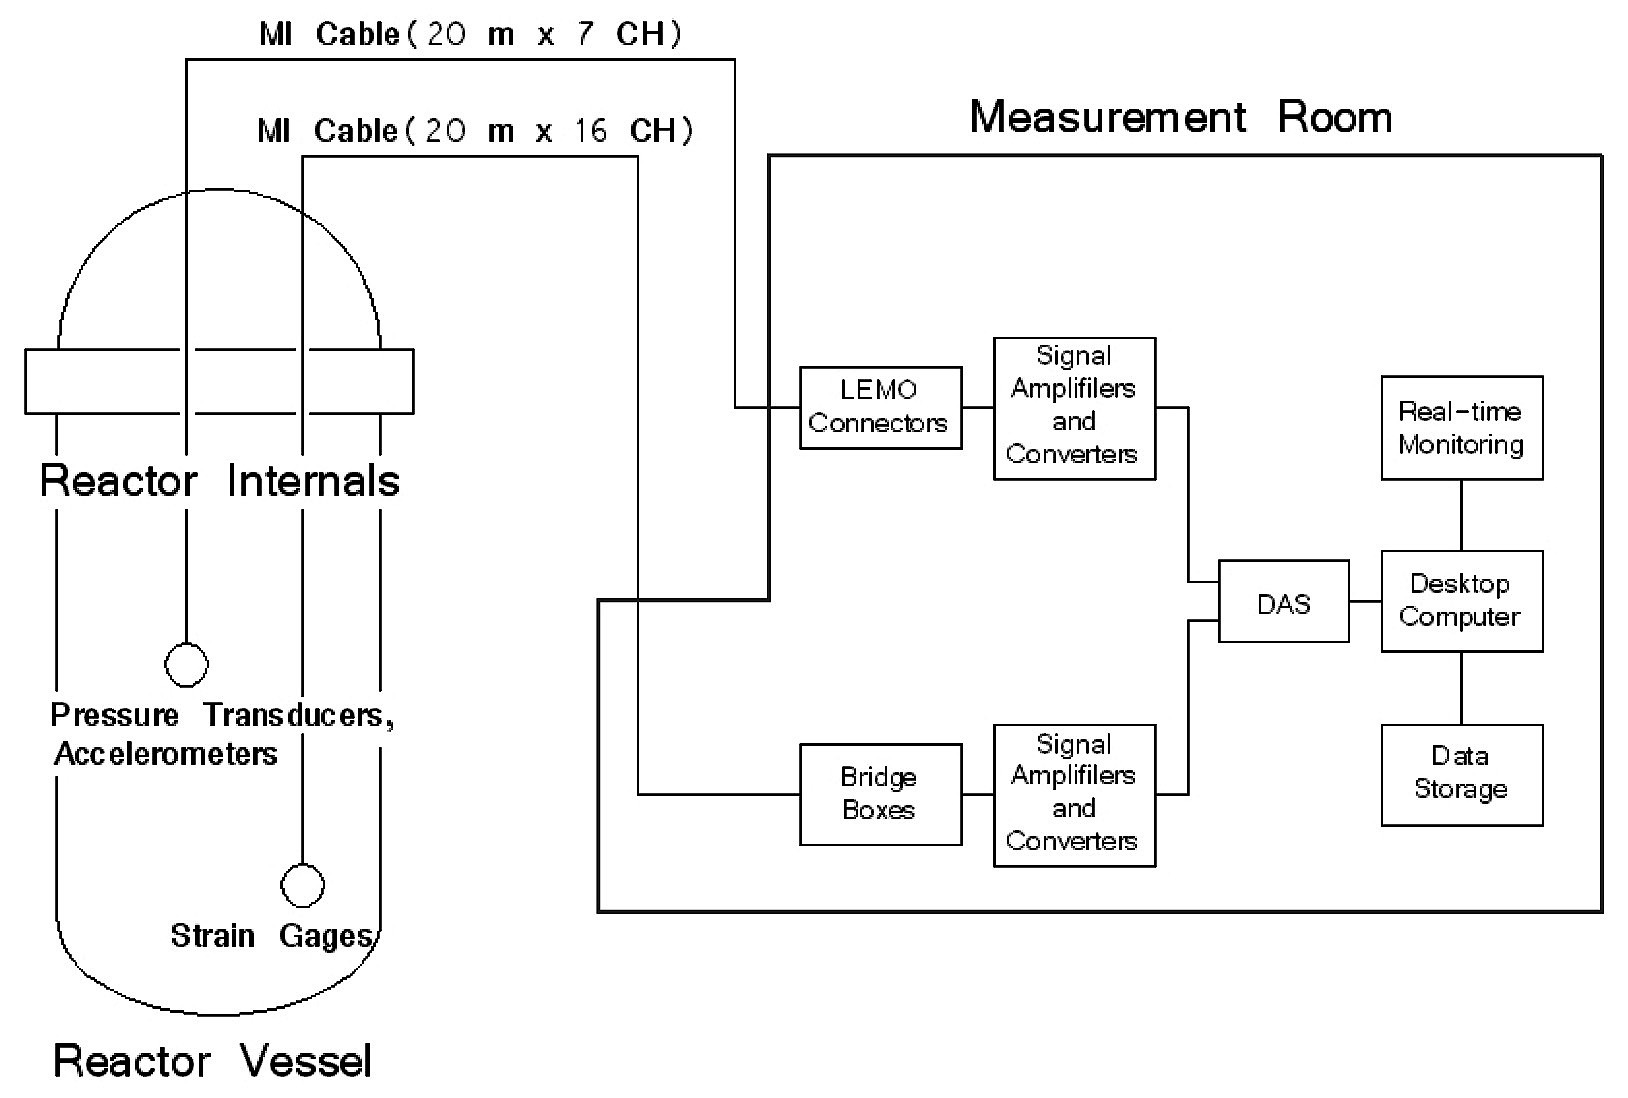
The measurement system for the APR1400 RVI CVAP is designed to record the time historical digital data from the transducers on desktop computer storage devices.
The pressure transducer and the accelerometer convert the stress and the vibration into electric charge signals, while the strain gage changes the vibration into electric current signals.
The hard cables from the transducers inside the reactor and the soft cable outside the reactor are connected by electric connectors.
The charge signals of the pressure transducers and the accelerometers are connected to the signal amplifiers and the converters; these signals are converted to a current signal and are then changed to voltage signals.
The current signals of the strain gages are connected to the signal amplifiers and the converters; these signals are converted to the voltage signals.
All of the voltage signals are input into the DAS via frequency filters and analog-to-digital converters, after which they are saved via data storage on a desktop computer.
The data acquisition process is performed up to 500 Hz for each CVAP test condition. The sampling rate is set to 1,500 per second based on the Nyquist?Shannon sampling theorem. The analog-to-digital signals for the resolution (A/D resolution) are set to 16 bits. All recordings acquired 98,304,000 samples for each of the 23 instruments channels; 98,304,000 samples are acquired by 216 × bits 1,500 per second. A total of 2,156 mega samples per second will be recorded into data storage for the CVAP recording ranges; 2,156 mega samples are acquired by 98,304,000 samples × 23 channels.
The signal level of each transducer will be checked prior to the test to adjust the gains for the signal amplifiers for the pressure transducers and the accelerometers. The dynamic strain amplifiers for the strain gages will be balanced and their sensitivities will be selected.
The spectrum of each signal will be monitored through the test to verify the recording process and the adequacy of the level of data signals.
Fig. 9 shows a block diagram of the vibration and stress measurement system designed in this study.
The measurement program of the APR1400 RVI CVAP as an important test could be carried out during the preoperational and initial startup testing for the design validation of the APR1400. The objectives of the measurement program are to verify the analysis methods and provide information pertaining to a direct assessment of the vibratory behavior of the reactor internals. The design of the measurement system is necessary as one of the core technologies to perform a successful RVI CVAP. In this paper, we designed a vibration and stress measurement system for the APR1400 RVI CVAP according to the US NRC Regulatory Guide 1.20 based on the APR1400 design materials, hydraulic and structural analysis results, and on the results of the performance tests of transducers in an extreme environment. The measurement system proposed for the APR1400 RVI CVAP can be used at actual construction sites, and is slated to be applied to a nuclear power plant (Shin-kori, unit 4) that is currently under construction in Korea.
A ccelerometer
APR1400 Advanced Power Reactor 1400
CEA control element assembly
CEDM control element drive mechanism
CFR Code of Federal Regulations
CSB core support barrel
CVAP comprehensive vibration assessment program
DAS data acquisition system
GDC General Design Criterion
HFT hot functional test
IBA inner barrel assembly
KHNP Korea Hydro & Nuclear Power Company
LSS lower support structure
MTBF mean time between failures
MTTF mean time to failure
PT pressure transducer
RVI reactor vessel internals
SG strain gage
UGS upper guide structure
US NRC United State Nuclear Regulatory Commission