For over a decade an assay system based on fluorescence has been considered as one of the most commonly used and well established analytical methods, especially for applications such as high-throughput genomic and proteomic analysis, drug screening tests and real-time PCR (Polymer Chain Reaction) [1-10]. Recently, simplifying the fluorescence detection system has become more crucial because of the advent of micro total analysis systems (μTAS) many advantages in terms of speed, throughput and costs [11]. However, there are still many difficulties in implementing the fluorometer as a component of μTAS because most of the earlier commercialized fluorometers are bulky as well as requiring lots of expensive optical components such as pass filters, polarizers and photomultiplier tubes (PMT) [11]. Most of such optical components are closely connected with removing or treating the interference arising between the excitation light and the emitted light.
Many trials have been conducted to miniaturize the fluorescence detection system and at the same time improve its performance [5-7]. Gihan et al.(2011) [5] devised a fluorescence immunoassay structured with a micro fluidic system that can handle liquid, where two orthogonally aligned linear polarizers are used to reduce the excitation light background that reaches the detector, and then pass filters help to discriminate the fluorescence signal from any excitation light background. These filters and polarizers, however, give some disadvantages in the loss of excitation light delivered to and fluorescence signal collected from the sample. A similar research was done by Pais et al. (2008) [6] where they reported a disposable lab-on-a-chip (LOC) with an organic light-emitting diode (OLED) excitation source and an organic photodiode (OPD) detector for on-chip fluorescence analysis. They used a cross-polarization scheme to filter out excitation light from a fluorescent dye emission spectrum. The cross-polarizer does, however, reduce the overall intensity. Novak et al. (2007) [7] also implemented an integrated fluorescence detection system by a modified pickup head of digital versatile disc (DVD). This requires a dichroic mirror for the optical separation of excitation and emission channels and uses filters for reducing the excitation leakage light as well. These previous studies have a common feature that the exciting light and the emitting light travel in the same optical path and thus the interference from the excitation leakage light is unavoidable. Generally, this kind of interference can be minimized by careful placement of optical components like pass filters and polarizers. Furthermore, using those optical components results in decreasing the overall intensity so that an expensive amplifier like PMT should be added.
We demonstrate a fluorescence detection system based on TIR configuration in which the excitation light and the emitted light are spatially perpendicular to each other so that the interference could be significantly reduced with a simple design that doesn’t require any separate filter or polarizer. In order to apply the proposed system to various μTAS such as LOC and lab on a disc (LOD), the diffusion and mixing techniques are very important. These studies already have been reported in the literature [12-13].
The aim of this paper is to provide a compact and simple TIR based fluorometer having a good detection limit, thus being ready to use for μTAS.
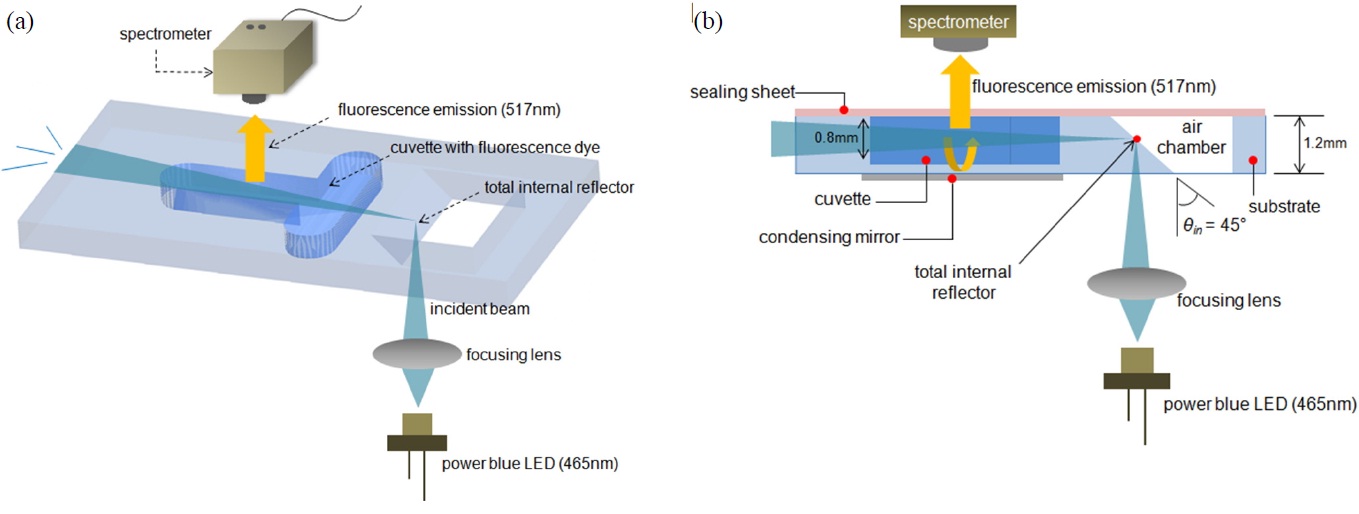
The distinctive feature of our fluorometer is the use of the TIR excitation mechanism combined with a condensing mirror. Fig. 1 shows the whole schematic diagram of the proposed fluorometer where the test sample is contained within a cuvette with a volume of approximately 10 ㎕. The cuvette has a dimension of width 1.5 mm × depth 0.8 mm × length 5 mm.
Our optical system consists of a total internal reflector and a condensing mirror, all of which are integrated on a polycarbonate sheet with a thickness of 1.2 mm through a CNC (computer numerically controlled) machining and polishing process. The cuvette is fabricated using an end-mill of 1mm diameter and the total internal reflector is manufactured by a standard tapered milling head end-mill. The facets of the total internal reflector and cuvette are flattened by using 1,000, 2,000, 5,000 grade sandpaper and polished by
a 10,000 grit diamond compound. The transmittance of polished facets has through this process been enhanced by 85%.
The total internal reflector makes an orthogonal detection feasible whereas the condensing mirror makes more fluorescence light emitted from the sample pass through the spectrometer, otherwise the light will be spread out in all directions. In this experiment, the fluorescent dye 6-FAM (Merck co., USA) with an excitation and emission of 492/517 nm, which is a common fluorescent reagent, was used as the test sample to verify the performance of our system. It is excited by a high power blue LED (Photron co., Korea) of 465 nm with luminous flux of 28 lm and then emits a fluorescence centered at 517 nm. The 6-FAM powder is mixed with 0.5 X PBS in 1.5 ml sample tube and the mixed sample is shaken for 10 seconds using a vortexer and then incubated for 1 minute on room temperature before fluorescence detection. The dilution series started from a concentration 5 nmol/L to 160 nmol/L. The sample of 10 ㎕ is loaded in the cuvette of a microchip using a pipette and then sealed by optically clear adhesive sealing sheet (AB-1170, Thermo Fisher Scientific Inc., USA).
The LED light passes through a focusing lens before it reaches the total internal reflector. After experiencing TIR, the totally reflected light continues to travel along the internal substrate made of the optically transparent polycarbonate and finally excites the dye while being transmitted through the cuvette with the emission of fluorescence depending on the dye concentration in the sample, and then the excitation beam is scattered. Here it should be noted that the fluorescence emission is detected at the orthogonal angle to the excitation beam to make a spatial separation of exciting and emitting light and thereby the interference between them can be greatly reduced. That’s the reason why the spectrometer (K-MAC co., Korea) was perpendicularly installed to the forward direction of the excitation beam. However, since the fluorescence emitted from the sample is scattered in random directions, the orthogonal detection will cause a loss of fluorescence emission.
The solution we adopt in this paper is to collect the scattered fluorescence emission using a condensing mirror coated with aluminum to a thickness of about 200 nm using a sputter system (Oerlikon co., Switzerland) under the condition of 400 V, 4.6 kW. The condensing mirror’s main role is to collect the light emitted from the sample and thus allow more fluorescence emission to be directed to the spectrometer. Lastly, the condensed light is directed through an optically clear adhesive sealing sheet and then falls on the spectrometer. It is known that TIR occurs when an incident ray travels from a more refractive medium to a less refractive medium at an incident angle (
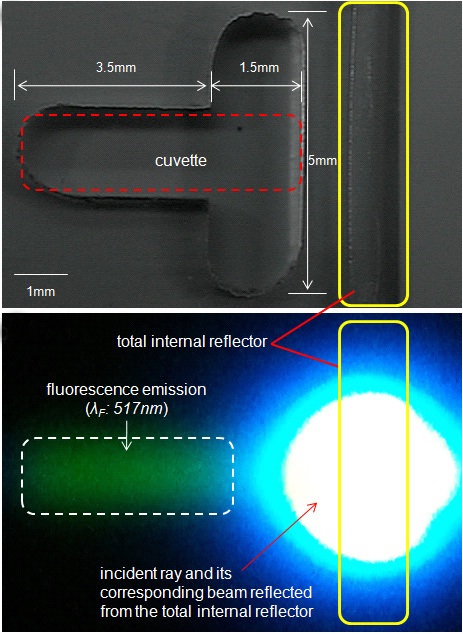
Figure 2(b) shows a green fluorescence emission (
from the total internal reflector and thereby the 6-FAM is excited. We confirmed the loss of the incident ray on the total internal reflector of the microchip was found to be almost zero by detecting the transmittance of the incident ray through the total internal reflector.
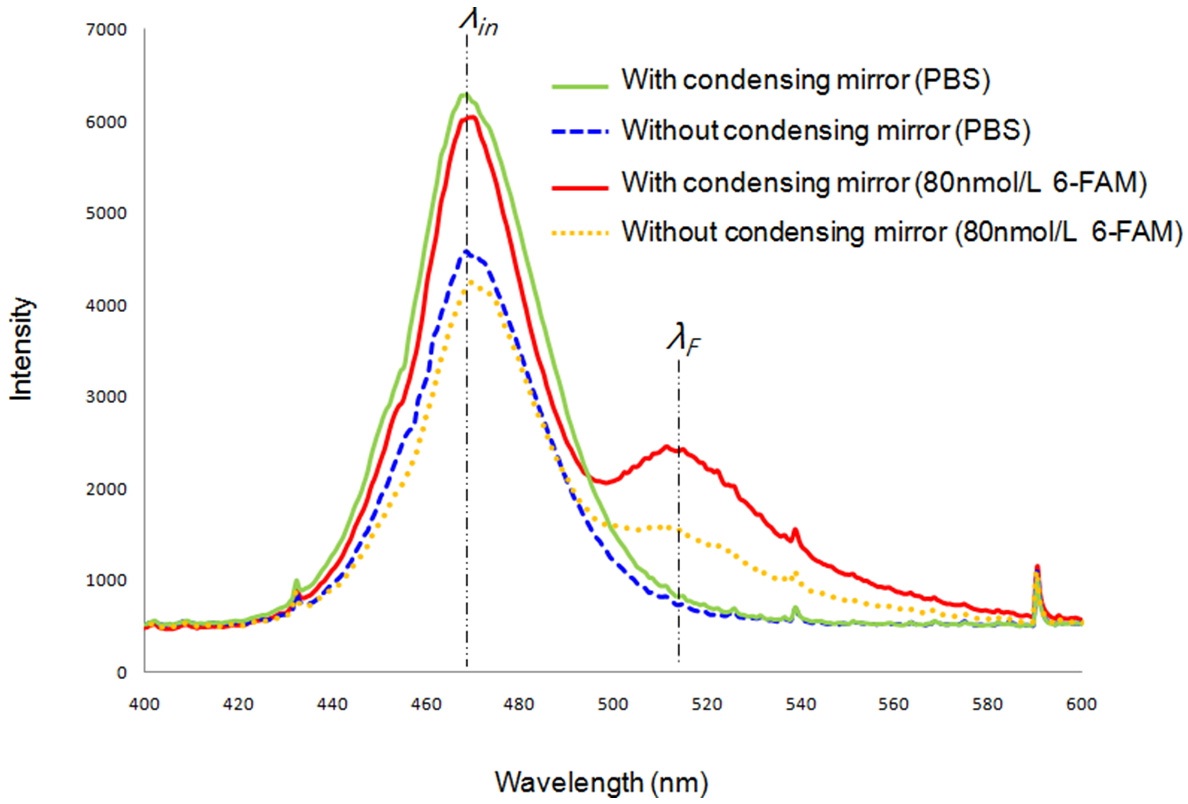
Figure 3 shows a comparison of fluorescence emission before and after the condensing mirror is used. Additionally, this graph presents various intensity profiles including the cases when the cuvette contains only PBS and when the fluorescence dye 6-FAM (80 nmol/L) is involved in the sample. It tells us the condensing mirror’s usefulness. When the sample contains only phosphate buffered saline (0.5X PBS) solution, there is little or no difference in the fluorescence emission (at the wavelength
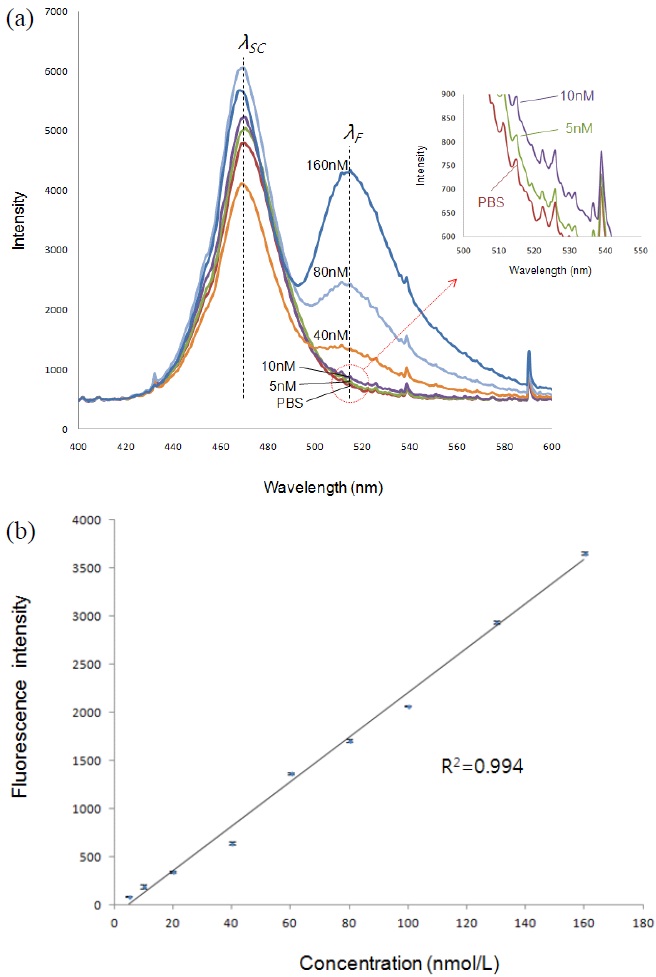
We also measured the fluorescence intensity of different 6-FAM concentrations (from 5 to 160 nmol/L) to obtain the limit of detection and its correlation coefficient (R2), in which 0.5X PBS was used for diluting the 6-FAM. As expected, as shown in Fig. 4, the fluorescence intensity proportionally decreased with the decrease of concentration of 6-FAM up to 5 nmol/L, showing the lower limit of detection for 6-FAM to be 5 nmol/L. Here the lower limit was defined as a minimum level of 6-FAM that can be distinguished from PBS solution. And also Fig. 4 illustrates the resultant linearity with R2 = 0.992 which was observed in the range from 5 to 160 nmol/L for 6-FAM. Saturation
of the detector at 17,000 of intensity determines the upper detection limit, which corresponds to a concentration of 770 nmol/L. That means the dynamic range of our system is from 5 to 770 nmol/L. The error bars of Fig. 4 represent standard deviation for 10 times detection of each of the concentration samples.
We achieved good linearity and limit of detection value by combination of function of total internal reflector as laser beam guide and the collecting effect of the scattered fluorescence of the condensing mirror on the microchip without various filters and the high cost detector applied by other researchers. The sensitivity of our system is similar to the fluorescence detection system of Gihan et al. [5] and Novak et al. [7] and is sufficient to be used for real time PCR applications, as a typical commercial PCR system based on a PMT has a sensitivity limit of around 5 nmol/L [7], as well as general quantification assays of DNA and protein.
We are currently applying it to an LOD based real-time PCR system, with total internal reflector and condensing mirror, including diffusion process, metering, purification and detection for food pathogen detection. We think our low cost optical techniques will contribute to commercializing various POCT diagnosis systems based on fluorescence detection.
Through this study, we have developed a novel fluorescence detection system based on TIR phenomenon in which the total internal reflector makes the orthogonal detection available and the condensing mirror increases the selectivity of the fluorescence emission, giving a lower detection limit of 5 nmol/L with a linearity of 0.994. Experimental results show that our system’s performance was good enough not to require any extra optical components necessary to lower the optical interference commonly arising between incident and emission light. Both total internal reflector and condensing mirror were fully integrated in a single substrate along with a cuvette, so the loss and degradation from the optical interface could be significantly minimized, leading to a compact and slim design. We believe that the proposed fluorescence detection system will be one of the best suitable approaches for μTAS applications of fluorometer.