Recently, the adoption of white LEDs as illumination sources even in industrial fields dramatically increases owing to the LED’s low energy consumption which provides positive environmental effects. Several approaches widely used today for the generation of white light using LEDs have been introduced in past studies [1,2]. Among them, there is a fascinating approach to use a blue LED and phosphors, called as phosphor converted (PC) white LEDs [3-6]. A PC white LED consists of a blue LED and yellow phosphors. Blue light is emitted from the blue LED and half of the emitted blue light is converted into yellow light by the yellow phosphors. The mixture of blue light and yellow light can be perceived as white light. Unfortunately, due to this wavelength convertsion, the reduction in luminous efficacy is inevitable. In addition, the phosphorescence lifetime of yellow phosphors is in approximately millisecond range [1], which implies that PC white LEDs cannot be used for the higher speed switching more than several kHz. Despite these limitations, the PC white LEDs provide several benefits: a compact packaging, a single power supply, and a high color rendering index. Thus, their light intensity can be conveniently modulated by employing a single driving circuit, thereby essential light-dimming features in an illumination system can be readily attained. These properties have stimulated the PC white LEDs to be widely adopted in industrial and commercial illumination systems [1,2] as well as for numerous applications [7-11].
Most PC white LEDs are designed and fabricated with the assumption that a constant driving current is applied. The PC white LEDs, however, are often required to be operated in various modulation conditions such as light dimming and visible light communication. Similar to conventional semiconductors, a driving current modulation changes the energy gap of the LEDs, which brings out variations of their light-emitting characteristics. Thus, in illumination systems using the PC white LEDs, the variations of the LEDs’ chromaticity including color coordinates, color uniformity, and color temperature must be evaluated. The 1931 Commission Internationale de I’eclairage (CIE) chromaticity coordinate (x, y) and the correlated color temperature (CCT) have been widely used for the chromaticity evaluation of general illuminants [12]. Meanwhile, the ganglion cell that is sensitive to the color temperature of the perceived light in the retina of human eyes causes the human circadian (wake-sleep) rhythm to synchronize the periodic variation of the color temperature of natural light [13-15]. Therefore, the variations of chromaticity such as color coordinates and color temperature, originated from the naturally inherent fluctuation or from the intentional alternation of a driving current supplied to LEDs, can give rise to undesirable influences. For example, when a white LED lighting system in an industrial plant is designed having a CCT of 4200 K (cool white), owing to various reasons such as current modulation and fluctuation, the CCT can fall below 3200 K (warm white). This change in CCT of about 1000 K can affect the circadian rhythm of workers and hence can cause drowsiness, which may lead to a decrease in productivity or even serious industrial accidents. Nevertheless, little effort has been made to evaluate the changes in the chromaticity and color temperature of widely-used PC white LEDs under various current modulation conditions except Dyble’s report [16] where chromaticity shifts of the PC white LEDs under both SCM and PWM were analyzed and explained through the relative contribution of the phosphor emission. In the report, the yellow phosphor efficiency in SCM became higher with decreasing forward current, resulting in yellow shifts, whereas that in PWM lower with decreasing duty ratio, resulting in blue shifts.
In this paper, we investigated the effects of driving current modulations on the spatial illuminance distribution, the chromaticity and the CCT of the PC white LEDs by varying the amplitude and the ratio of on/off time of forward current at several distances between the chromameters and the white LED lighting. A white LED lighting as illuminant was fabricated by using commercially available PC white LEDs. A current modulation circuit was also developed for the compatibility of two well-known current modulation methods, SCM and PWM. The illuminance and color coordinate of the white LED lighting were measured in different modulation conditions of forward current in both modes. In particular, the moving direction of the measured color coordinates was investigated and compared with previous studies [16-18]. Additionally, for the purpose of the quantitative evaluation of color deviation, color distance and CCT were also calculated by using the measured data, and then the obtained results were discussed in relation to phosphorescence of yellow phosphor and its lifetime.
2.1. Preparation of the White LED Lighting with PC White LEDs
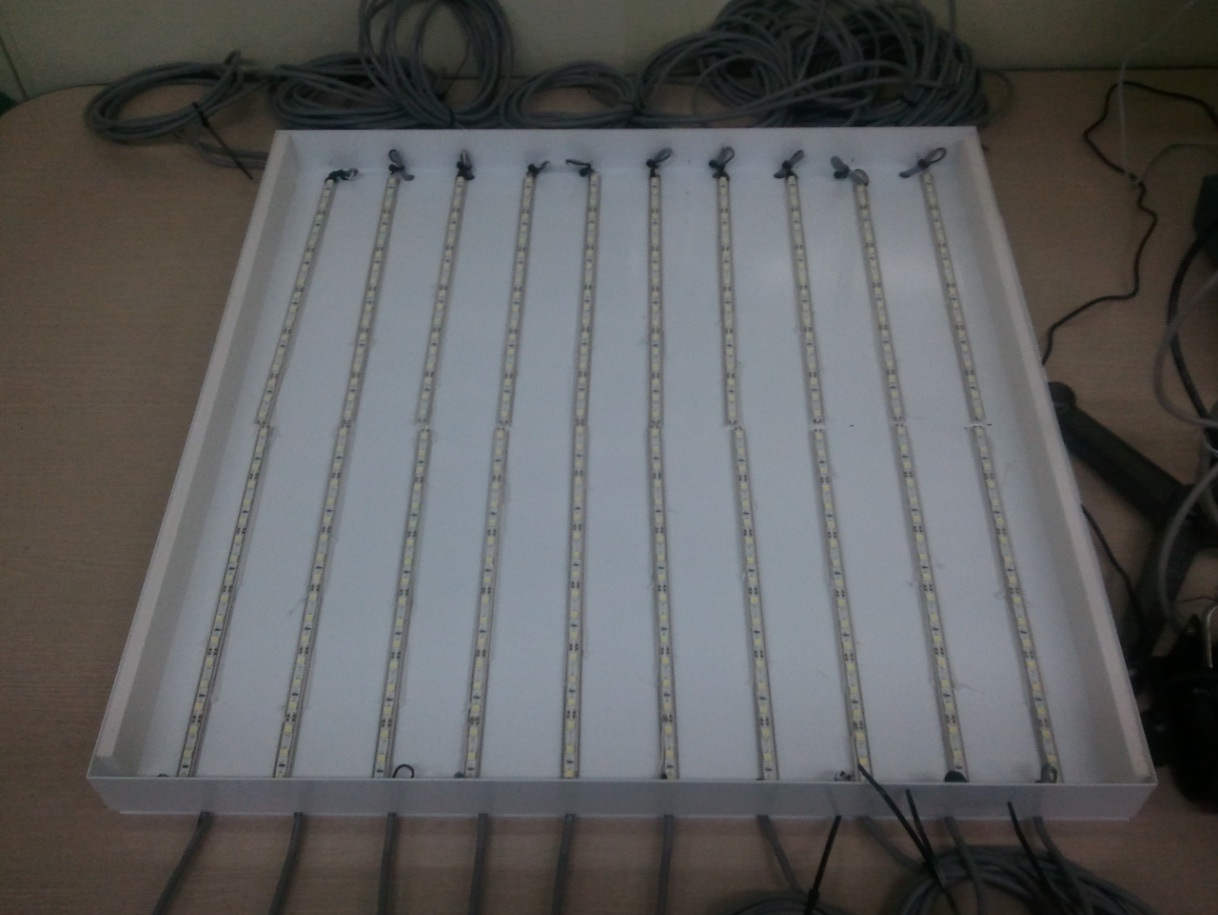
A white LED lighting composed of 360 PC white LEDs
where twenty channels were arrayed as a 2×10 matrix form with the spacing of 50 mm between the adjacent channels as shown in Fig. 1 was fabricated for the experiments. Each channel was made of 18 LEDs. Width, height, and thickness of the lighting panel were 600, 600, and 50 mm, respectively. The output power of a single LED is about 0.2 W at the current injection of 400 mA, which makes the total output power of a single channel in the white LED lighting panel be about 3.6 W. Due to the light directivity of LEDs, the front end of the lighting panel was also covered with a diffusion plate to reduce spatial illuminance variations.
2.2. Current Modulation Circuit
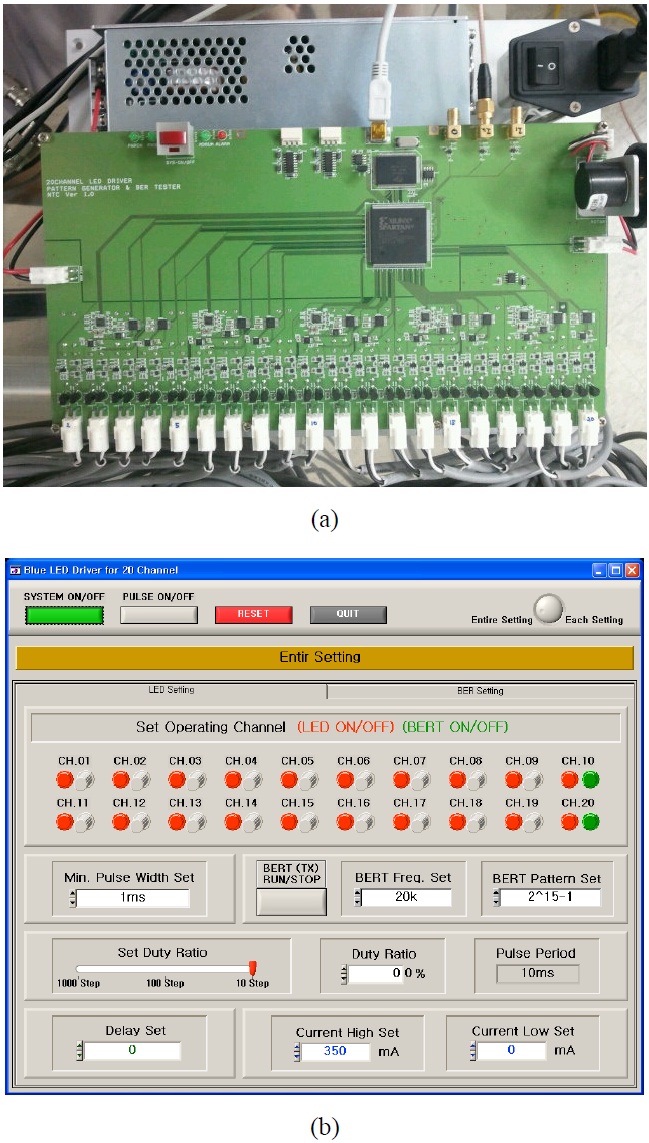
The current modulation circuit that contained twenty current ports as shown in Fig. 2(a) was developed. All ports were designed to be operated under uniform conditions or each port might be independently operated in different conditions by setting control parameters such as current level for on and off states, period and duty ratio. Each current port was allowed to provide the LED channel with forward current up to 400 mA, which was selected as less than the absolute maximum current rating, ~430 mA, for safe operation. All functions of the current modulation circuit were remotely controlled using the graphic user interface (GUI) software as shown in Fig. 2(b). SCM operation was carried out by setting the current level for the on and off states as the same values in the “Current High Set” box and in the “Current Low Set” box of Fig. 2(b) being irrelevant to the duty ratio, or by selecting the duty ratio as 100%. On PWM operation, modulation period (T) was decided by the product of the unit pulse width (W) and the number of steps (N). This relation can be expressed by the following equation:

where W is selected in the “Min. Pulse Width Set” box and N in the “Set Duty Ratio” box as in Fig. 2(b). Duty ratio (DR) in terms of percentage can also be chosen in the “Duty Ratio” box in Fig. 2(b). Then, the on time (τ) of the forward current can be calculated by the following equation:
Therefore, the average current (IAVG) of a PWM signal
can be related to the peak current (IPEAK) by Eq. 3;

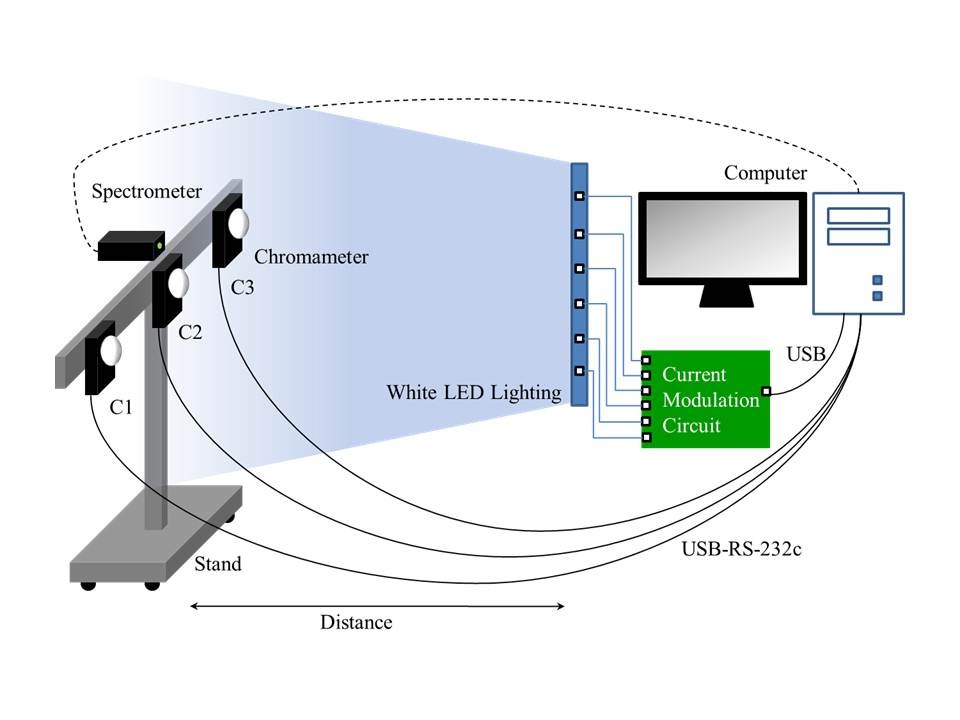
Figure 3 shows a schematic diagram of the measurement setup. The control computer system is connected to the current modulation circuit through the universal serial bus (USB) interface. The circuit provides the white LED lighting panel with various modulated forward currents. In SCM, IAVG supplied to LEDs was varied from 80 mA to 400 mA with 40 mA increments. In order to produce the same IAVG in both modulation modes (SCM and PWM), IPEAK and the increments of duty ratio in PWM were selected as 400 mA and 10%, respectively. The range of duty ratio was chosen as from 20% to 100%. These conditions give rise to the direct comparison of experimental data for both modulation modes. So as to avoid a light flickering, the frequency of the PWM signal was chosen as 1 kHz, which was one of the general dimming frequencies in illumination fields. Three chromameters (CL-200A, Konica Minolta Holdings, Inc.) were employed to detect the illuminance and the CIE chromaticity of the emitted light from the white LED lighting. For spatial distribution measurement, these chromameters were aligned horizontally at intervals of 0.9 meters, which was selected to be approximately equal to 1.5 times the width of the lighting. A spectrometer (USB 4000, Ocean Optics Inc.) was used to obtain the spectrum of the emitted white light. In this experiment, the distances between the white LED lighting panel and the chromameter at the center of the detecting position (C2) were 1.0, 1.5 and 2.0 meters. Our experiments were performed by changing the average forward current in both modulation modes at each distance.
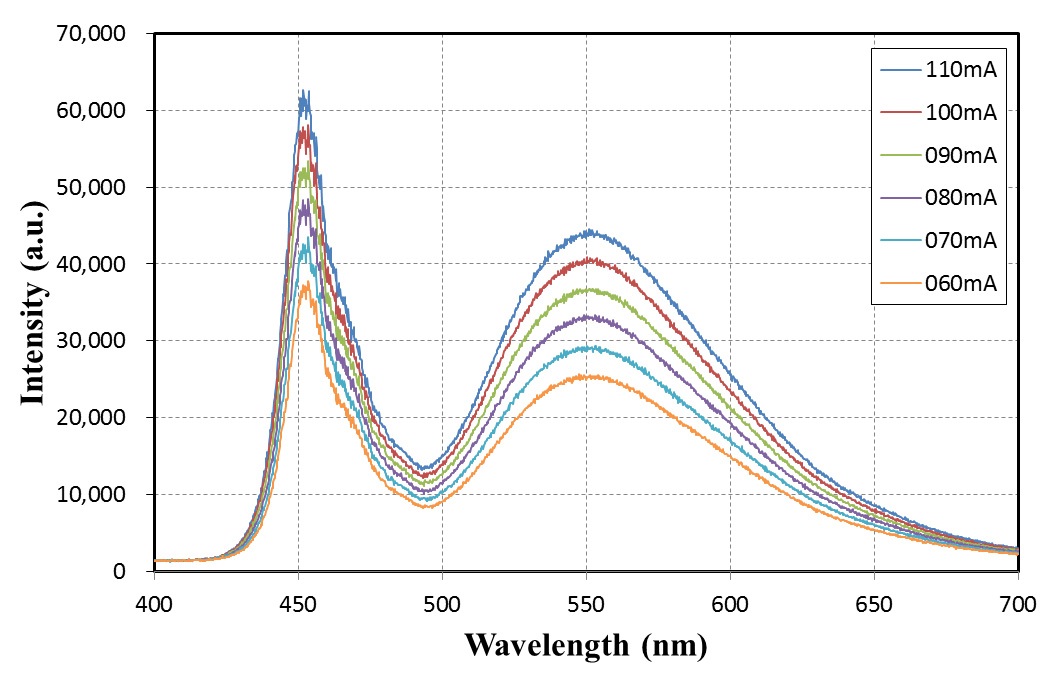
The spectrometer at a distance 1.0 m apart from the white LED lighting panel measured the spectrum of the emitted light by varying the forward current from 60 mA to 100 mA with 10 mA increments. Their results were shown in Fig. 4. The sharp blue peak (around 450 nm) from the blue light and the phosphor-converted broad yellow peak (around 550 nm) were observed in every spectrum.
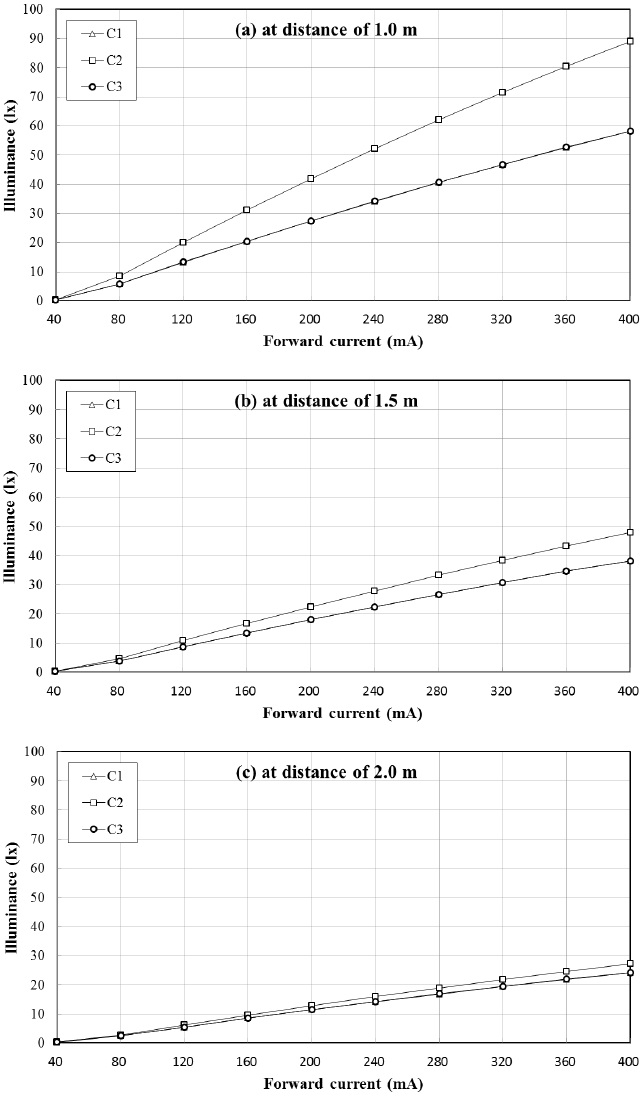
In illuminance measurement, a single LED channel was activated exclusively because the heat from neighboring channels could have a significant impact on LED operation. Spatial illuminance was measured using the three chroma-meters (C1, C2 and C3) at the three different distances: 1.0, 1.5, and 2.0 meters. The experimental results at each distance are shown in Figs. 5(a), (b) and (c). The illuminance was linearly dependent on the amount of the average forward current. In both Figs. 5(a) and (b), the measured illuminance at the center (C2) was relatively higher than those measured by the devices installed at the sides (C1 and C3). However, this difference due to the measuring device’s position was sufficiently reduced at the distance of 2 m.
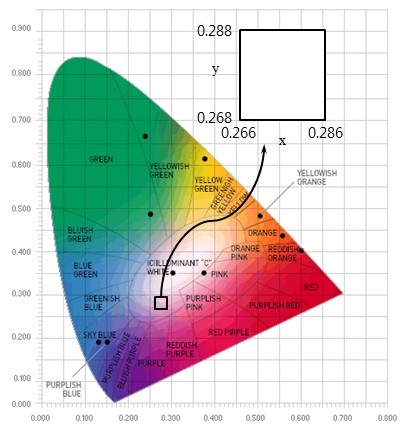
Figure 6 shows the CIE 1931 (x, y) chromaticity diagram. All the obtained data can fit in a small area, which is shown in the upper right corner of Fig. 6, ranging from 0.266 to 0.286 in x-chromaticity coordinate and from 0.268 to 0.288 in y-chromaticity coordinate.
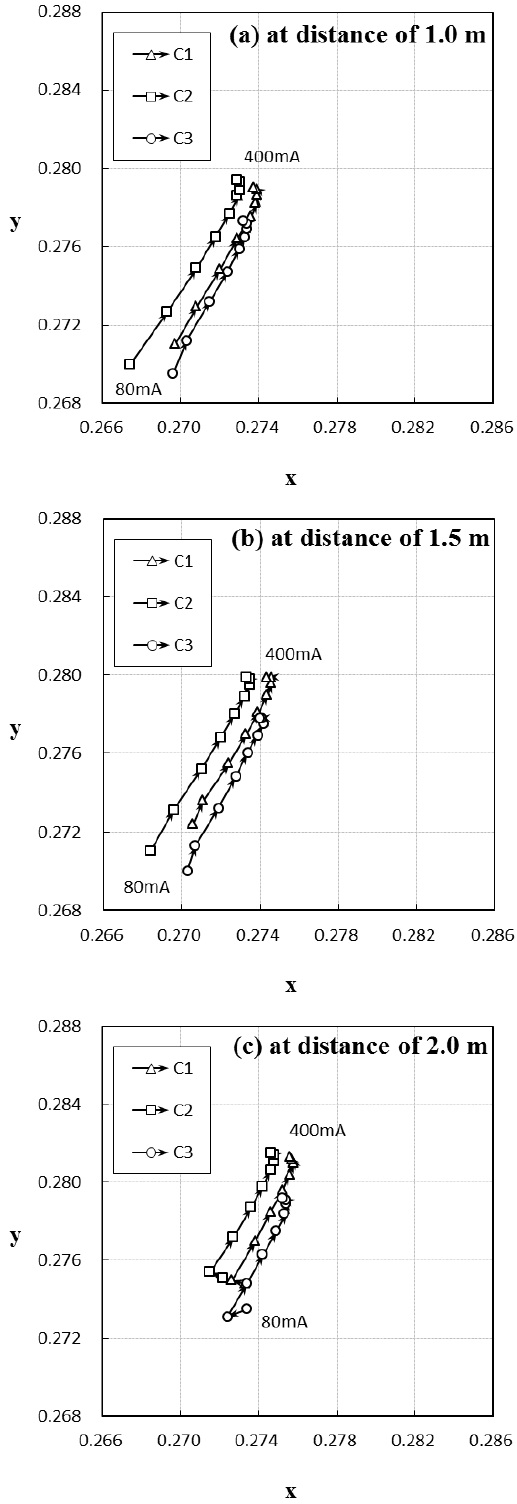
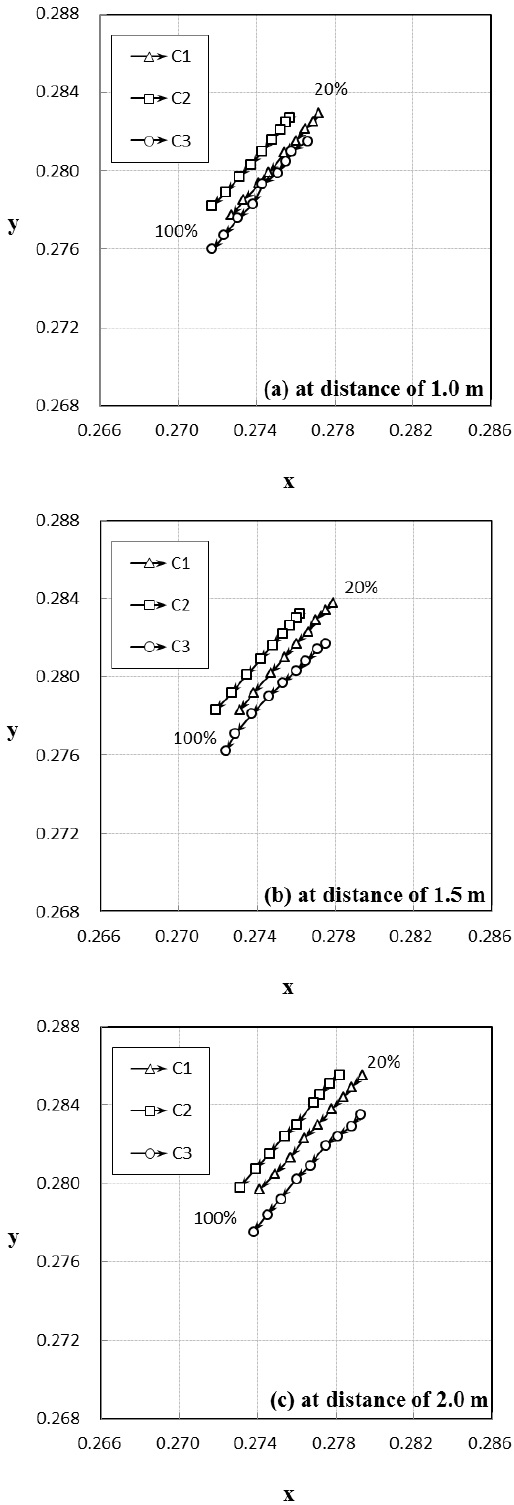
The color point variations in SCM were detected at three different distances (1.0, 1.5 and 2.0 m). Their results are
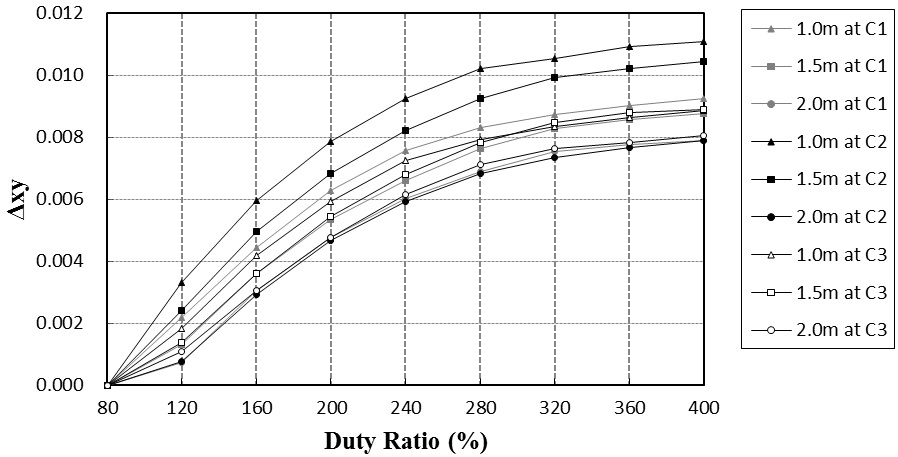
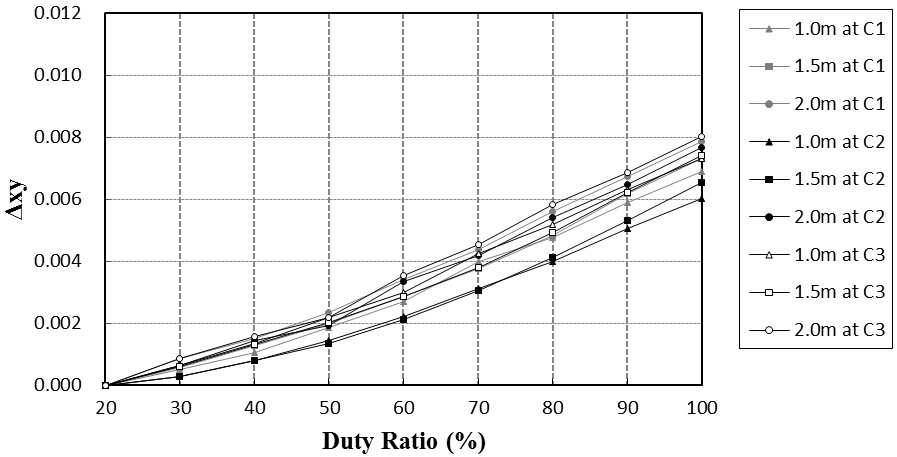
shown in Figs. 7(a), (b), and (c), respectively. The color points move toward upper right with increasing forward current. To compare the degree of color change numerically, a color distance (Δxy) in CIE 1931 was utilized as the same
method that Muthu

where (x1, y1) and (x2, y2) are color coordinates of two different color points. In experiments, these color coordinates, (x1, y1) and (x2, y2), were measured before and after a forward current increase, respectively. From the measured data, using Eq. 4, Δxy in each condition was calculated and shown in Fig. 8. As the forward current increased, Δxy increased gradually and then over the specific current level, the increase rate slowly decreased up to a saturation region. The maximum and minimum of Δxy in SCM were 0.01044 and 0.00788, respectively. For PWM, the amplitude and modulation frequency of the forward current were selected as 400 mA and 1 kHz, respectively. The color coordinate measurements were conducted by raising duty ratio from 20% to 100% in increments of 10%. The resulting color coordinate variations in PWM were shown in each sub-graph in Fig. 9. The color points move toward lower left with increasing duty ratio. The Δxy in PWM was also calculated at each distance and the results were shown in Fig. 10. The maximum and minimum of Δxy in PWM were 0.00802 and 0.00603, respectively. These values were relatively smaller than those in SCM. As compared to the case of SCM, the increase rate of Δxy in PWM was maintained almost as a constant. In comparison with both experimental results, it was found that the moving direction of the color points in PWM was opposite to that in SCM.
The locus of color coordinates of the white LED lighting composed of PC white LEDs was measured with increasing the average forward current supplied to the LEDs for the given average current range in SCM and PWM. Until the forward current started to increase from the initial value to
a specific value, the emitted light was too weak to be detected by the chromameters. When the applied forward current became slightly larger than the specific value, the emitted light became detectable. Even at this moment, however, the intensity of emitted light was very low, and a large
number of yellow phosphors didn’t absorb blue light, resulting in rich blue. Thus, initially emitted light’s initial color coordinates were placed at a certain point in a region close to blue color on the outer contour in the CIE 1931 chromaticity diagram as shown in Fig. 6. Subsequently, as the applied forward current in SCM increased more and more to the saturation value, which saturated the yellow-to-blue light conversion, the portion of yellow light to blue light also increased. Consequently, the color coordinates moved toward the yellow region, which means, in other words, yellow shift as shown in Fig. 7. If the forward current continued to increase over the saturation current level, the generation rate of yellow light by the phosphors was kept constant. However the amount of blue light increased further. Then, it is expected that the color coordinates turn their direction and then moved toward the blue region again on the CIE 1931 chromaticity diagram. On the other hand, in PWM, as duty ratio varied from 20% to 100%, the portion of blue light to yellow light during every period of the PWM signal, T (1 millisecond) increased gradually; resulting in blue shift of color coordinates. The duty ratio of 20%, for example, means that after blue LEDs are activated on 200 μsec, they are deactivated on the left 800 μsec. Blue light is generated from blue LEDs and yellow light is produced by the light conversion at phosphors simultaneously on the 200 μsec. On the next 800 μsec, the blue light is deactivated but the yellow light still survives longer than the blue light due to its long lifetime of phosphorescence. These sequences were repeated again at the intervals of 1 msec. Similarly, at the duty ratio of 90%, during 900 μsec, the mixture of blue light and converted yellow light is seen as white light, but only yellow light existed during the remaining 100 μsec of deactivation time. The blue-to-yellow conversion rate is kept as constant because every duty ratio has the same peak current (IPEAK) as 400 mA. Thus, from comparison of two cases, on unit time period (1 millisecond), the portion of blue light at the duty ratio of 90% is larger than that at the duty ratio of 10%, so that the white light at duty ratio of 90% is more bluish than that of 10%. In other words, blue shift occurs as duty ratio increases as shown in Fig. 9. These results are compared with previous studies [16-18] in
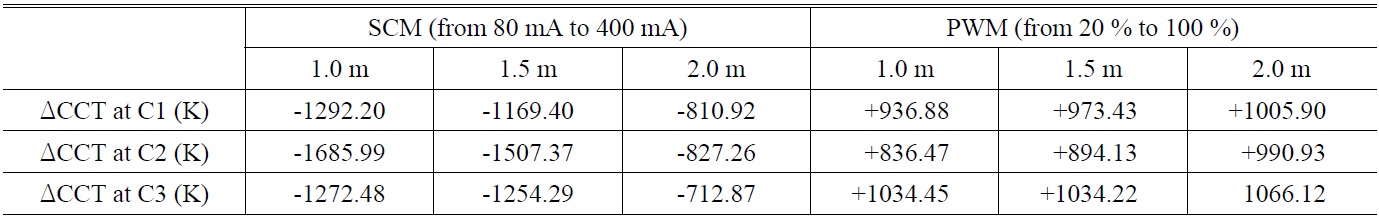
ΔCCT at C1 (left), C2 (Center), and C3 (right) in a distance of 1.0 m, 1.5 m and 2.0 m when dimming PC white LEDs by SCM with increasing forward current from 80 mA to 400 mA in 40 mA increments and when dimming them by PWM with increasing duty ratio from 20% to 100% in 10% increments at 1kHz modulation frequency
following several sentences. In Muthu’s reports [17,18], for the case of SCM for red, green, and blue LEDs (RGB-LEDs), a change in the amplitude of the drive current caused a shift in wavelength. As the driving current increased, the spectra moved toward shorter wavelength (blue shift). For the case of PWM, because the peak forward current value was always at the same value, the current did not affect the emitted wavelength. Their results were different from our results regarding PC white LEDs in that yellow shift in SCM and blue shift in PWM were observed. These results are expected to originate from the phosphorescence and lifetime of yellow phosphors, for example, trivalent cerium activated yttrium aluminum garnet phosphor [3]. In addition, Dyble
The Δxy in both current modulations was certainly different to each other. That of SCM was similar to a graph of square (or third) root of x, while that of PWM was to a linear graph. One of possible reasons was a difference in wavelength conversion efficiency of yellow phosphors. This blue-to-yellow conversion efficiency was strongly dependent on blue light intensity which was determined by the amount of forward current. In SCM, light intensity variation originated from the forward current change had a direct impact on power conversion efficiency as well as wavelength conversion efficiency. Thus, the color distance in SCM was determined by both efficiencies corresponding to each current level. Both efficiencies increased quasi-linearly around the initial point. The power conversion efficiency over a certain point still increased with direct proportion to current level but the wavelength conversion efficiency was gradually reduced and then saturated with increasing current level. This reduced increasing rate of the Δxy built up the trace shape like graph of square (or third) of x as shown in Fig. 8. However, in PWM, because the peak current (IPEAK) on activation time was fixed, the light intensity was kept as constant, resulting in the maintenance of wavelength conversion efficiency at phosphors. Accordingly, Δxy in PWM was analogous to a linear line with increasing duty ratio as shown in Fig. 10.
The following analytic equation, proposed by McCamy [19], was used for calculating the CCT of a light source with (x, y) coordinate in CIE 1931 chromaticity diagram:

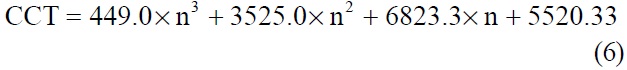
where xe = 0.3320, ye = 0.1858 From Eq. 5 and Eq. 6, the CCT of the white LED lighting was calculated. The difference in CCT (ΔCCT) for the current range from 80 mA to 400 mA in SCM and that for the duty ratio range from 20% to 100% in PWM were summarized in Table 1, respectively. The average difference of CCT for the selected current range was about 1170 K in SCM and about 975 K in PWM. Therefore, when dimming the white LED lighting composed of PC white LEDs, either SCM or PWM driving conditions could seriously affect the spectral response of the PC white LEDs, so that the color temperature difference value as much as 1000 K could be out of a desirable band. Consequently, great care must be taken to ensure that color temperature was maintained at the designed and authorized level to avoid serious accidents in industrial applications.
In this paper, we investigated the various effects of two well-known current modulations on the color coordinates and on the CCT of the white LED lighting composed of PC white LEDs. For these experiments, the white LED lighting and the current modulation circuit suitable for it were fabricated and developed. The spectrum was measured by the spectrometer. The illuminance and color coordinates were measured by three chromameters at each experimental condition. Especially, the variation of color coordinates exhibited yellow shift for SCM and blue shift for PWM for our illuminant with increasing average forward current. These results were remarkably distinguished from previous values for RGB-LEDs; blue shift for SCM and no spectral shift for PWM. In addition, they were also different from the Dyble’s study for PC white LEDs; yellow shift in SCM and blue shift in PWM with decreasing the average forward current. These phenomena were analyzed and explained with the help of blue-to-yellow light conversion efficiency of the yellow phosphors, their phosphorescent lifetime, and their concentration. The color distance for both modulation methods was also investigated through the trace shape analysis. In addition, CCT from the experimental data was obtained through simple calculations and the locus was also calculated at each condition. The change in CCT could be problematic for certain applications; especially, the large ΔCCT as much as about 1000 K could give rise to shrunk productivity or even serious industrial accidents when the white LED lighting was used as industrial illuminant. Therefore, the LED illumination system to use white LEDs should be carefully designed to achieve affordable color temperature variation limit, and the knowledge obtained from our experiments will have a great impact on many engineering applications using PC white LEDs.