A series of multiwavelength observations has been devoted for investigating Galactic supernova remnant (SNR) Kesteven 69 (Kes 69). Millimeter band observations of CO and HCO+ lines towards Kes 69 provided strong evidence for the association between Kes 69 and the molecular cloud (Zhou et al. 2009). An extended OH (1,720 MHz) emission region further indicates the presence of shocked molecular gas in Kes 69 (Hewitt et al. 2009). With HI observation, the kinematic distance for Kes 69 has been determined for a range from 5.5 kpc to 11.2 kpc (Tian & Leahy 2008).
In X-ray regime, it has an irregular morphology as observed by ROSAT, which shows correlation with an incomplete radio shell (Yusef-Zadeh et al. 2003). The analysis of the X-ray energy spectrum obtained by the ROSAT Position Sensitive Proportional Counter inferred a temperature and interstellar absorption of kT~1.6 keV and NH ~ 2.4 ×1022 cm-2. Because of the limited photon statistics and energy range provided by ROSAT, a more detailed analysis of the remnant emission was not allowed (Yusef- Zadeh et al. 2003). This has motivated a dedicated XMM-Newton observation of Kes 69 (Obs ID: 0605480101 PI: Miceli). For searching the evidence of fast ejecta propagating in a dense environment, a recent study has revealed 18 hard X-ray point sources in the field of Kes 69 with this XMM-Newton observation (Bocchino et al. 2012). Investigations of their source nature suggest these hard X-ray sources can possibly be fast ejecta fragments or cataclysmic variables (CVs). Through a detailed timing analysis of the bright source detected in this field, XGPS-I J183251-100106/2XMM J183251.4-100106, a periodic signal of ~1.5 hours has been discovered with the same XMM-Newton data (Hui et al. 2012a). It phase-averaged X-ray spectrum can be well modeled with a thermal bremsstrahlung temperature of kT ~ 50 keV. Both the X-ray spectral and temporal behavior of this system suggests that it is a nearby eclipsing magnetic CV (Hui et al. 2012a). This study has excluded any possible association between this bright source and the SNR.
While the aforementioned studies are focused on the point source population detected in the field of Kes 69, in this paper we report a detailed analysis of diffuse emission with XMM-Newton data and provide constraints on its dynamical properties. In Section 2, the details of this observation and the procedures of data reduction are described. The results and the physical inferences are given in Section 3.
Kes 69 was observed on 2009 October 8-9 with the European Photon Imaging Camera (EPIC) on board XMM-Newton which consists of two metal oxide semiconductor CCD detectors (MOS1 and MOS2) and a PN CCD detector The aim point is R.A. = 18:32:57.01, DEC = -10:05:41 (J2000). MOS1/2 and PN were operated at full frame mode (frame time = 2.6 s) and extended full frame mode (frame time = 199.1 ms) respectively. Medium filters were used to block optical stray light in all EPIC instruments. We used the tasks emproc and epproc of the XMM Science Analysis Software (XMMSAS version 11.0.0) for reprocessing all the EPIC data with the updated instrumental calibration. We selected events with the pattern in the range of 0-12 for both MOS cameras and 0?4 for the PN camera in 0.3?12 keV. We have taken the data by accepting only the good time intervals when the sky background was low for the whole camera (< 2.4 counts s?1, < 2.8 counts s?1, and < 5.7 counts s?1 for MOS1, MOS2, and PN, respectively). After removing all events
which were potentially contaminated by bad pixels, effective exposures were found to be 55.9 ks, 56.6 ks, and 41.3 ks for MOS1, MOS2, and PN, respectively.
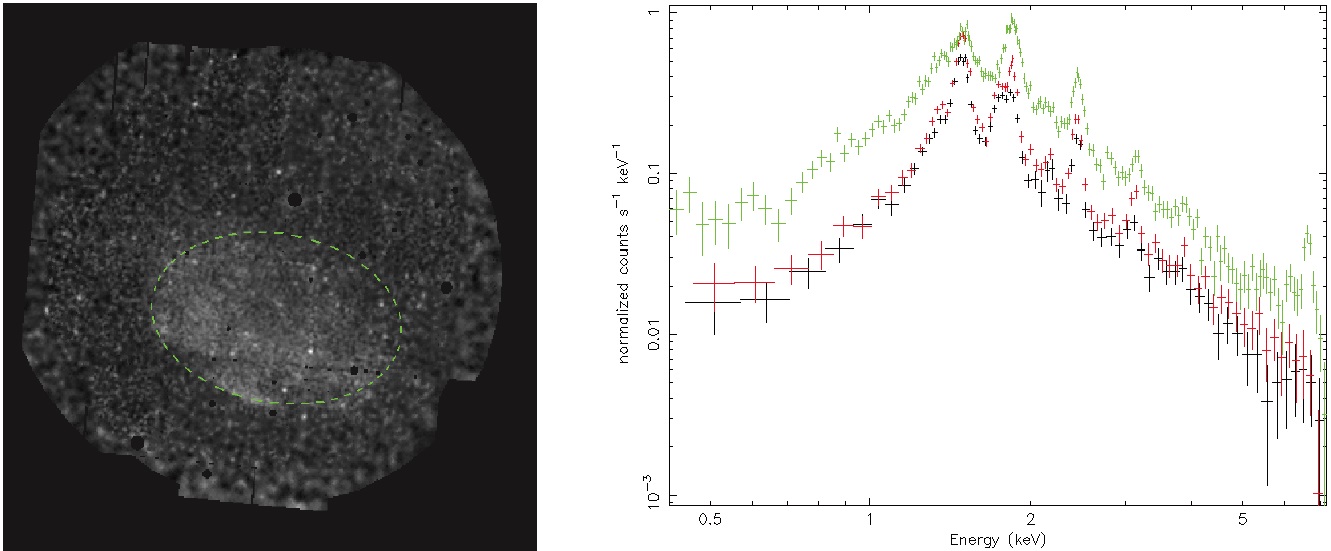
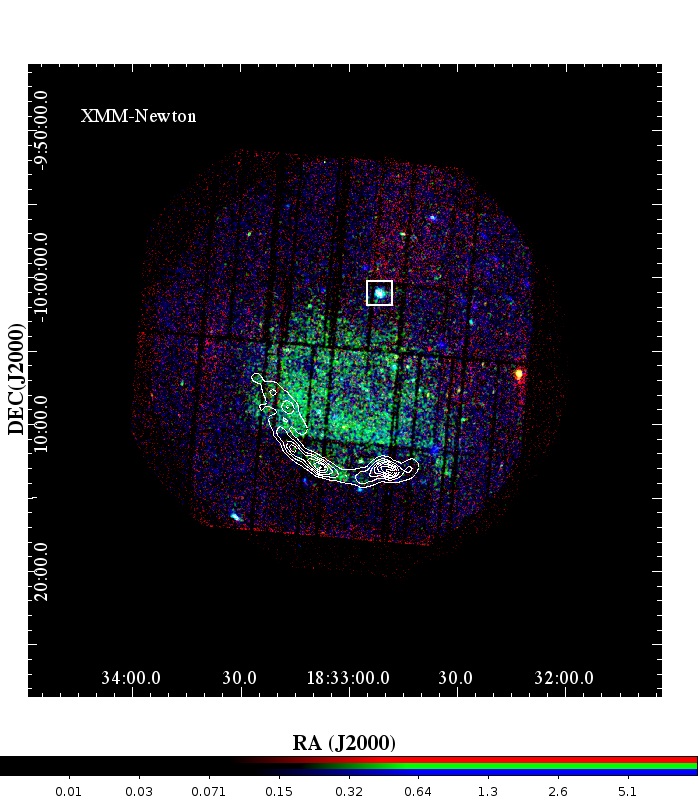
The X-ray color image of the field around Kes 69 is shown in Fig. 1. With source detection performed on all EPIC data in the energy range of 0.3-12 keV, we have revealed a population of point sources in this field. Since we concerned only diffuse emission from the SNR, all these resolved point sources were subsequently subtracted in accordance with the point spread function width at their off-axis angles and peak energies. In the left panel of Fig. 2, the adaptively smoothed “cheese” image after point source subtraction is shown. The energy spectra of the SNR were then extracted from individual camera within the elliptical region as illustrated in the left panel of Fig. 2. Response files were computed by using XMMSAS. The energy spectra as seen by individual camera are shown in the right panel of Fig. 2. In order to obtain a tight constraint on the emission properties, we fitted the data obtained from all three cameras simultaneously.
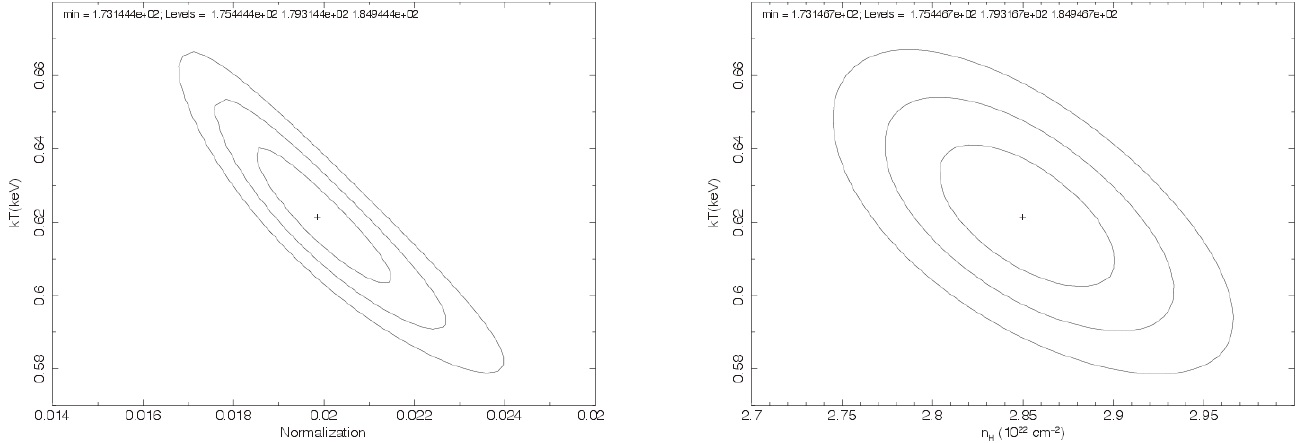
For the spectral fitting, we used XSPEC (version 12.6.0) with χ2 statistics. We followed the method described by Snowden & Kuntz (2011) for modeling the background. Assuming the SNR has already reached the condition for collisional ionization equilibrium (CIE), we fitted the observed spectrum with the XSPEC model VEQUIL. This yields a goodness-of-fit of χ2 = 173.1 for 184 degrees of freedom with the best-fitted column density, plasma temperature and the model normalization of NH~2.85 ×1022 cm-2, kT ~ 0.62 keV and ~0.02 cm-5. For properly constraining the spectral parameters, we have computed the confidence contours which are shown in Fig. 3.
Following Hui et al. (2012b), we discuss the properties of Kes 69. Assuming the shocked densities of hydrogen nH and electrons ne are uniform in the extraction region, the normalization of the CIE model can be approximated by 10?14nHneV/4πD2, where D is the distance to Kes 69 in cm and V is the volume of interest in units of cm3. In this analysis, we adopt a remnant distance of 5.5 kpc (cf. Tian & Leahy 2008). Assuming a fully ionized plasma with ~10% helium (ne ~ 1.2nH ) and Kes 69 is in a Sedov phase, the shock temperature can be estimated by Ts~8.1×10⁶E512/5nISM-1-2/5 t4?6/5K, where t4, E51, and nISM?1 are the time after the explosion in units of 104 years, the released kinetic energy in units of 1051 erg, and the ISM density in units of 0.1cm?3, respectively. Assuming it is a strong shock, nISM is estimated to be 0.25nH. With E51 = 1, the age of Kes 69 is estimated as ~ 2.5×10⁴ years.