The anchovy
Since the first preparation of frozen surimi, surimi has been used in the preparation of kamaboko and many kinds of value added seafood products. Making kamabo, mainly from muscle protein, raises many interesting issues from the perspective of protein chemistry (Suzuki, 1981).
Variation in the levels of nutrients in raw material is due to more than just processing. Some benefits of processing are the destruction of anti-nutritional factors, such as amylase and trypsin inhibitors and increased digestibility of starch and protein (Pigott and Tucker, 1990). Protein represents one of the most valuable components of our diet and should be protected during food processing. The maintenance of protein nutritive value is particularly important during the production of meat products because meat proteins are balanced, containing all essential amino acids. The nutritive value of meat proteins is determined not only by the quantitative and qualitative composition of the amino acids, but also by their availability to digestive tract proteolytic enzymes (Korczak et al., 2004). Important chemical reactions that decrease the nutritional value of seafood are lipid oxidation and nonenzymatic browning (Pigott and Tucker, 1990). Reduced digestibility and limitations as to the amount and the degree of amino acid availability are affected by the formation of amino acid bonds with lipid oxidation products. Fat oxidation products react first with functional groups of proteins and amino acids; oxidized lipid effects are a major cause of rancidity formation in food products, but oxidized lipids also interact with other food components and change nutritional value (Korczak et al., 2004).
An important and frequently observed effect in food processing is a reduction in protein nutritive quality. These changes may depend on denaturation of the proteins and reduced amino acid availability as a result of cross-linking, racemization, degradation and the formation of complexes with sugars and may result in loss of digestibility. Thus, when attempting to estimate protein quality, one of the first factors that must be evaluated is digestibility. Because the nutritional quality of a protein is related both to its amino acid content and the capacity of digestive enzymes to liberate them, methods using digestive enzymes have been attempted (Gauthier et al., 1982).
In this investigation, we sought to assess the possibility of using anchovy catches for kamaboko products and to study the food qualities of those products including an evaluation of protein quality. To compare the food qualities of anchovy kamaboko with commercial kamaboko from white muscle fishes, protein nutritional value, degree of lipid oxidation, textural properties, and color value were determined using fried kamaboko products from anchovy
In total, 80 kg of fresh anchovy samples were obtained as quick frozen blocks in Gijang Market, Busan South Korea, on January 19, 2012. Average sizes of whole anchovies were 14.3 ± 0.48 cm, in total length, 12.5 ± 0.44 cm in standard length, and 18.1 ± 2.28 g in weight.
Each frozen anchovy block was divided into individual quick frozen samples, and those samples were lightly thawed at room temperature for 5 min and then headed and gutted. Skin and backbone samples were removed to obtain the muscle. Minced meat was obtained from the muscle using a meat chopper (M-125 FUJEE; Hankook Fujee Industries Co. Ltd., Hwaseong, Korea). Then the samples were weighed and washed with cool water (5℃) in a 3:1 water/minced fish ratio. The minced fish was washed three times, the first wash with 0.5 NaHCO3 solution, and the last wash water had 0.3% NaCl, added; after each washing, excess water was removed by pressing.
Surimi was prepared by mixing 4% sucrose, 4% sorbitol and 0.3% polyphosphate and storage under freezing conditions (Maza Ramirez and Llave Perez, 2006).
Kamaboko base was prepared by mixing surimi (48.4%), salt (2.9%), sugar (1.7%), soybean oil (2.5%), monosodium glutamate (MSG; 1.0%), white egg (3.5%), mirin (2.0%), wheat flour (8.0%), and cool water (30.0%). Mixed kamaboko base was formed into thin slices of 5.50 ± 0.66 mm in thickness and fried in 180℃ boiling soybean oil for 3 min. Fried kamaboko was stored under freezing conditions (-24℃) in a vacuum, pack for 0, 15, 30, 45, and 60 days. Whole anchovy (raw material), ordinary muscle (minced), and surimi samples were also used to study the effects of frozen storage on food quality.
Proximate composition
The proximate compositions of the all samples were determined using the following Association of Official Analytical Chemist (AOAC, 1990) procedure. Moisture (%) samples were dried in a drying oven at 105℃ to constant weight. Crude fat (%) was determined using a Soxhlet solvent extractor. Crude protein (%) was determined by the semi-micro Kjeldahl method using 6.25 as a conversion factor after acid digestion. Crude ash (%) was determined by incineration in an electric muffle furnace (250℃ for 2 h and 570℃ for 1 h).
The percentage contents of protein, fat, and ash were determined in relation to the dry basis of the samples analyzed, dry basis being expressed in g × 100. The carbohydrate contents were calculated by the difference in proximate composition. All determinations were made in triplicate for each run.
Water activity measurements
Water activity measurements were taken for all the samples, using the water activity-measuring equipment (BT-RSI-7557 012; Rotronic, Grindelwald, Switzerland).
Fat oxidation
To measure fat oxidation, two tests were used with all samples to estimate the extent of oxidation.
Thiobarbituric acid value (TBA value). TBA values were determined by the method of Tarladgis et al. (1960). Absorbance was measured in an ultraviolet (UV) spectrophotometer at 538 nm and the TBA values were calculated by multiplying the sample absorbance by 100 and are expressed in mg/g solid.
Thiobarbituric acid reactive substances (TBARs). TBARS were determined by the method of Witte et al. (1970). Absorbance was measured using a UV spectrophotometer at 530 nm and the resulting colors in all the samples were calculated by multiplying the absorbance by 5.2 and are expressed in mg/g solid.
Protein quality determination
α-Chymotrypsin (38 units/mg solid; Sigma, St. Louis, MO, USA), trypsin (13,390 BAEE units/mg solid; Sigma), and protease (
Digestibility (%, three enzymes) = 234.84 - 22.56x,
where x is the pH of sample at 20 min.
Digestibility (%, four enzymes) = 1.03x (three enzymes digestibility) - 0.34.
Amino acid profile. Amino acid profiles were determined using the 6 N HCl hydrolysis method with an amino acid analyzer (S433; Sykum, Eresing, Germany). Tryptophan was determined using the 5 N NaOH alkaline hydrolysis method of Hugli and Moore (1972).
Trypsin inhibitor (TI) assay. TI concentrations in all samples were determined using the procedure of Ryu and Lee (1985), a modification of the Rhinehart (1975) method. Results of TI are expressed in TI equivalents which equal milligrams of purified soybean TI per gram of sample.
The correlation coefficient between pH and TI content was 1.000 and the equation for the calculation is:
y = 5.1335x - 35.339,
where y = purified soybean TI (mg) and x is the pH at 10 min incubation.
Computed
Starch digestibility
Texture analysis
Texture profile analysis was performed using a texture analyzer (TA-XT2i, Stable Microsystem, Godalming, England). Prior to testing, kamaboko samples were equilibrated to room temperature for 30 min and cut into 1.5 × 1.5 cm sections. The samples were compressed twice at 50% of initial height using a 2.0 cm diameter cylindrical probe, at a test speed 1.5 mm/s. The mechanical properties of hardness, fracturability, adhesiveness, springiness, cohesiveness, gumminess, resilience and chewiness were evaluated.
Color measurement
Spectral reflectance was determined using a portable colorimeter (Model JC801; Color Techno System Co. Ltd., Tokyo, Japan). The kamaboko samples without a fried surface were placed in a plastic Petri dish. The color measurement was repeated three times. L denotes lightness on a 0 to 100 scale from black to white; a* denotes (+) red or (-) green; and b* denotes (+) yellow or (-) blue.
Statistical analyses
Results were presented as averages and standard deviations for each sample in triplicate. Statistical analyses of data were performed using SAS software version 9.1.3 (SAS Inc., Cary, NC, USA). Tukey’s multiple range test was carried out with one-way analysis of variance (ANOVA) to determine the significance of mean (SD) differences among treatments. The significance level was set at
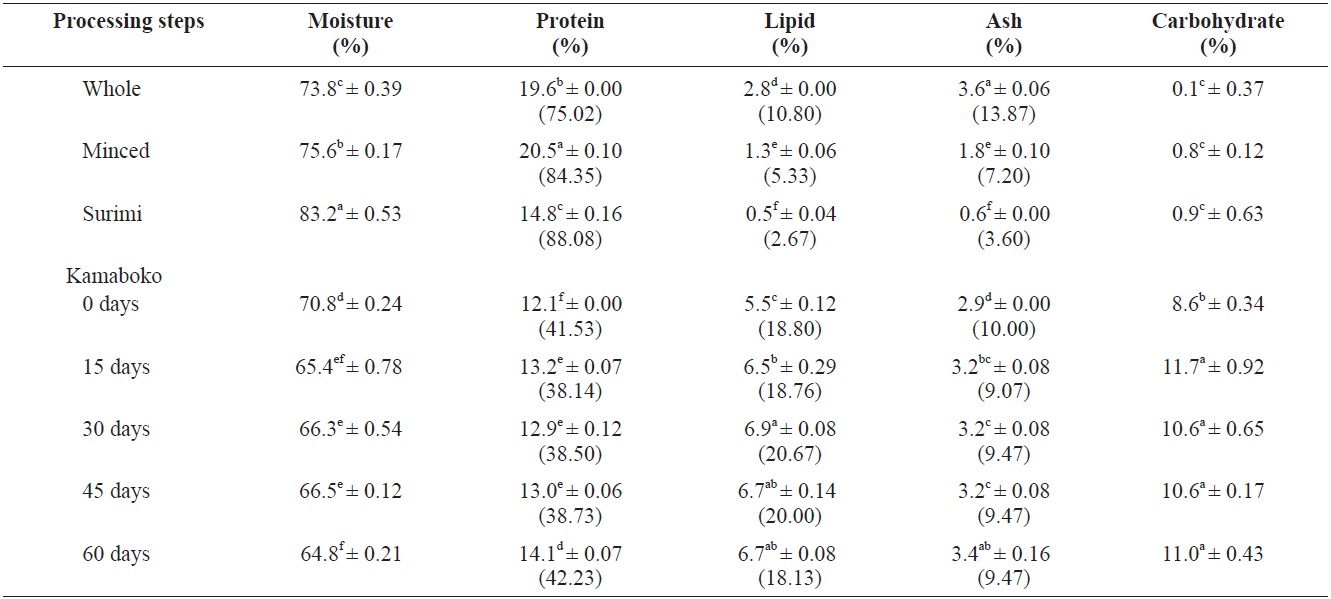
Among the samples analyzed, the proximate composition (Table 1) of raw anchovy, moisture and carbohydrates were relatively similar (73.8 ± 0.39% and 0.1 ± 0.37%, respectively) to those observed by the National Fisheries Research and Development Institute (NFRDI, 2009), 73.4% and 0.3%, respectively, and the food composition table of Rural Nutrition Institute (74.8% and 0.2%, respectively) (RDA, 1991).
The protein and ash contents of the muscle tissue of anchovy (19.6 ± 0.00% and 3.6 ± 0.06%) were slightly higher than the references cited above (NFRDI, 17.7% and RDA, 3.2%, respectively), but the lipid content (2.8 ± 0.00%) (NFRDI, 5%; RDA, 4.1%), was low probably due to the small size of the anchovies caught in the winter season. Huss (1995) reported that the chemical composition of different fish species shows variation, depending on season, migratory behavior, sexual maturation and feeding cycles. The variation in the percentage of fat is also reflected in the percentage of water because fat and water together normally constitute about 80 % of the fillet.
The percentage of protein and moisture increased slightly in minced (20.5 ± 0.10% and 75.6 ± 0.17%, respectively), while lipid (1.3 ± 0.06%) and ash (1.8 ± 0.10%) decreased significantly after removing the skin and bones. Less fat and an altered mineral composition were reported by Pigott and Tucker (1990), cited by Huss (1995) reported that normally the skin bears about 40% of the total fat in fish. The fat cells making up the lipid depots in fatty species are typically located in subcutaneous tissue.
Surimi showed lower protein (14.8 ± 0.16%), lipid (0.5 ± 0.04%), and ash (0.6 ± 0.06%) contents compared with minced due to the alkaline solution used for washing the minced fish. This washing changed the mineral composition, but the wash water quality and equipment type also affected the range and extent of these changes (Pigott and Tucker, 1990). Similar results (protein, 14.1; lipid, 0.5; ash, 0.7%) were observed by Maza Ramirez and Solari (2006) in anchovy refined surimi. Reduction in total ash increased protein quality and a more favorable mineral composition, and so generally, the nutritional quality was improved. Moisture content was highest (83.2 ± 0.53%), probably due to the traditional method of dewatering. Minced fish was wrapped in a tofu bag and squeezed manually. A similar value (83.13%) was observed in Alaskan pollock surimi (control sample) by Ryu et al. (1994a) during a study
[Table 1.] Proximate composition of raw anchovy, minced, surimi and kamaboko
Proximate composition of raw anchovy, minced, surimi and kamaboko
on the effects of cryoprotectants on protein quality in pollock surimi. The moisture content from the final screened product is reduced to 80-85% by pressing in a conventional screw press (Pigott and Tucker, 1990). Mixed ingredients and frying in hot oil resulted to lower moisture contents, from 64.8% to 70.8% in the kamaboko samples and they showed slightly decreased protein content (12.1% to 14.1 ± 0.07%). Commercial kamaboko showed moisture contents ranging from 54.27 ± 1.51% to 66.4 ± 0.35%; the protein content showed similar values to commercial kamaboko, which ranges from 11.2 ± 0.0% to 13.48 ± 0.0%. Pigott and Tucker (1990) reported that the lower protein content was not due so much to washing as to dilution by added carbohydrates. The lipids showed a higher level (5.5% to 6.9 ± 0.08%) than commercial kamaboko (2.8 ± 0.15% to 5.2 ± 0.26%). Oil absorption in fried foods may range from 10% to 40%, depending on the conditions of frying and the nature and size of the food (DeMan, 1999). The percentage of ash was higher (2.9% to 3.4 ± 0.16%) through the addition of some ingredients like salt compared with commercial kamaboko (2.0 ± 0.0% to 2.93 ± 0.23%). Carbohydrates (8.6% to 11.7 ± 0.92%), were increased in the kamaboko samples due to the added wheat flour, compared with commercial kamaboko ranging from 13.88 ± 0.0% to 28.26 ± 0.0%.
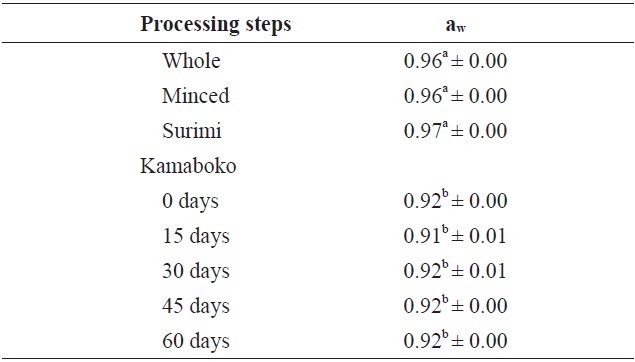
The results presented in the Table 2 showed significant differences between the raw samples and fried samples. Water activity values were higher in the raw samples (0.96) and highest in the surimi (0.97), rather than the kamaboko samples (0.91-0.92) during frozen storage time.
The aw in commercial kamaboko samples ranged from 0.92 to 0.96. Usually, the range aw 0.90-1.0 is classified as water-rich food (Pigott and Tucker, 1990) and is considered to indicate susceptibility to bacterial growth.
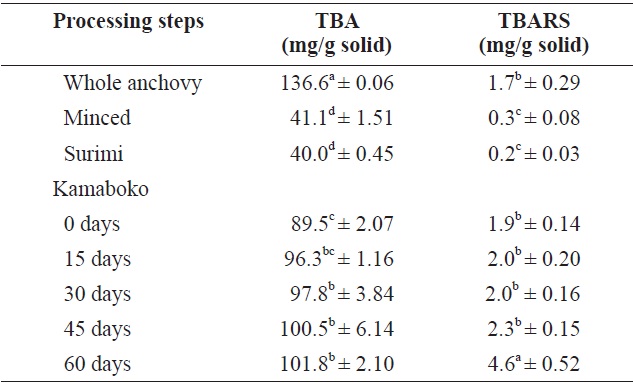
TBA values and TBARS are indicators of lipid oxidation or rancidity; the results in Table 3 show the degree of fat oxidation for these two assays. TBA values were relatively high in raw anchovy (136.6 ± 0.06 mg/g solid) because the anchovy is a fatty species. A lower value was seen in minced fish (41.1 ± 1.51 mg/g solid) without skin, head, viscera, or bones, and
Changes in water activity of raw anchovy, minced, surimi and kamaboko in frozen storage (-20℃)
[Table 3.] TBA value and TBARs of raw anchovy, minced, surimi and kamaboko in frozen storage at -20℃

TBA value and TBARs of raw anchovy, minced, surimi and kamaboko in frozen storage at -20℃
surimi showed the lowest value (40.0 ± 0.45 mg/g solid), probably because washing effectively removed oil from the minced fish. Washing removed about 37% of the solids, which included blood, pigments, fats, and soluble protein (Pigott and Tucker, 1990). Chen et al. (1997) observed in horse mackerel that the oil content of unwashed mince was 2.24% and decreased with washing time. The oil elimination efficiency reached 95%.
TBA values increased significantly after frying the kamaboko and increased progressively with storage time (89.5 ± 2.07-101.8 ± 2.10 mg/g solid) compared with commercial kamaboko samples (24.8 ± 0.34-45.6 ± 0.22 mg/g solid) due to different deep frying conditions. When the food is heated by immersion in hot oil (160-195℃) as practiced in commercial frying, for a short time (2 min), the oil is not in contact with air, eliminating the possibility of oxidation and thermal alteration. In continuous industrial frying, oil is constantly being removed from the fryer with the fried food and replenished with fresh oil so that the quality of the oil remains satisfactory. This is more difficult to achieve in intermittent frying operations (DeMan, 1999).
The TBARS confirmed the results of the TBA values, showing a similar trend (Table 3). The fried samples showed a slightly higher level (1.9-2.3 mg/g solid) than the raw samples (1.7 mg/g solid). A similar trend was observed by Oduro et al. (2011) in fried mackerel samples. A significant increase in TBARS values was observed at 60 days of storage (4.6 ± 0.52 mg/g solid). Studies on commercial kamaboko storage over 50 days showed the same trend (0, 10, 20, 30, 40, and 50 days: 1.93 ± 0.03, 2.06 ± 0.0, 2.08 ± 0.2, 2.41 ± 0.41. 3.97 ± 0.36 and 4.38 ± 0.47 mg/g solid, respectively). The increased rancidity, indicated by the TBA index is due chiefly to the formation of malonaldehyde by hydroperoxides from fatty acids containing three or more double bonds (Marti de Castro et al., 1997).
Changes in fat oxidation determinants, TBA value and TBARS indicate a considerable increase in fat oxidation degree in the fried kamaboko products during storage under frozen conditions. Freezing slows enzymatic activity and inhibits microorganism growth, but cannot top lipid oxidation. Long-term storage will release free fatty acids from lipid/protein reactions, which will form oxidized products and cause denatured protein, which toughens. The nutritional value of proteins is lowered by reactions with peroxides, which also destroy pigments, bleach foods, produce toxins and or carcinogens, and cause off-flavors and odors. Vacuum packaging reduces autooxidation significantly (Pigott and Tucker, 1990).
Amino acid profile
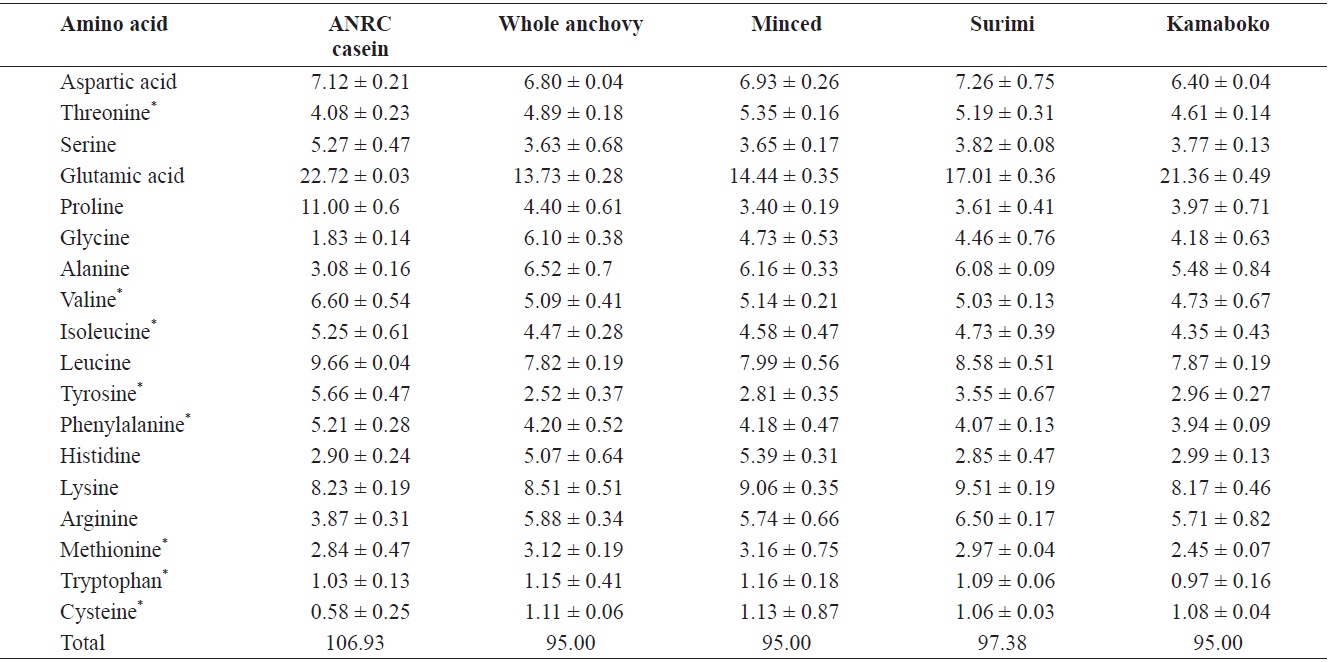
The raw anchovy amino acid profile is similar to that reported by the NFRDI (2009). Glutamic acid had the highest concentration in all kamaboko samples (Table 4). This high concentration may also be attributable to added MSG in kamaboko products. The histidine level decreased gradually, through dissolution and removal during washing in surimi processing.
Cysteine and tryptophan showed the lowest values in all samples. Decreased amino acid availability is the major and most serious reason for nutritive loss associated with nonenzymatic browning. Lysine is the most readily damaged essential amino acid (EAA) and becomes biologically unavailable. The loss of sulfur-containing amino acids in meat and fish can be substantial. Effects of feeding heat-damaged protein include lowered protein efficiency ratios because essential amino acids become biounavailable. Many compounds formed during the frying and barbecuing meats and fish are products of the Maillard reaction (Pigott and Tucker, 1990).
Protein digestibility
Three enzymes were used to determine the
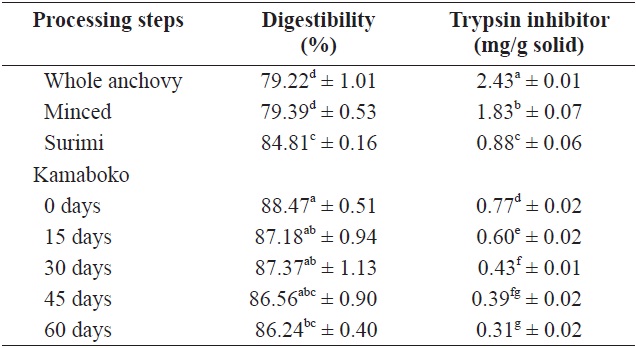
Table 5 shows the
Whole and minced anchovy had almost the same values (79.2 ± 1.01 and 79.4 ± 0.53%, respectively). Similar results (78.50%) were observed by Lee et al. (1984) and Lee and Ryu
[Table 4.] Amino acid profiles of raw anchovy, minced, surimi and kamaboko
Amino acid profiles of raw anchovy, minced, surimi and kamaboko
(1986) during the processing and storage of boiled and dried anchovy, and in the evaluation of seafood protein quality as predicted by C-PER assays, for the same species in raw samples. An increase occurred in the degree of digestibility of the surimi (84.8 ± 0.16) and kamaboko samples compared with the raw samples, but the protein digestibility of kamaboko was decreased slightly during frozen storage time. The value of digestibility at 0 days (88.5 ± 0.51%) was similar to that reported for marketed steamed kamaboko and crab meat analog (86.4-88.2%) by Ryu et al. (1994b). Protein digestibility in fried commercial kamaboko ranged from 80.9% to 91.9%. Mauron (1984), as cited by El and Kavas (1996) reported that protein digestibility was reduced as a result of complex chemical (cross-linking) reactions, such as protein interactions or protein fat interactions when food was broiled at high temperatures.
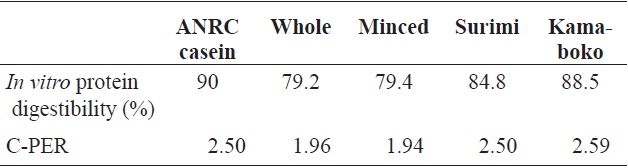
In vitro protein quality
The percentage of protein digestibility and C-PER of the kamaboko samples are shown in Table 6. The C-PER assay is an
Trypsin inhibitors
Table 5 shows the changes in TI in anchovy kamaboko during frozen storage (-20℃ over 60 days). The amount of TI was highest in raw anchovy (2.43 ± 0.01 mg/g solid). In minced and surimi, the TI value decreased, probably due to lipid extraction (1.83 ± 0.07 and 0.88 ± 0.06 mg/g solid, respectively). Lee and Ryu (1986) reported that in several instances, the boiling and salting processes were thought to have resulted in

In vitro protein digestibility and level of trypsin inhibitor of raw anchovy, minced, surimi and kamaboko
[Table 6.] In vitro protein qualities of raw anchovy, minced, surimi and kamaboko

In vitro protein qualities of raw anchovy, minced, surimi and kamaboko
[Table 7.] In vitro starch digestibility of raw anchovy, minced, surimi and kamaboko
In vitro starch digestibility of raw anchovy, minced, surimi and kamaboko
lipid extraction, which diminished the formation of enzymeindigestible substrate. In the kamaboko samples, TI decreased gradually during storage time (0.77 to 0.31 mg/g solid) (Table 5), probably due to oxidation, as confirmed by the high TBA values and TBARS. A similar trend was observed by Oduro et al. (2011) in fried, grilled, and steamed mackerel. TI includes typical proteinaceous inhibitory materials contained in raw sources and indigestible materials such as trypsin indigestible substrates induced from the result of interactions between proteins and other components such as lipid oxidation products (Oduro et al., 2011).
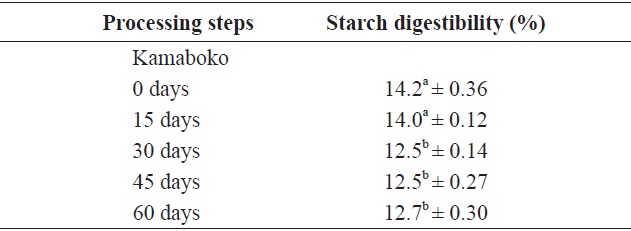
Table 7 shows the values and changes in IVSD of kamaboko samples during storage (-20℃). The degree starch digestibility decreased lightly with storage time, from 14.2% to 12.5%, probably due to lipid oxidation.
Values for commercial kamaboko ranged from 15.4% to 17.5 %. Measurement of different starch fractions provides a means of predicting the rate and extent of digestion in the human small intestine. Cooking increases the susceptibility of starches to hydrolysis; wide variation in the level of starch modification exists, depending on the processing intensity and storage conditions. The most important parameters are the water content and the maximum temperature reached. Heat increases nutrient availability. Processing may also reduce the nutritional value, as a result of losses and changes in major nutrients (Ahmed and Urooj, 2008).
Table 8 shows that the hardness, springiness, gumminess, and chewiness of fresh anchovy kamaboko (FAK) had non-significant differences compared with commercial kamaboko (CK), but showed significant differences with frozen and thawed kamaboko (FTAK), which showed higher values for all of these textural properties, probably because frozen storage caused structural damage to the texture. Marti de Castro et al. (1997) observed that the compression parameters (hardness, elasticity, and cohesiveness) of the frozen product were influenced mainly by freezing temperature. FAK and FTAK showed similar fracturability and adhesiveness, and difference with CK, which showed low values for fracturability. FTAK and CK showed non-significant difference in cohesiveness and resilience and significant difference in FAK, which showed the lowest values for both rheological parameters. According to Lanier (1986), as cited by Marti de Castro et al. (1997), and Gomez-Guillon and Montero (1996) cohesiveness is the most sensitive parameter for evaluating the state of surimi proteins.
Moreover, cohesiveness and hardness can vary independently (Gomez-Guillon and Montero, 1996). According to Uresti et al. (2004), cohesiveness and chewiness show similar behaviors to hardness.
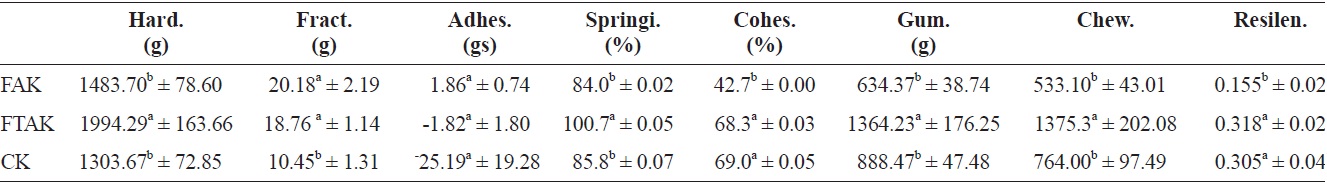
Texture properties for fresh fried, frozen and thawed anchovy kamaboko and commercial kamaboko
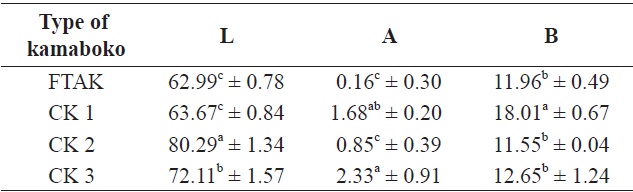
The lightness (L) value for anchovy kamaboko was lower than that of commercial kamaboko samples (Table 9). Nonsignificant differences with CK1 in lightness were noted, probably because this type of kamaboko contained vegetables, but significant differences were observed compared with samples CK2 and CK3 (without vegetables).
The lower redness (a) value for anchovy kamaboko showed a significant difference compared with all commercial kamaboko samples, probably due the natural dark color of surimi, because anchovy is a relatively dark-fleshed fish. The heme pigments are much less readily extracted from dark fleshed species because the dark muscle structure is tougher and more rigid than white muscle (Hsu and Chiang, 2002) because myoglobin contributes to the color of the muscle (Chen et al., 1997). The increase in lightness (L) and decrease in redness (a) of washed mince are related to increased transparency as well as loss of myoglobin. The color remaining after washing was the result of insoluble pigments. Structures such as mitochondria, which contain cytochromes, would not be removed from intact muscle fragments by washing with water (Chen et al., 1997). Also, the amount of fat in the kamaboko product and unsaturated fatty acids may influence lipid oxidation, which decreases the redness.
Nonsignificant differences in yellowness (b) value were
[Table 9.] Color value for frozen anchovy kamaboko and different types of commercial kamaboko

Color value for frozen anchovy kamaboko and different types of commercial kamaboko
observed between anchovy kamaboko and some commercial kamaboko (CK2 and CK3) samples, but a significant difference was observed with CK1, which showed the highest value of the samples.
Decreases in lightness and increases in redness and yellowness were observed by Koo et al. (2001), Ha et al. (2001), Son et al. (2003), and Kim et al. (2003) due to the addition of increasing percentages of mushroom in the fish paste. Bae and Lee (2007) observed that increasing the amount of small and large sized anchovy powder resulted in decreases in redness and increases in yellowness. Hsu and Chiang (2002) observed that the yellowness decreased with increasing moisture content, which meant that the higher the moisture content, the whiter and the yellower the color. They reported that the increase in the lightness was not species dependent, while the decrease in the yellowness tended to be species dependent. The addition of protein additives to improve the textural properties of dark-fleshed fish species could further worsen their color properties; for example, the use of whey protein, beef plasma protein and soybean protein could increase the yellowness of the final product (Park, 1994). Color and texture properties are important sensory attributes affecting the market acceptance of surimi products. Generally, gels with high lightness, low yellowness and high whiteness are demanded by consumers (Hsu and Chiang, 2002).