South Korea is a densely populated country with over 48 million people living in less than 100,000 km2. Until the late 1980s, rapid industrialization was the cause for serious damage to South Korea’s natural environment. However, since then environmental conditions have been improving due to the restoration programs. From 2006, over 85 % of the domestic wastewater generated nationally was collected and treated in public sewers [1]. Four major rivers flow across the southern part of the Korean peninsula: the Han, Nakdong, Geum, and Yeongsan. Recently, their overall water quality has improved recently. The level of biochemical oxygen demand (BOD) in the main stream of the Han River is between 0.3 and 2.3 mg/L. The BOD levels in the main streams of Nakdong, Geum, and Yeongsan rivers are in the ranges of 0.8-3.4 mg/L, 0.3-4.0 mg/L, and 0.3-3.5 mg/L, respectively. However, the water quality of many streams and reservoirs is often below the established standards (National Environmental Policy Act of Korea), and periodic algal blooms in most of the reservoirs imply that further efforts are still required [2]. According to Vollenweider’s criterion, 8% and 38% of regularly monitored reservoirs are classified as eutrophic and meso-eutrophic, respectively [3].
It is well known that water quality improvement cannot be achieved without proper control of nonpoint source (NPS) pollution. This in turn is closely related to the land use and rainfall events. The term ‘point source (PS)’ as defined in the Clean Water Act implies any discernable, confined and discrete conveyance, including but not limited to pipes, ditches, channels, tunnels, conduits, wells, discrete fissures, containers, concentrated animal feeding operations, vessels and other floating craft from which pollutants may or may not be discharged. NPS are simply ‘everything else’ and they include diffuse, difficult to identify, or intermittent sources of pollutants. They are usually associated with land use [4].
The contribution of NPS to total loading for the four major rivers is about 42-69% and this depends on the river basin characteristics [5]. Further water quality improvements may not be achievable without the proper control of NPS pollution. The ‘Special Act on Watershed Management for Four Major Rivers,’ enacted in 1998, includes a number of programs that aim to improve, maintain or restore the water quality in national water systems. These programs include discharge limits, permits for point sources, funding for wastewater treatment facilities and a total daily maximum load (TMDL). They also control the overall pollution which includes both PS and NPS.
The accurate estimation of pollutant loads from watersheds is important for the effective application of the TMDL program. Currently, the unit load method is used for the estimation of pollutant loads from watersheds. It is a simple function that expresses pollutant generation over space and time for each land use (mass per unit area and time). Annual loads are calculated by multiplying the unit loads by the areas of uniform land uses and then, by summing the loads from different land uses. The true loads are highly site-specific and they are dependent on demographic, geographic and hydrologic factors. Agricultural areas are the most problematic as a small number of storms are usually responsible for the annual load and meteorological factors are highly variable from year to year. There have been attempts to collect field runoff data from major rivers on the watershed scale in order to support the unit load method for TMDL. These data can be useful for the estimation of the total pollutant load in the watershed-scale. However, it has a limitation in the quantification of unit load of an individual land uses as several land uses contribute to the sampling point and they are hard to segregate [2]. The TMDL program will face significant challenges if reliable unit loads for an individual land uses were unavailable. Therefore, field monitoring data from individual land uses are required in combination with the watershed-scale data.
Land use has a direct impact on hydrologic systems within watersheds [6-11]. The land use determines which anthropogenic substance enters a hydrologic system through drainage or runoff. Water quality parameters in various aquatic systems have been closely linked to the proportions of the different land uses within the watersheds [8, 11]. The relationship between land use and water quality in watersheds has been well documented [6-12]. Previous studies have found out strong links between the
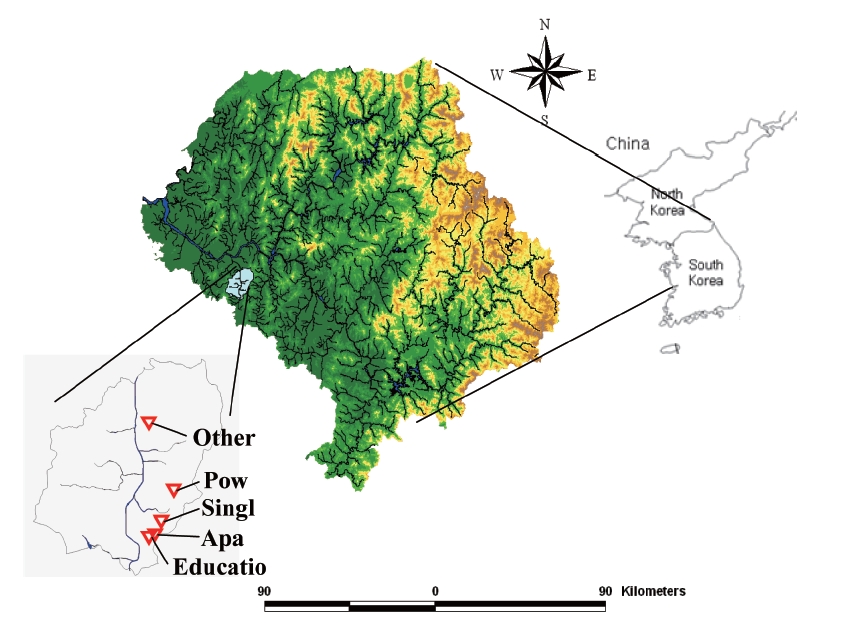
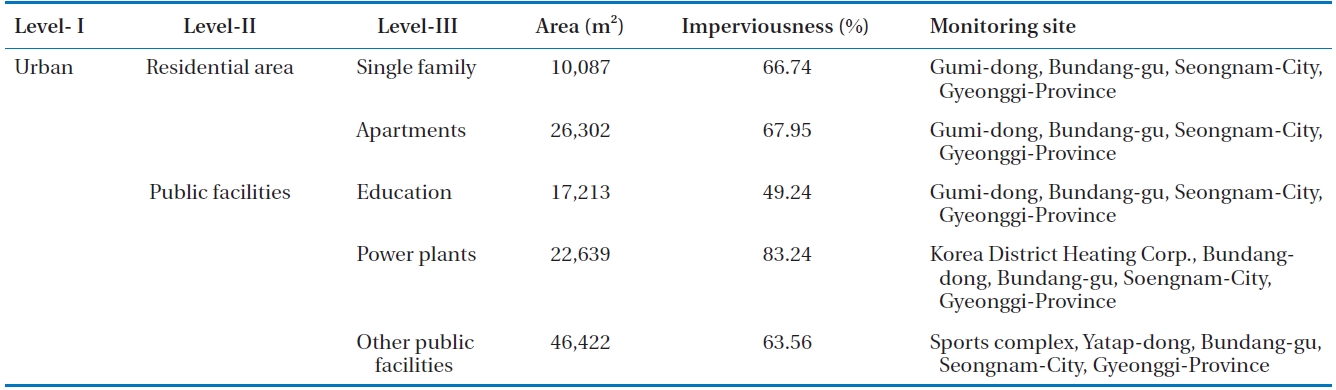
[Table 1.] Location of monitoring sites and their characteristics

Location of monitoring sites and their characteristics
land use and the quality of the receiving water in watersheds. This is not surprising considering that surface runoff and drainage systems carry land residues directly into stream systems. Numerous studies have reported that urban and agricultural lands play primary roles in the degradation of the water quality in the adjacent aquatic systems, by altering the soil surface conditions, increasing impervious areas, and generating pollution [8, 11]. Here, the nationwide long-term NPS monitoring of an individual land uses in Korea is described. Five Level-III land uses (single family, apartments, education facilities, power plants, other public facilities) in the Han River basin are particularly covered in detail.
A total of five monitoring sites were selected from the Level- III land use groups in Bundang-gu, Gyeonggi provinces as shown in Table 1 and Fig. 1. These sites included residential areas (single family, apartments) and public facilities (education facilities, power plants, and other public facilities-a sports complex). Monitoring sites were selected to allow the collection of runoff data from homogeneous land use regions where storm water was to be drained into a separate sewer system. These sites needed to have sizable catchment areas and represent particular land usage. Moreover, it needs to be favorable for collection of monitoring data where usually rain gauge, flow monitoring device and quality monitoring device should be installed and well maintained. Several site locations were initially reviewed based on the maps of the area and construction drawings of rainfall. This was also followed by field investigations to assess the most promising candidates.
The selected site of a single family includes 16 detached houses and it is located at the foot of a mountain. The area is 10,087 m2 and total dwellers are 405 people. This site has an uphill slope (about 10%) due to topographic characteristics. Each detached houses have some pervious area which includes a small garden and the portion of impervious area in this site is 66.74%. The selected site of apartments (apartment complex) includes a total of 6 apartment buildings (over 25 floors), a grocery store, parking lots, roads and a children’s playground. The area is 26,302 m2 and total dwellers are 2,230 people. As this site is a densely populated area, pedestrians and vehicular traffic is much when compared to a single family site. This site has some pervious area which includes a flower bed and a playground. Moreover, the portion of impervious area is 67.95%. The selected site of education facility is an elementary school. It consists of a school building and playground. Total area is 17,213 m2 and the portion of impervious area is 49.24%. This school has 1,018 students in a total of 29 classes. The selected site of power plants is located at the foot of a mountain but the site slope is little as good as flat. The total area of this site is 22,639 m2. This site has the highest imperviousness (83.24%) among all the monitoring sites. It consists of plants, tennis and basketball courts, roads, a parking lot and small flower beds. There are no office buildings. The selected site of other public facilities is sports complex (stadium) and has a soccer stadium, baseball stadium, track, road and some subsidiary facilities. Total area of this site is 46,422 m2. And the portion of the impervious area is 63.56% but the pervious area includes a sports stadium (ground) and it is constructed above a concrete base. And infiltrated water is drained through perforated drainpipe. Therefore, this site does not have a natural and general pervious land.
Monitoring devices (ISCO 6712 auto-sampler; ISCO 750 flowmeter; Delta OHM rain-gauge) were completely equipped at the drainage points of the monitoring sites. Stormwater runoff was then, monitored 23-24 times according to the site-specific conditions. The rainfall, flow and water quality (TSS: total suspended solids, BOD5: 5-day biochemical oxygen demand, TOC: total organic carbon, CODCr: chromium chemical oxygen demand, TN: total nitrogen, TP: total phosphorus) were measured. Water samples were collected automatically for more than 10 times per event. Water samples within 1 hour after storm water runoff began were collected in 5-15 minute intervals. The sampling time intervals were then, chosen based on the rainfall land runoff conditions.
2.3. Estimation of Event Mean Concentrations and Unit Loads
Event mean concentration (EMC) of each pollutant was estimated by using the following formula.
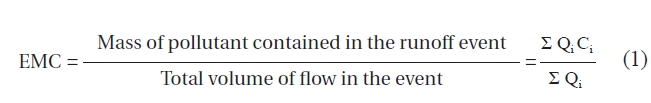
Where, Qi presents the discrete flow coordinates on the event hydrograph and Ci denotes the corresponding discrete concentrations on the pollutograph. It should be pointed out that instead of measuring the discrete flows and concentrations throughout an event the EMC is represented by the concentration of a flowweighted composite sample of the runoff event [13].
Event area load (event load per area, kg/ha) was the excepted concept for unit time and only unit area (ha) was considered. Therefore, event area load in this study implies total load per unit area by whole rainfall event and it was estimated as follows:

Unit load can be defined as the mass of the pollutant of interest per area of watershed per unit of time [14]. Unit load in this study was estimated by using the following formula [15].

Where, Py is the total annual precipitation of rank (class) y, and Ry is the average runoff ratio (coefficient of runoff) of precipitation rank y, and EMCy is the average EMC of rank y.
3.1. Analysis of Rainfall Events
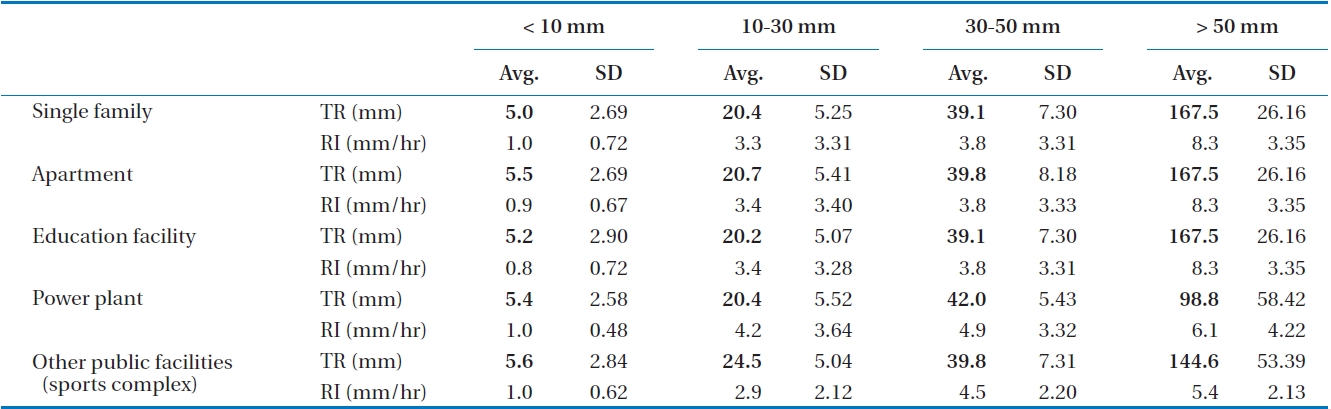
Table 2 shows the characteristics of rainfall events during each monitoring period. The total rainfall and rainfall intensity were analyzed by using data from rain gauges at the monitoring sites. Recently, local differences in the Korean weather have increased and this trend is also apparent in rainfall characteristics.
3.2. Correlation among Pollutants
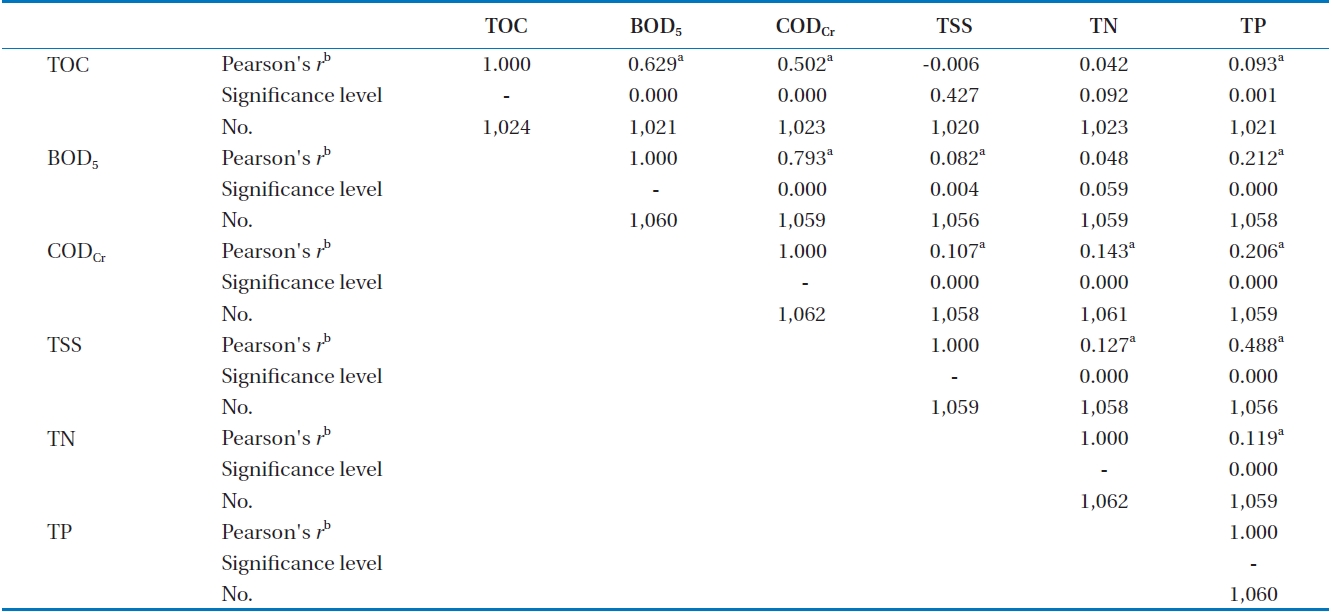
The representative pollutant was selected by correlation among water-quality parameters by using SPSS ver. 12 (SPSS Inc., Chicago, IL, USA). For efficient first flushing effect analysis using the same significant index, the correlation was performed in order to test the relationships among the variables. Table 3 shows Pearson’s correlation coefficients among the concentrations of various pollutants. These results indicate that the correlation of CODCr was the most significant.
3.3. Analysis of First Flush Effect
In urban areas, flow and water quality are very sensitive to rainfall as there are many impervious areas. Generally, in urban areas the NPS pollutants are discharged intensively in the early
[Table 2.] Characteristics of the rainfall events during monitoring period

Characteristics of the rainfall events during monitoring period
[Table 3.] Pearson’s correlation coefficients among the concentrations of various pollutants

Pearson’s correlation coefficients among the concentrations of various pollutants
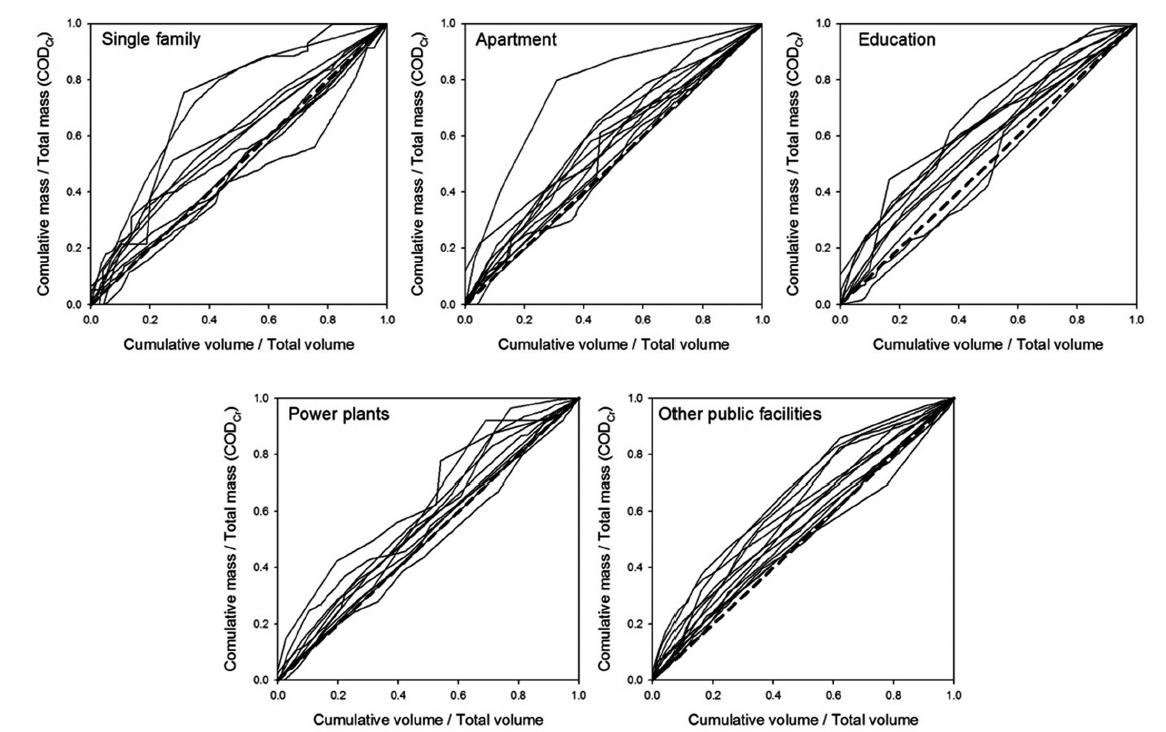
stages of rainfall. Therefore, the maximum discharge of pollutants occurs before the peak flow [4, 16-20]. Many researchers tried to characterize and define the first flush, the first portion of the flow, which contains most of the pollution. As a rule of the thumb it was stated that the first 40% of urban runoff may contain 60% of the pollution load [13]. However, such rules do not apply to agricultural and similar runoff events. However, the nationwide urban runoff program (NURP) study [21, 22] and others have found out that there is no consistent first-flush effect in discharges from separate storm sewers. In this study, the first flush effect was analyzed by using a cumulative pollutant load ratio. If the slope of the graph of the cumulative pollutant load ratio (L(t)/Σ L(t)) vs. the cumulative flow volume ratio (Q(t)/Σ Q(t)) is greater than 1 then, the first flush effect is judged to be significant [23, 24]. Fig. 2 shows the cumulative load ratio curve for each land use.
In all the land uses, first flushing effects were apparent but they were only partial in some cases. The partial first flush effects may have been due to the following reasons: 1) rainfall characteristics: the nature of rainfall in the early stages can influence the composition and quantity of the flushed material; 2) imperviousness: no land use was completely impervious; 3) topographical characteristics: the stormwater runoff and flushing effect also depended on the slope of the land; 4) the arrival of unconfirmed pollutants in the middle or latter rainfall stages.
Pervious and impervious lands were mixed at each monitoring site. Thus, the first flushing effect appeared indefinitely and it was dependent on the rainfall characteristics. The ‘power plant’ land use had the highest imperviousness ratio but it did not exhibit a noticeably elevated first flushing effect. This was due to the differences in the topographical slope. The slopes of the residential areas (single family and apartments) were relatively steep, while that of the power plant area was gentle.
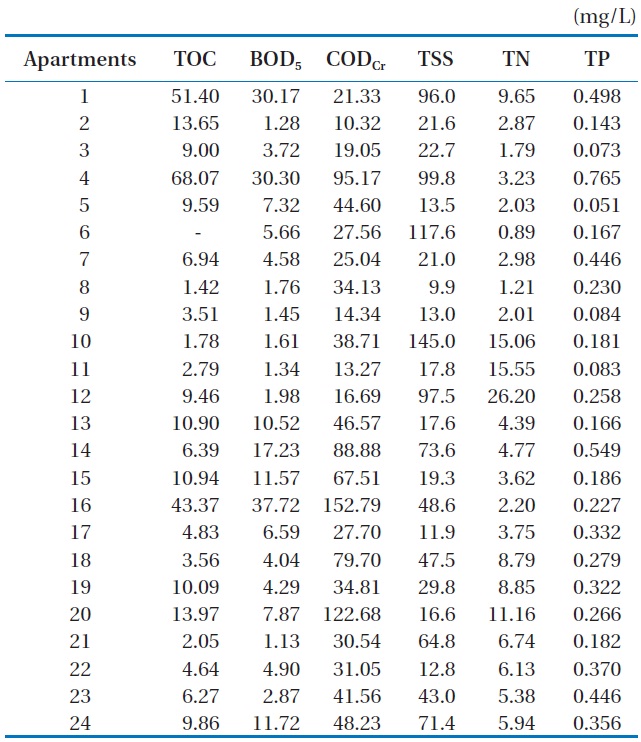
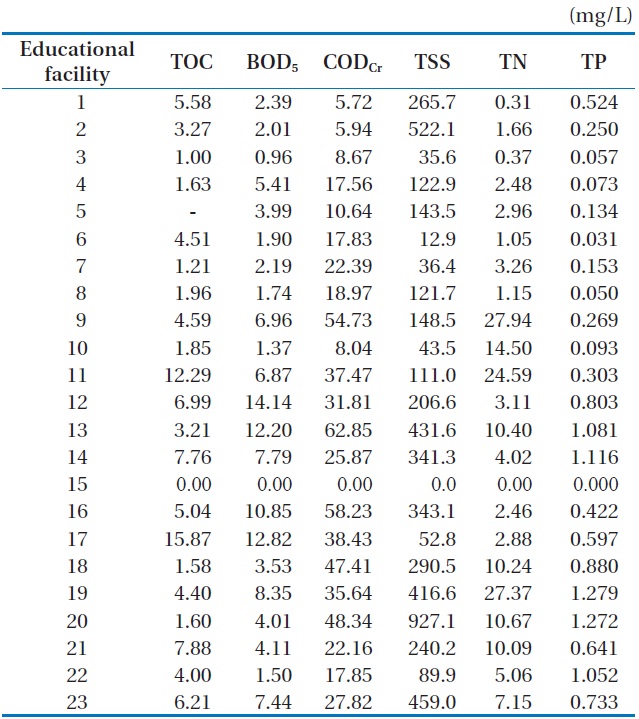
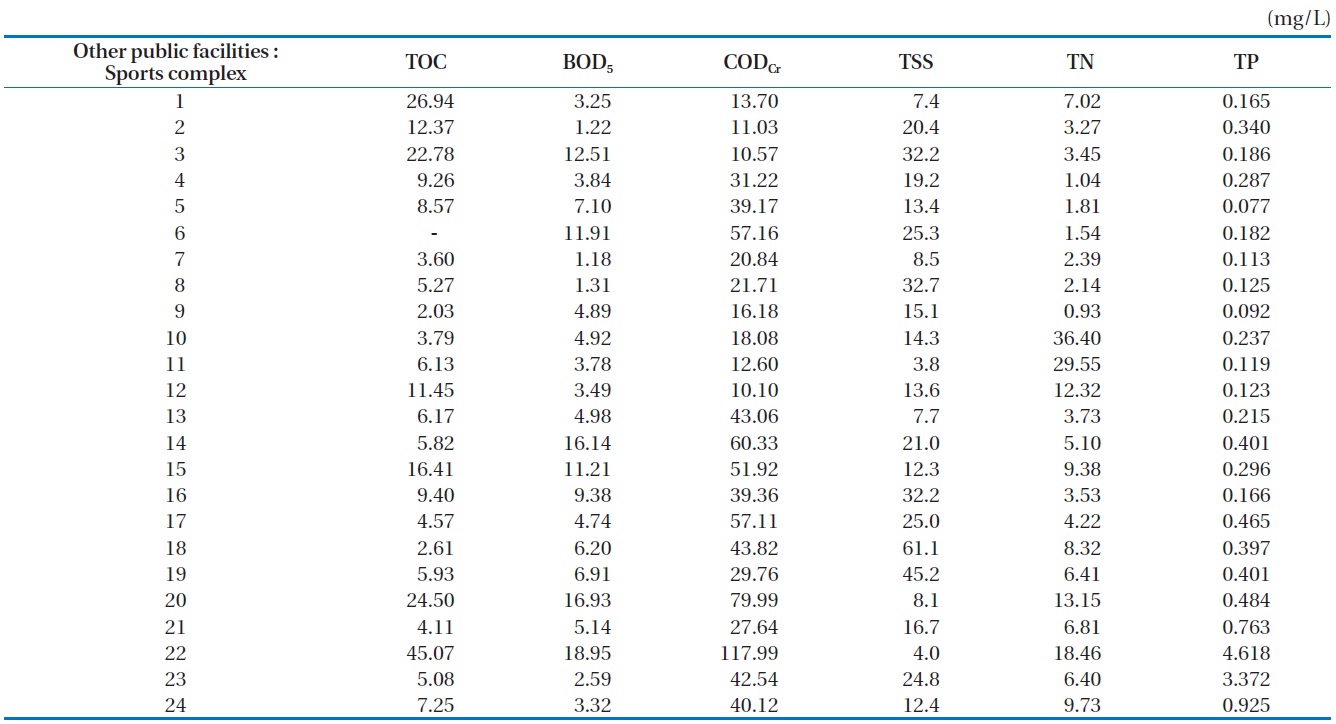
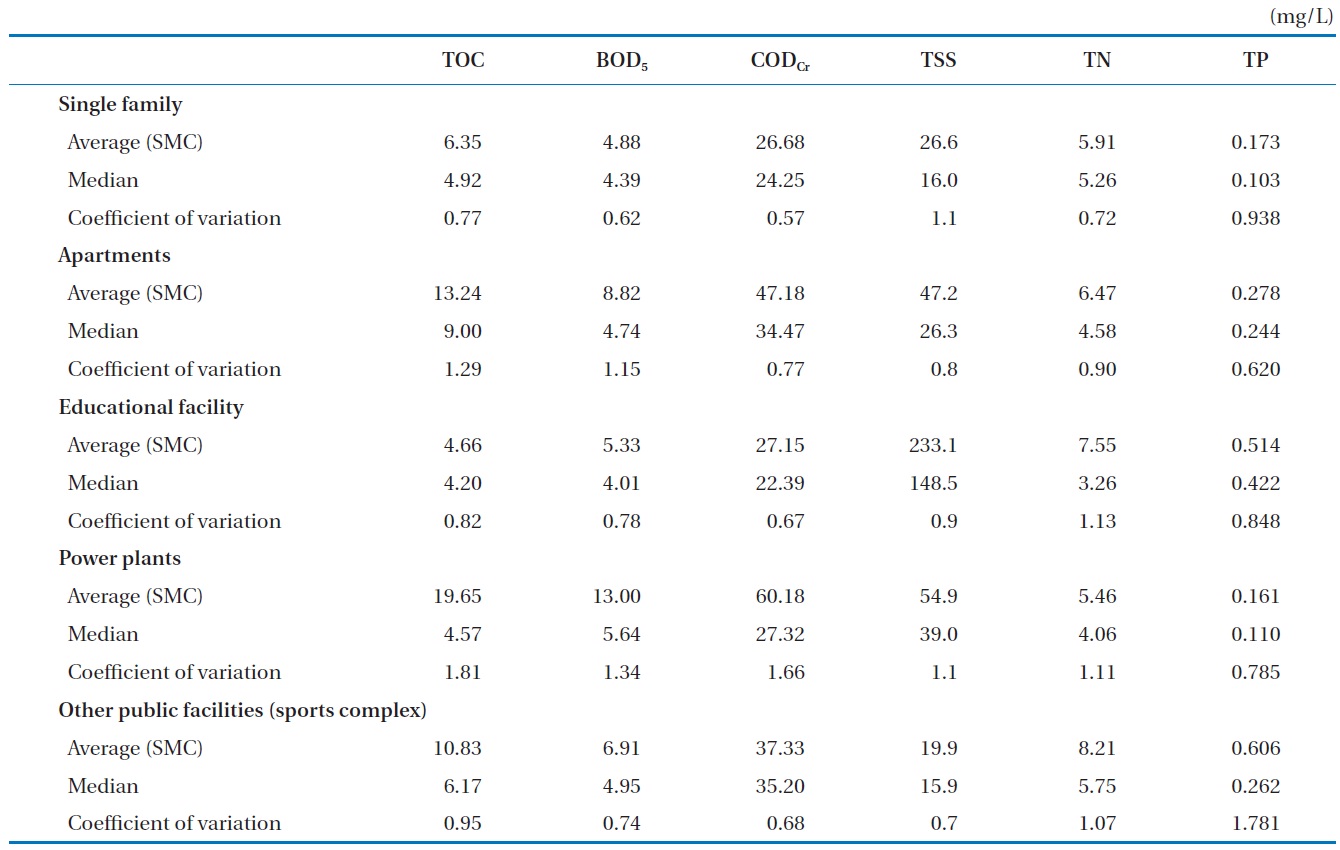
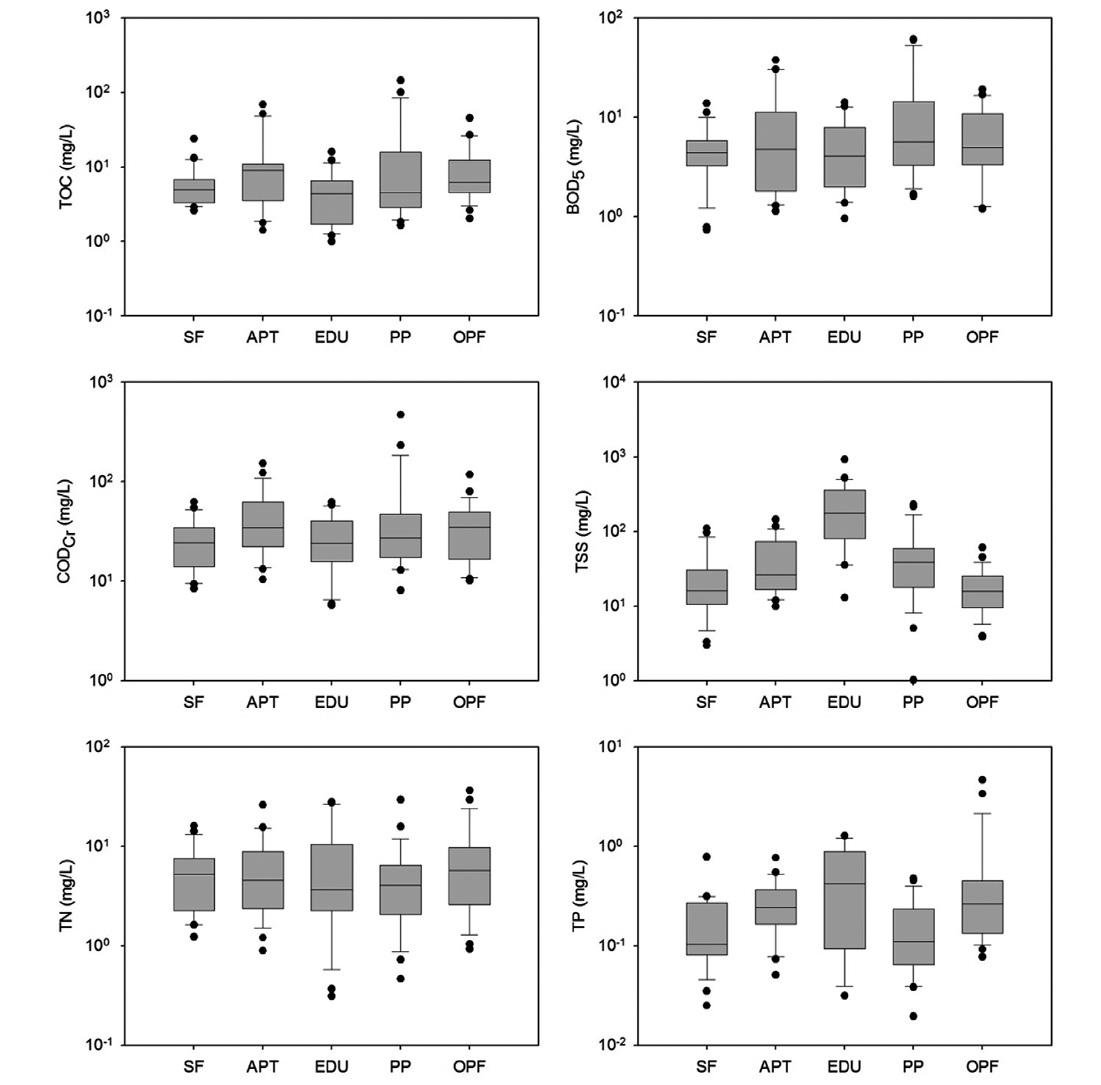
Table 4 tabulates the EMC of each monitoring event. Organic matter including TOC, BOD5 and CODCr were significantly concentrated in the apartment and power plant regions. Both the TP and TSS levels of the educational facility were high. This was because most of the pervious lands of the educational facility were simply ground with soil. Moreover, soil particles absorb phosphorus. TSS level of other public facilities was comparatively low but TN and TP levels were high. High levels were attributed to the fertilizer applied to the grass of a sports stadium. EMCs of each monitoring site are summarized in Table 5 and Fig. 3.
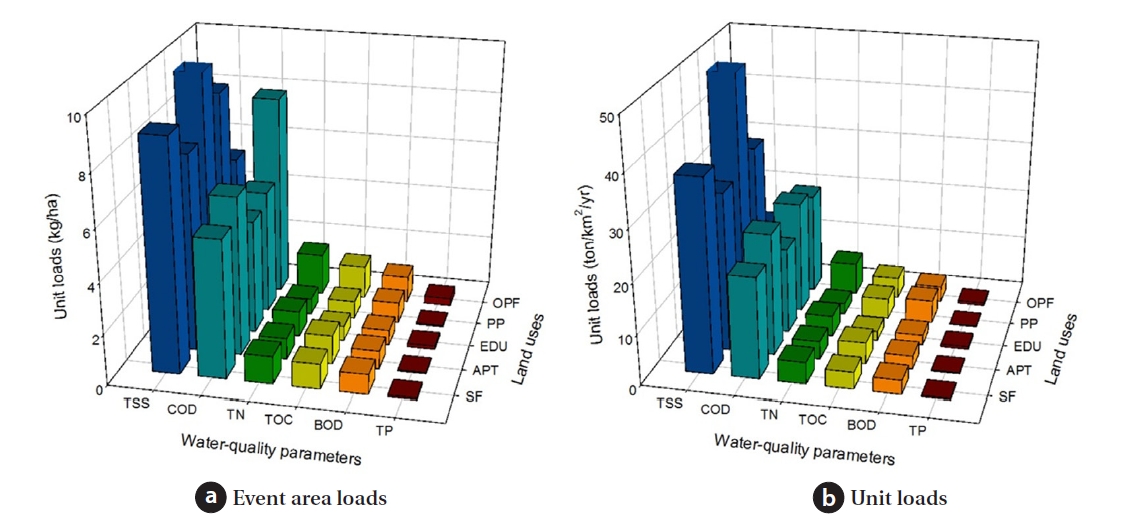
3.5. Event Area Loads and Unit Loads
Table 6 shows event area loads for each land use. Fig. 4 compares the event area loads for each land use. Although the pervious ratio of other public facilities was 36.44%, it contained the highest levels of all water quality parameters except TSS. The drainage of other public facilities was unique. The pervious land in the sports stadium lies above a concrete base. Water that infiltrates in to this land is drained by underground perforated drainpipes. Therefore, the stadium does not contain completely pervious land. Hence, it can discharge pollutants in the soil. Stadiums may reduce or delay stormwater runoff by a small amount. However, no differences were observed in the pollutant discharge. The organic matter (TOC, BOD5 and CODCr) levels of the educational facility were lowest. However, the TSS level of the educational facility was highest, because the ground contained soil. TN and TP levels were the lowest for the ‘power plant’ land use. The event area loads and EMC results for each land use were different. This was due to the difference in the drainage area sizes and total runoff volumes.
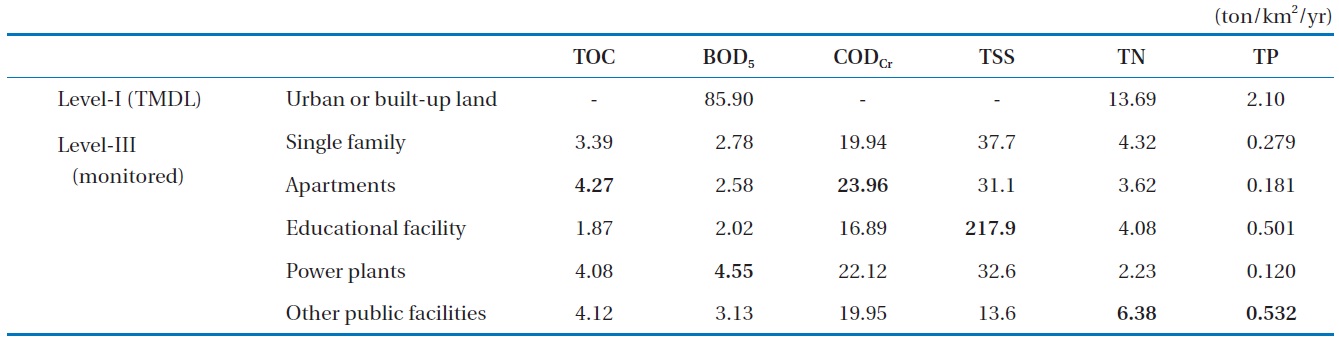
[15] suggested a method to establish the representative annual rainfall data. According to this method, the representative annual rainfall data is a combination of average rainfall data of each same month for 30 years. For example, January rainfall from this data set is an average of among 30 January (of past 30 years) [15]. Daily data of the most similar month among the past 30 years is selected as the rainfall data and it is selected using this data set. The established representative annual rainfall data is summarized in Table 7. Unit loads are calculated by using this annual rainfall data and it is summarized in Table 8.
TN, TP unit loads of other public facilities (sports complex) were higher than other monitoring sites. This result was caused by fertilization for grass management of stadium and characteristic drainage path. TSS unit loads of the educational facility shows the highest value due to the bare soil of the playground. Recently, the playground surfaces of elementary schools in Korea are being covered with grass. This trend may contribute to the reduction of NPS discharge from educational facilities. TOC and CODCr unit loads of apartments were the highest. Apartment complexes are densely populated areas and they have many cars in their parking lots. This can be the causative of discharge of organic matters that cannot be easily decayed or decomposed biochemically. The estimated unit loads according to Level-III land use types from results of this study were different from each other and also Level-I unit load of now Korean TMDL (Table 8). The established unit loads for the estimation of NPS loads in now Korean TMDL had been made from a little survey data in 1980s due to the lack of monitoring data. Thus, NPS runoff characteristics of each land use types were not satisfactorily reflected in the unit loads [24].
[Table 4.] EMCs of each land use
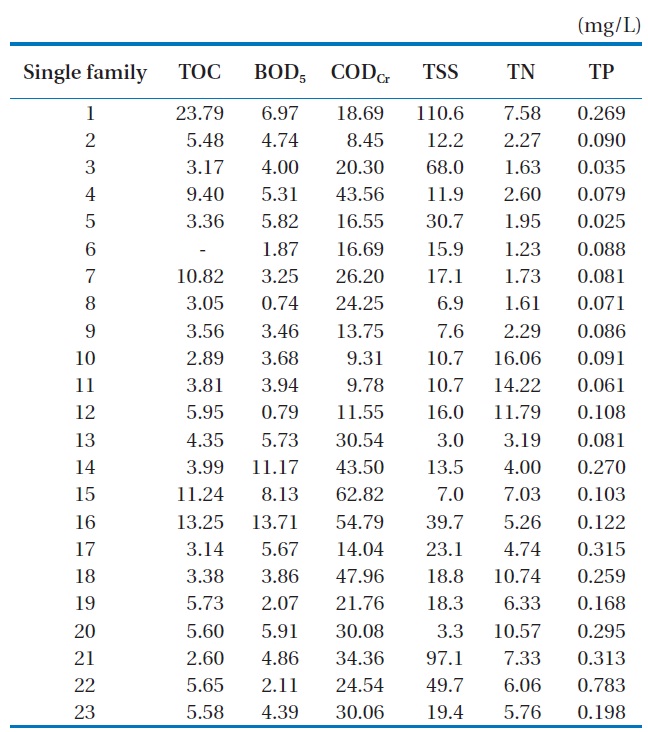
EMCs of each land use
[Table 41.] EMCs of each land use (continued)

EMCs of each land use (continued)
[Table 42.] EMCs of each land use (continued)

EMCs of each land use (continued)
[Table 43.] EMCs of each land use (continued)
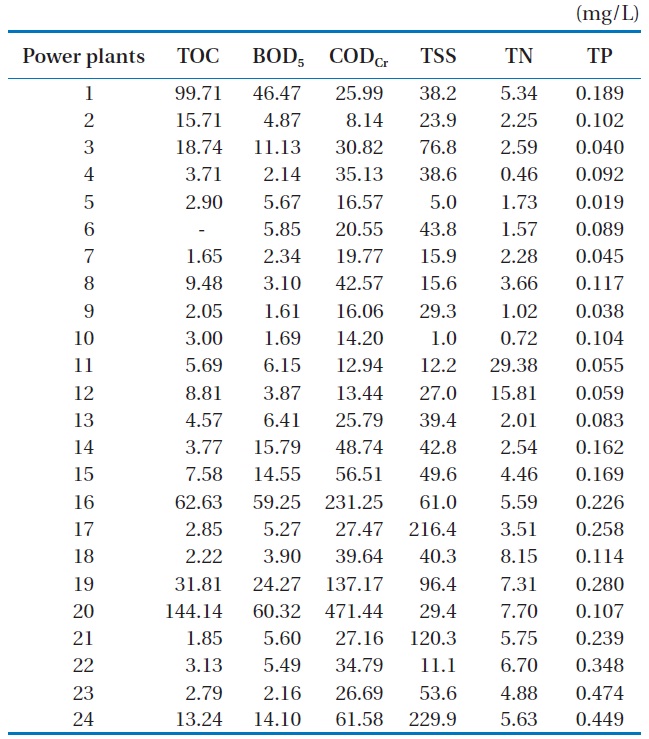
EMCs of each land use (continued)
[Table 44.] EMCs of each land use (continued)

EMCs of each land use (continued)
[Table 5.] EMCs summary and site mean concentration (SMC) of each land use

EMCs summary and site mean concentration (SMC) of each land use
[Table 6.] Event area loads (event load per area) from each monitoring site
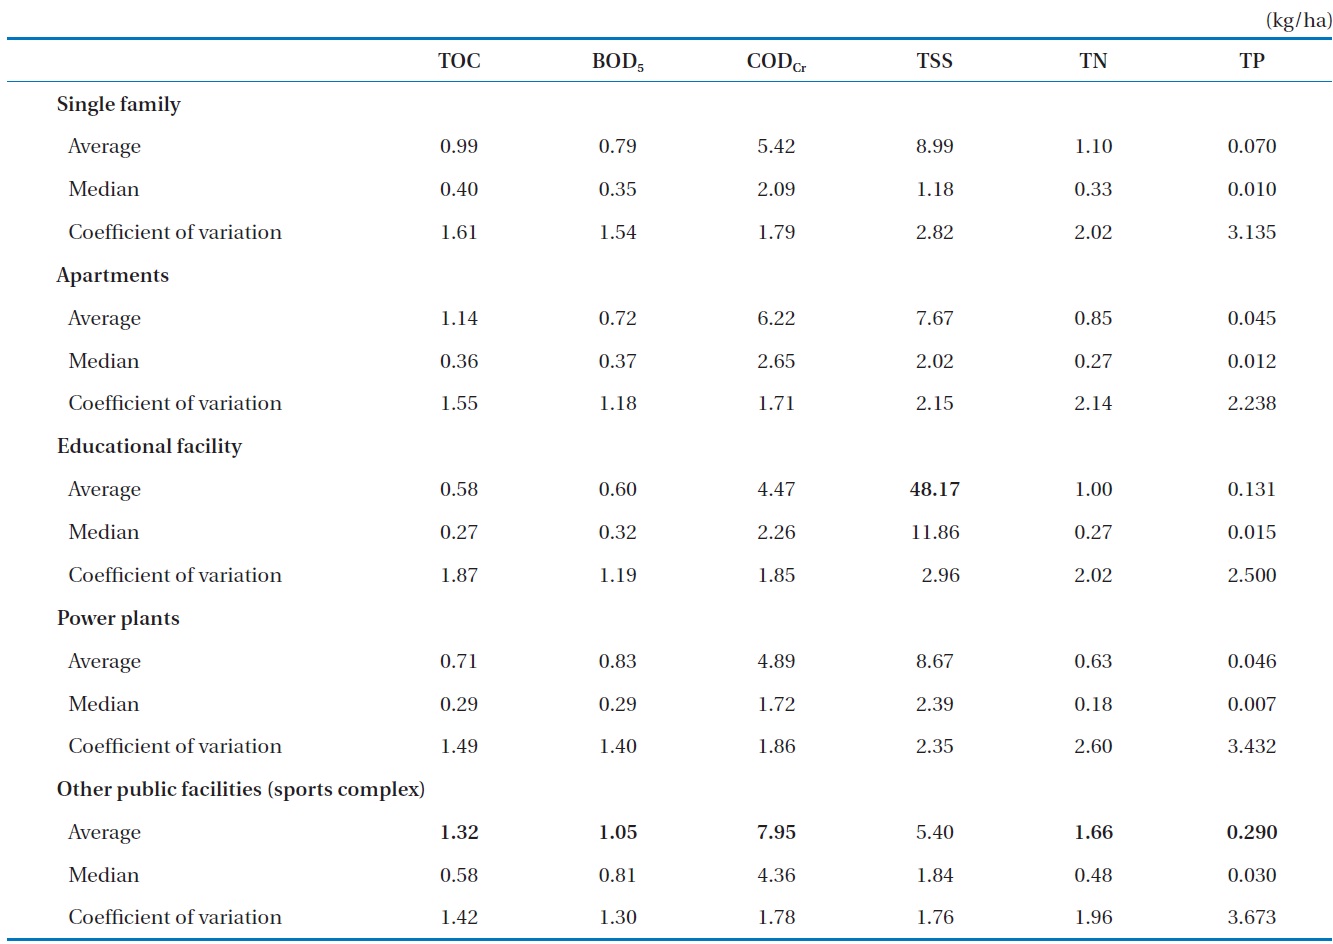
Event area loads (event load per area) from each monitoring site
[Table 7.] Total rainfall of each class of the representative annual rainfall data set

Total rainfall of each class of the representative annual rainfall data set
[Table 8.] Unit loads of each monitoring site

Unit loads of each monitoring site
NPS runoff characteristics including first flushing effect, EMCs, event area loads and unit loads of NPS pollutants were analyzed for various types of land use (single family, apartments, educational facility, power plant, and other public facilities). In all the land uses, first flushing effects were apparent but they were only partial in some cases. Total 23-24 EMCs data and event area loads for each land use were collected and then, the unit loads of each monitored land use were calculated by using the EMCs data and the representative annual rainfall data. Until today, land use types in Korean TMDL are classified as only 5 categories (Level-I : urban or built-up land, paddy field, upland field, forest land, and all other land uses). Unit loads of NPS have been proposed and they have been used according to each land use category. Nevertheless, various types of land use in urban or built-up land have not been considered. So, it is hard to give a detailed estimation and accurate NPS load. On the other hand, types of land use that were monitored in this study had been selected according to the subdivided categories (Level-III). Estimated unit loads showed differences among each other. The estimated unit loads especially presented a great contrast to the unit load of urban or built-up land in Level-I categories. Unit loads for Level-I categories are too comprehensive to apply to detailed land use types. Therefore, unit loads for more detailed land use types should be supported for the development of more reasonable and advanced TMDL in Korea. This study is aimed to introduce information and interim results on NPS monitoring of Level-III land uses. Continuous monitoring and accumulation of data will contribute to more accurate analysis of NPS runoff characteristics in Korea.