To overcome global warming, considerable international attention is being paid these days to the technology of CO2 capture and storage (CCS) [1-4]. But CO2 leakage, or the fracture of the geological formation where CO2 is stored, presents a serious problem. Hence, for the commercialization of CCS, one of the most important things is to obtain an accurate prediction or simulation of the behavior of CO2 in its geological storage layer. For these purposes, numerical simulation methods can be one of the solutions for predicting the multiphase flow and thermal characteristics of CO2, near the critical temperature and pressure conditions of underground. To date, simple numerical methods using Darcy’s law have been widely used for simulation techniques [5]. On the other hand, the lattice Boltzmann (LB) method has been developed in the field of earth science for molecular level simulation [6, 7]. However, the application of computational fluid dynamics (CFD) is very rare, in spite of its moderate applicability for predicting CO2 behavior with increased accuracy and low computational cost, compared with Darcy’s law and LB methods, respectively. Hence, in the present study, CFD is applied for calculating CO2 behavior in a micro-porous media, which represents an underground storage layer. The present CFD results can be applied to the design of CCS process, especially for CO2 injection processes, providing permeability prediction with high fidelity for a storage site, etc., which is the final goal of the present study.
For this purpose, a micro pore-scale model is developed, and this consists of pore-holes, which are surrounded by grains. Using this model, a 3-dimensional (3D) computational grid is generated and tested for the simulation of CO2 flow, changing the micro pore-hole size and its distribution, to investigate the effect of pore configuration on the flow and thermal fields. In particular, to replicate the real porous structure of a storage layer, the pore-hole size and distribution are randomly given. Near critical pressure and temperature conditions for CO2, the evolution of the CO2 flow and thermal fields are investigated by varying the micro-pore structure. This will be very helpful for designing optimal CO2 injection and sequestration systems.
2.1.1. Governing equations
The continuity and momentum equations for incompressible fluid are expressed as follows:
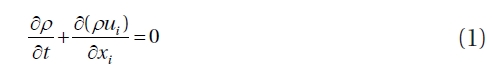
Here,
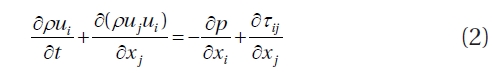
The energy equation to represent the evolution of a passive scalar is expressed as follows:
Where,
2.1.2. Numerical methods
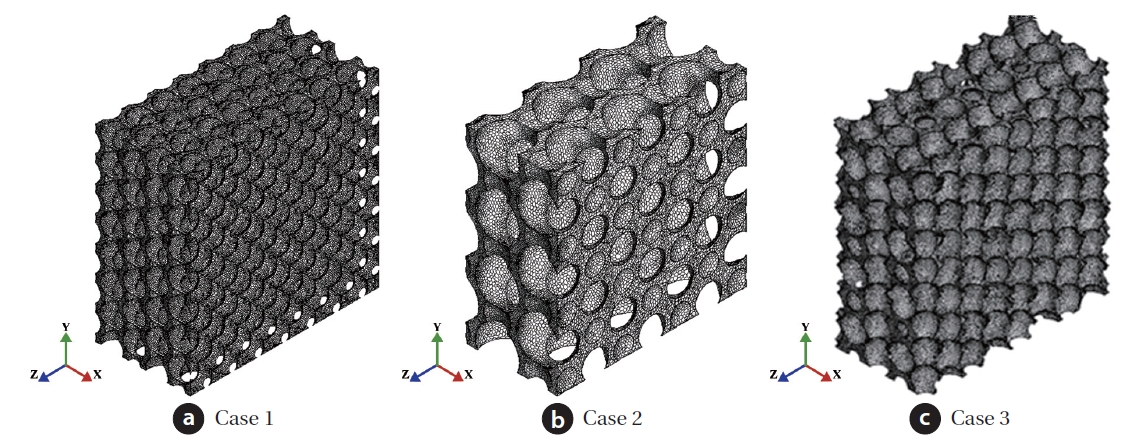
Fig. 1 shows a part of the computational domain for various configurations to investigate the effect of the porous media configuration on flow and thermal fields. For reference, a part of the
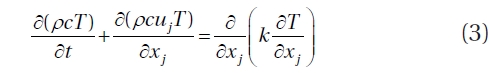
[Table 1.] Characteristics of the three different computational domains
Characteristics of the three different computational domains
computational domain is represented in the figure, to show pore configuration clearly. As shown in Choi et al. [10], a pore structure exists among grains. Hence, a pore represents the fluid flow passage surrounded by grains, and CO2 flow passes through the micro-pores in the present study. To compare the effect of micropore size, shape and distribution, three different cases of pore structure are selected, as described in Table 1.
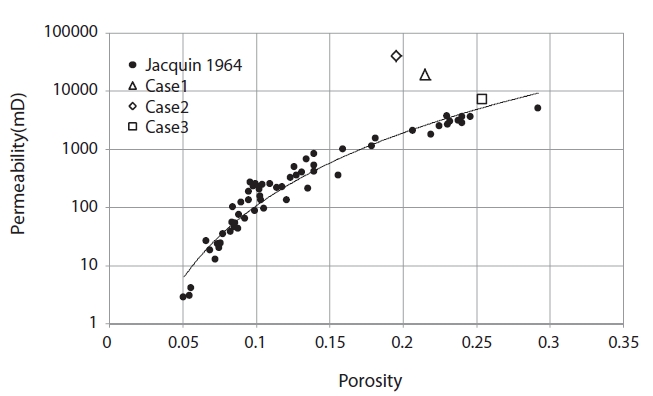
For reference, the grain size in Table 1 is determined from the well-known experiment [11], which found out the permeability of sandstones. For porosity, the value of 0.2-0.3 is usually used for
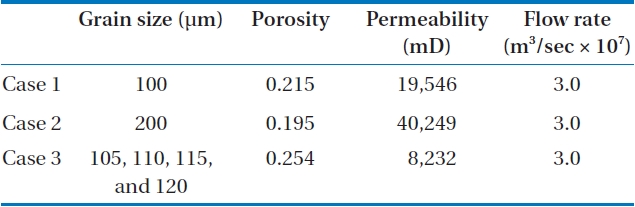
the modeling of aquifer [12-15] where CO2 may be sequestrated, hence the porosity is adopted around the range in the present study, considering experiment [11] as well. Also, the permeability of the present 3D model is compared with experiment [11] in Fig. 3, and this will be discussed in section 3 in detail.
Cases 1 and 2 have uniform grain sizes and distribution, respectively. It is noted that random packing and the irregular size of the grains approaches the more realistic situation of an underground porous structure similar to rock or sandstone. Hence, case 3 is further developed for a complicated model considering anisotropy of the underground pore structure. For this purpose, a modeling technique is developed and tested [16], which gives a random distribution of grain size and location. Case 3 has a random distribution of four different grain sizes, to mimic the real underground situation.
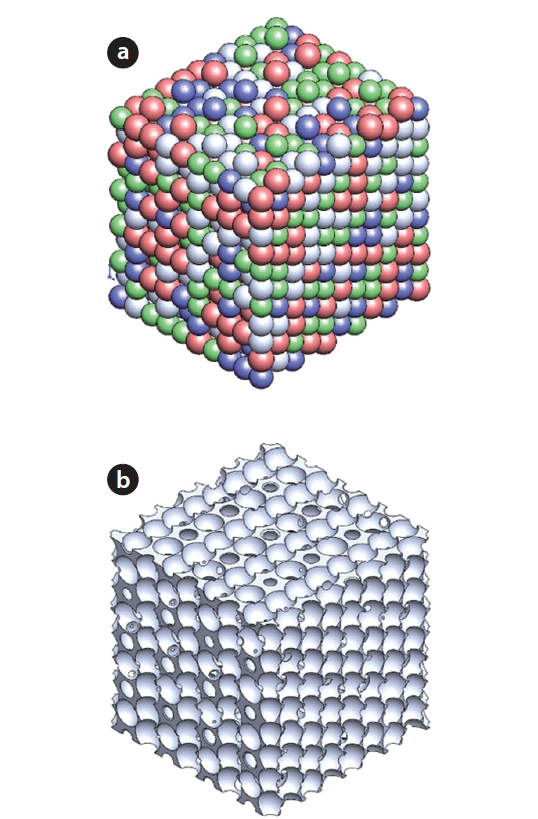
Fig. 2 shows how to construct the size distribution of grains for case 3, resulting in anisotropic micro-pore structure. As depicted in Fig. 2(a) with different colors, the random distribution of grains having four different grain diameters is applied in a hexahedral cube. After that, the grains are subtracted from the volume of the cube, and then the micro-pore structure remains. This micro-pore structure is used for the computational domain for case 3.
For the flow boundary conditions, the CO2 flow enters through the inlet, which is located at the left plane perpendicular to the x-axis of the cubic array of micro-pores, and comes out from the outlet (perpendicular to the right plane), to simulate CO2 movement through the underground. For walls, the no-slip condition is used, and a symmetry condition is applied to the spanwise and transverse directions. For the thermal boundary condition, an isothermal condition is adopted for the walls, which are heated by higher temperature than that of the fluid. For the grid allocation, unstructured grids with polyhedral meshes are applied, and the grid number is carefully selected around 1,000,000. For reference, to consider the supercritical condition of CO2 in an underground position, pressure is set to 100 bar and the temperature conditions of inlet and wall are given as 313 and 332 K, respectively. The variation of physical properties of CO2 is considered, such as density, specific heat, conductivity, and viscosity of CO2. It is noted that the change of the physical properties is very noticeable, even if the temperature is changed in the order of 10 K. This may affect the CO2 flow and final thermal fields, and has to be considered.
Before conducting the main calculation, the permeability of sandstone is computed to validate our modeling of micro-pore structure, using the three different cases in Table 1. The permeability is calculated using the following equation as
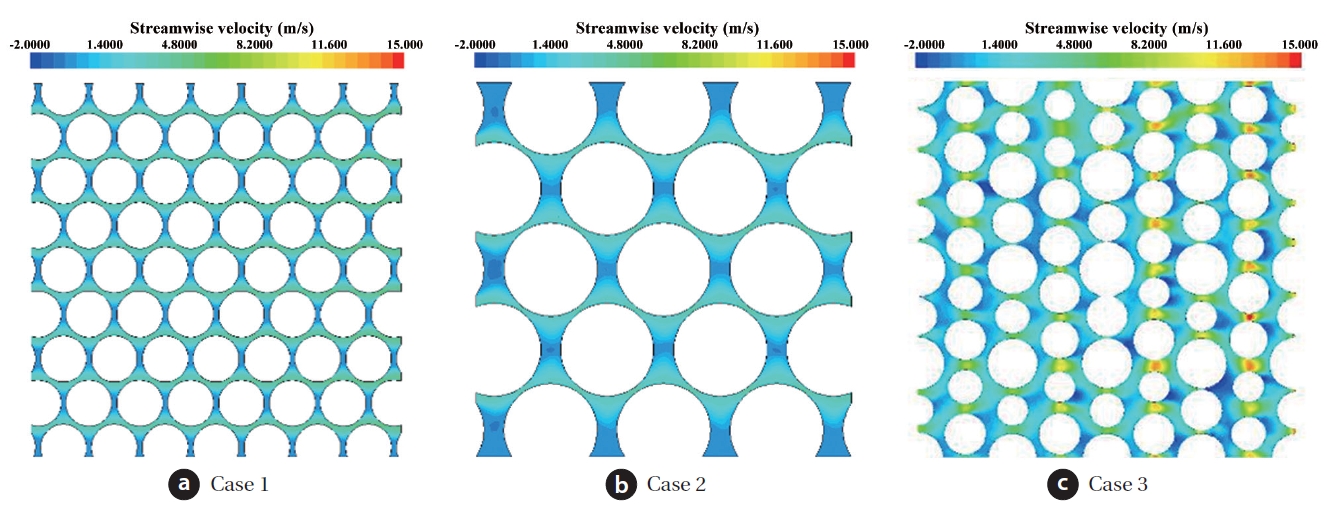
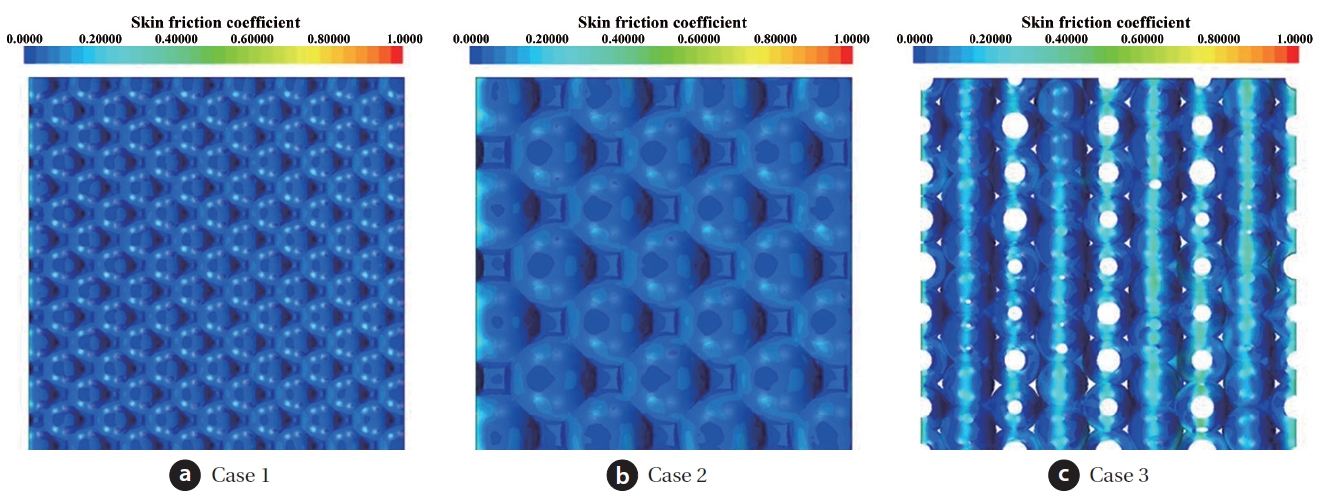
Figs. 4 and 5 show the contours of streamwise velocity and skin friction coefficient for a cross-sectional plane slicing the
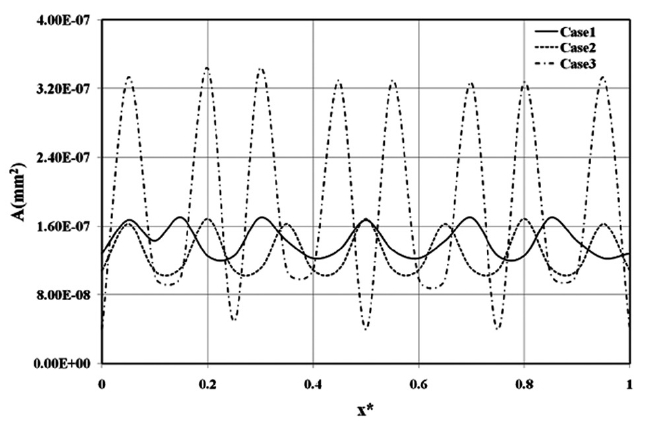
middle of the cube, respectively. In case 3, the magnitude of the streamwise velocity is higher than those of the other cases. Furthermore, the location of higher velocity magnitude is distributed irregularly in case 3, but cases 1 and 2 have uniform higher locations, where the gap between grains becomes narrower. It is interesting that case 1 consists of the smallest grains among three cases over the entire computational domain, but the highest velocity magnitude appears in case 3. This can be explained by the cross-sectional area along the streamwise direction, as in Fig. 6. Case 3 has the higher amplitude of area variation, compared with the others.
Accordingly, the magnitude of the skin friction coefficient is higher where the flow is accelerated in Fig. 5. The skin friction coefficients of cases 1 and 2 have a higher value at the throat region, where the velocity is increased between grains, and are distributed regularly. In case 3, the higher magnitude of skin friction coefficient is also located at the throat region; however the throat region is randomly distributed, resulting in irregular dis-
tribution of the higher magnitude coefficients. This may affect the permeability, as illustrated in Fig. 3, and finally have a great influence on the evolution of the scalar field, as will be discussed in the following.
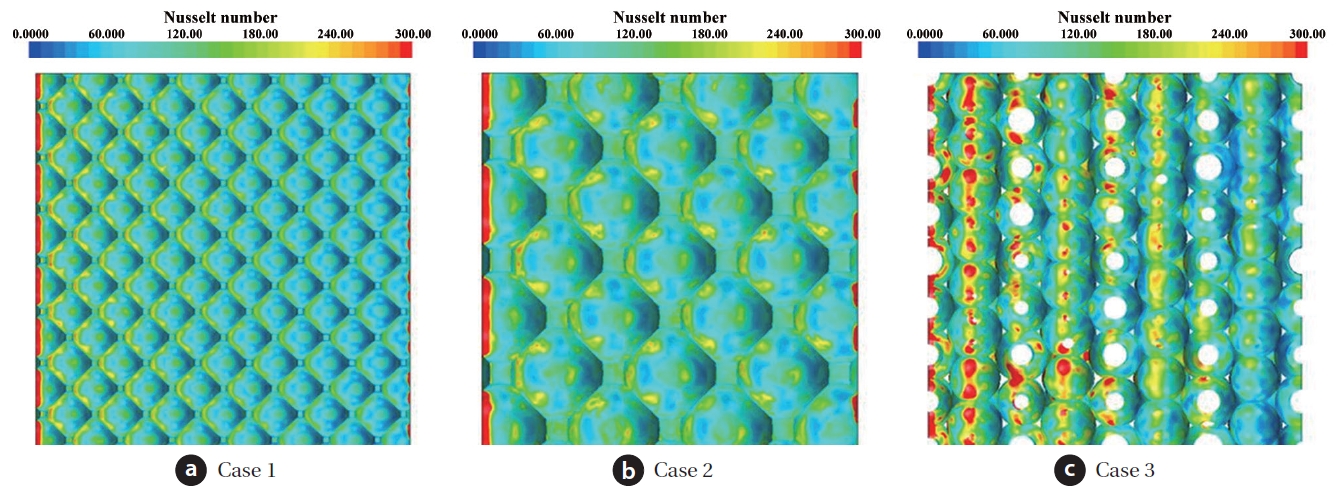
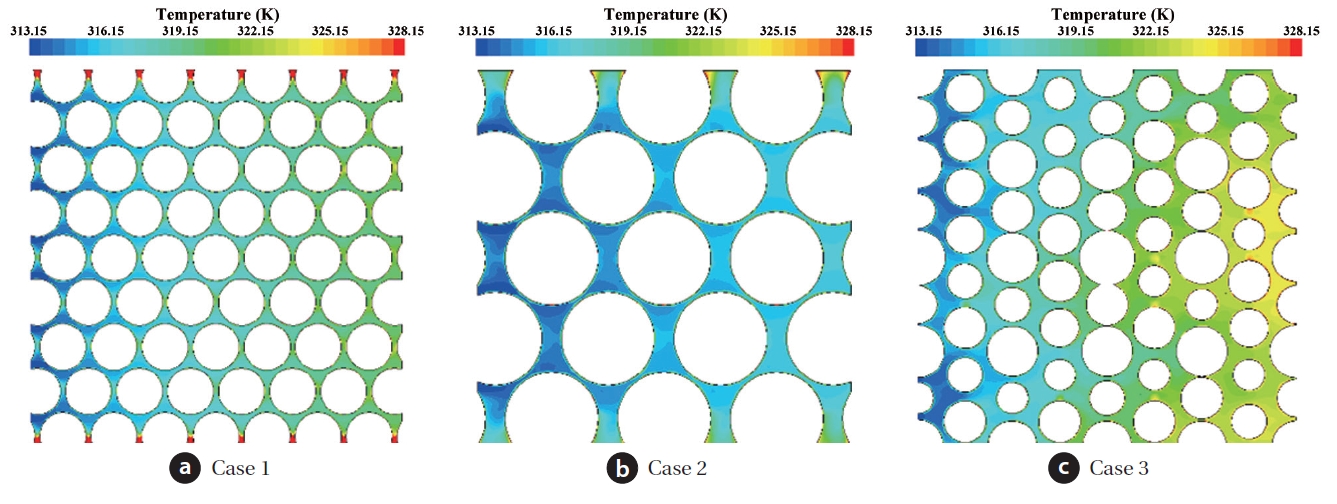
Figs. 7 and 8 show the contours of temperature and wall Nusselt number for the three different cases. For all the cases, the temperature is higher where the magnitude of the streamwise velocity is lower. In particular, approaching the outlet, the temperature is increased in the order from case 2, via case 1, to case 3. To look into these phenomena, the contour of wall Nusselt number is illustrated in Fig. 8. Comparing the three different cases, the magnitude of the wall Nusselt number is larger, and its distribution is irregular in case 3, because of the complex flow pattern. This can be confirmed from the following figure.
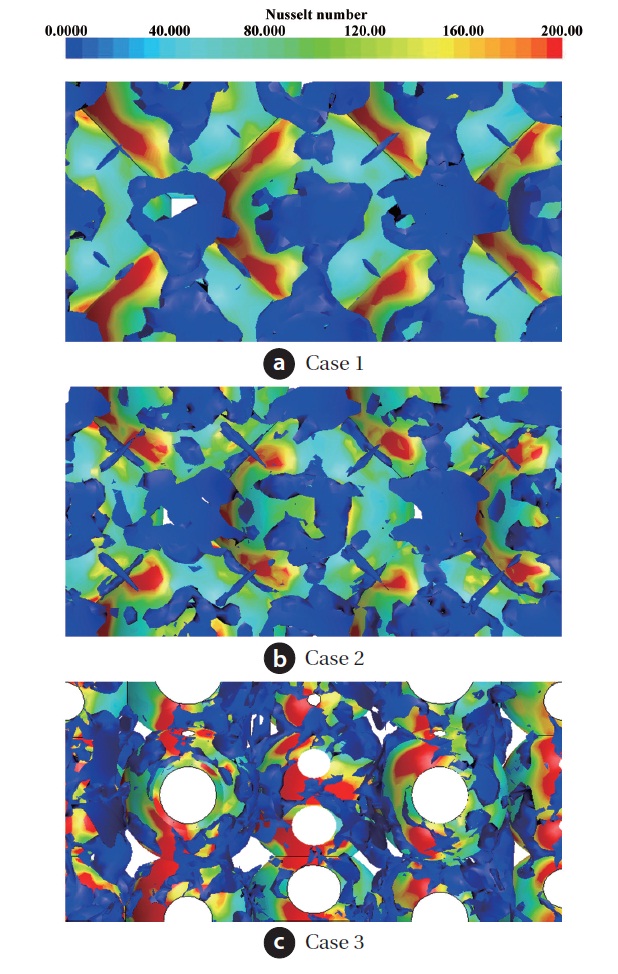
Fig. 9 shows the iso-surface of Λ2 value and contour of wall Nusselt number for the three different cases. To define the vortices in the present study, a negative Λ2 method is used to capture a vortical flow region, as proposed by Jeong and Hussain [17]. So, at every grid point calculation was made for finding a quantity, Λ2, the second largest one among the three eigenvalues of ? (1/
In the present study, CFD is applied for calculating CO2 behavior in a micro-porous media, which represents a storage layer inside underground. In particular, a micro pore-scale model is developed, and this consists of pore-holes that are surrounded by grains. To investigate the effect of the pore-structure configuration, three different allocations of micro-grains are considered. In particular, the pore-hole size and distribution are randomly given, to replicate the real porous structure of the storage layer. For the same size and regular arrangement of grains, the characteristics of the surface friction and heat transfer show a similar repeating pattern. However, if the micro-grains are randomly allocated, complex flow and thermal fields appear. It can be found that the modeling of pore structure can greatly affect the prediction of its flow and thermal fields. This is very important in developing a micro-pore model for the application of the optimal design of CO2 injection and storage in the CCS process. For example, using the CFD technique, the permeability of a micro-pore structure can be calculated, which mimics the real porous structure in the storage site. For reference, this numerical prediction is much better than that of the simple calculation by Darcy’s law [16], which is still generally used in the design and engineering of the CCS process. Then, the predicted permeability with high fidelity can be applied to the system design of CCS process, in particular for CO2 injection design, and this result in a decrease of cost, and increase of safety.
c fluid specific heat
k fluid thermal conductivity
Nu wall Nusselt number
p pressure
Sij the rate of strain tensor
T fluid temperature
ui velocity
κ permeability
μ kinematic molecular viscosity
τij viscous stress tensor
ρ fluid density


![Permeability of the three different cases compared with the experimental results [16].](http://oak.go.kr/repository/journal/11609/E1HGBK_2012_v17n2_83_f003.jpg)