Many studies have been conducted to obtain biofilter per-formance data for maintaining good water quality in a recir-culating system. Each type of biofilter has advantages and dis-advantages (Wheaton et al., 1994a). Although various types of biofilter media are in use, efforts to identify the most effective, economic, and efficient media are ongoing. Sand (Wheaton et al., 1994b; Shnel et al., 2002; Summerfelt, 2006), polysty-rene microbeads (Greiner and Timmons, 1998; Malone and Beecher, 2000; Malone and Pfeiffer, 2006; Timmons et al., 2006), and artificial plastic (Eikebrokk, 1990; Eikebrokk and Ulgenes, 1998; Rusten et al., 2006) have become important biofilter media.
Limited data are available about biofilter nitrification per-formance and maintaining water quality considering total media volume. Media volume becomes important when con-sidering the specific surface area (SSA) and biofilter space (Wheaton et al., 1994a; Lekang and Kleppe, 2000). Media with different SSAs produce different surface areas in the same volume. Media with a lower SSA require higher volume and biofilter space to obtain the same surface area as a media with a high SSA. Hence, comparison of the performances of different biofilter media at the same volume is needed.
Sand is the most well-known natural media and has been used successfully (Wheaton et al., 1994b, Losordo et al., 1998; Shnel et al., 2002; Summerfelt, 2006). Among artificial media, polystyrene has widespread commercial use (Greinner and Timmons, 1998; Malone and Beecher, 2000; Malone and Pfeiffer, 2006; Timmons et al., 2006), and Kaldnes medium is a recently developed artificial plastic medium (Lekang and Kleppe, 2000; Rusten et al., 2006). The objective of this study
was to compare total ammonia nitrogen (TAN) removal ef-ficiencies among three biofilter media,
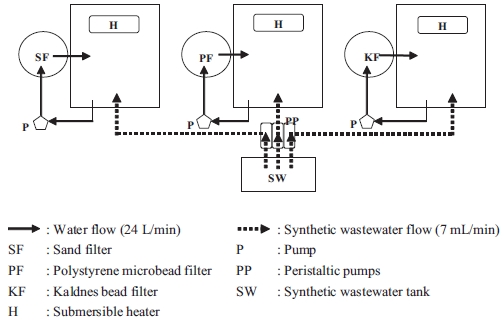
The experiments were conducted in three closed recircu-lating system units. Each system consisted of one aquarium (width, 45 cm; length, 60 cm; diameter, 45 cm), one biofil-ter cylinder (diameter, 19 cm; length, 100 cm), and one pump (Fig. 1). The total water volume used in each system was 100 L. Water from the aquarium was pumped into a biofilter cylin-der and then flowed back to the aquarium.
A 40 L synthetic wastewater tank was installed and three peristaltic pumps (Cheon Sei, Korea) were employed to dis-tribute synthetic wastewater (7 mL/min) into each of the bio-filters. The composition of the synthetic wastewater used in this study is shown in Table 1. A submersible heater was used in each system to maintain temperature at 22-26℃.
The three biofilter media (SF, PF, and KF) were installed
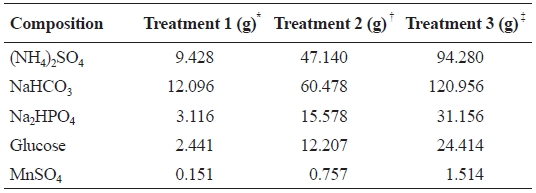
Composition and amount of chemicals (g) used for making 40 L of synthetic wastewater (modified from Roger and Klementson 1985 )
separately in 7 L filter cylinders. The sand filter was up-flow filtered to fluidize the sand, and the other two were filtered by down-flow movement. The SSAs of the SF, PF, and KF media were 7,836, 3,287, and 500 m2/m3, respectively.
Three ammonia loading rates of 5, 25, and 50 g/m3 water per day were applied as treatments 1, 2, and 3, respectively. These ammonia loading rates were based on the ammonia excretion rates of Nile tilapia fingerlings (Oh, 2001) and equivalent to tilapia biomasses of 5, 25, and 50 kg/m3 water. The synthetic wastewater was moved with peristaltic pumps, which were adjusted to 7 mL/min for each filter system. This adjustment provided 10 L of synthetic wastewater daily to each biofilter system. The flow rates through the biofilters were adjusted to 24 L/min.
>
Preparation of biofilter conditioning
Activated sludge was taken from the biofilter of a closed re-circulating aquaculture system, the Intensive Bio-Production Korea system, at the Fish Culture Station Center, Pukyong National University, Korea, and cultured in a tank with a syn-thetic wastewater loading rate of 200 mg L-1 day-1 for 2 weeks.
When the nitrifying bacteria were inoculated into the ex-perimental biofilters, the mixed liquid suspended solid con-centration of bacteria was 4,510 mg/L. Bacteria were cultured continuously in the synthetic wastewater with an ammonia loading rate of 50 g m-3 day-1 for 3 weeks. When nitrification had stabilized, water from each system was changed with aged groundwater of the same temperature, and the experiment was started.
Concentrations of TAN, nitrite-nitrogen (NO2-N), and ni-trate nitrogen (NO3-N) were monitored daily to assess estab-lishment of nitrifiers and their activity. The acclimated condi-tion for each biofilter was determined when TAN and NO2-N concentrations of the inlet and outlet water for each biofilter system were maintained at constant concentrations. Biofilter performance experiments were initiated following this ac-climation. Before changing the ammonia loading rate, water from all systems was exchanged with new aged groundwater, and the acclimation process was repeated.
Water samples were collected daily and measured
Equal volumes of synthetic wastewater (10 L/day) were added to each biofilter system continuously for 24 hours using the peristaltic pumps. Consequently, 10 L of water from each biofilter system was removed daily to maintain total water vol-ume in each system.
>
Water quality measurement methods
TAN concentration was measured with an ORION ammo-nia meter (Model 720 A, USA). Ion chromatography was used to measure NO2 and NO3 concentrations. Water temperature and DO were determined using OxyGuard. A Pin Point pH Monitor from American Marine Inc. was used to determine pH.
Volumetric ammonia removal rates (VAR, g m-3 day-1) and areal ammonia removal rates (AAR, g m-2 d-1) were calculated by the following equation:
VAR = (TANin - TANout) × Q × V-1 (Oh, 2001)
AAR = (TANin - TANout) × Q × V-1 × S-1 (Kamstra et al., 1998)
where TANin and TANout are the concentrations of TAN at the inlet and outlet of the biofilter (g/m3), respectively, Q is the total water flow through the filter (m3/day), V is the volume of the filter bed (m3), and S is the SSA of the medium (m2/m3)
All statistical analyses were performed using the Minitab statistical software package release version 11.12 (Minitab, Inc., State College, PA, USA). The concentrations of ammo-nia and ammonia removal rates in each biofilter system were compared using a one-way analysis of variance. The differ-ences between ammonia concentration and ammonia removal rate were analyzed using Tukey’s HSD test, with
Temperatures in SF, PF, and KF remained in the range of 22.4-25.6℃, and the pH level remained in the range of 6.65-7.38 during the study period. DO levels in the biofilters ranged from 6.7 to 9.1 mg/L.
The conditioning process for each treatment (ammonia loading rates of 5, 25, and 50 g m-3 d-1) was started in all three biofilter systems at the same time. The ammonia loading rate
was maintained at the same amount for each biofilter system throughout the entire period of conditioning and the experi-ment.
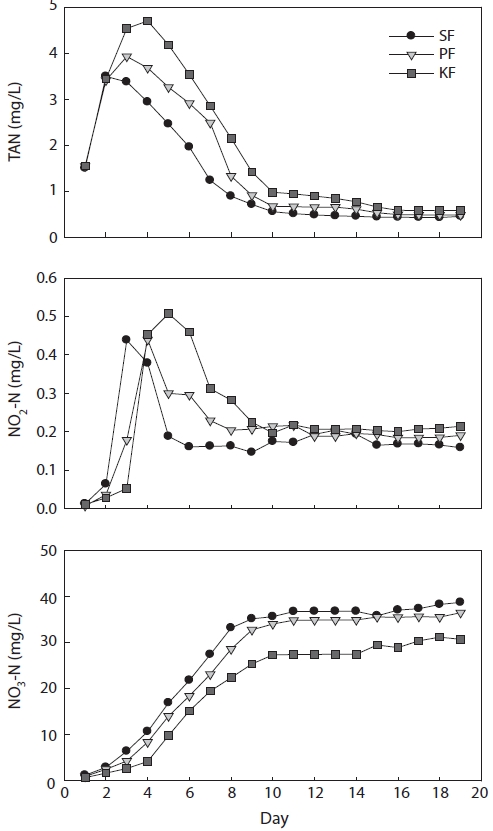
In treatment 1 (ammonia loading rate of 5 g m-3 day-1), TAN concentrations in SF, PF, and KF reached their peaks on days 2, 3, and 4, respectively, after the experiment had started, and the peak concentrations were 3.5, 3.9, and 4.7 mg/L, respec-tively (Fig. 2). Following the TAN peak, the ammonia concen-trations in SF, PF, and KF decreased gradually and reached <1 mg/L on days 8, 9, and 10, respectively. When the TAN level entered the steady state condition, the concentration of TAN remained <1 mg/L until the end of the experiment.
The NO2-N concentrations in all biofilter systems on day 1 were almost 0 mg/L. However, the concentrations increased sharply the next day and reached their highest levels in SF, PF, and KF on days 3, 4, and 5, respectively, with concentrations of 0.44, 0.44, and 0.51 mg/L. Then, NO2-N concentrations de-
creased gradually and were in a steady state at approximately 0.2 mg/L. When TAN concentration entered the steady state, the NO2-N concentrations also entered the steady state.
NO3-N concentrations in SF, PF, and KF increased con-tinuously from day 2 of the experiment. After TAN entered a steady state, the NO3-N concentrations in all biofilters did not increase as fast as before. The highest concentrations of NO3-N in SF, PF, and KF reached 38.8, 36.5, and 30.8 mg/L, respectively, at the end of the experimental period.
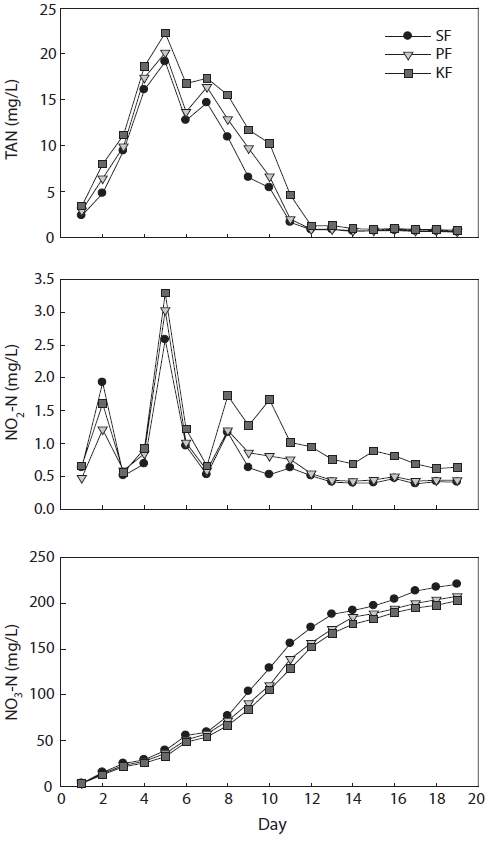
In treatment 2 (ammonia loading rate of 25 g m-3 day-1), TAN concentrations in SF, PF, and KF peaked on day 5, and the peak concentrations were 19.2, 20.1, and 22.3 mg/L, re-spectively (Fig. 3). Following the TAN peak, TAN concentra-tions in SF, PF, and KF decreased gradually and reached a steady state at 0.7 mg/L on day 14. Steady state TAN concentra-tions remained until the end of the experiment.
The NO2-N concentration in treatment 2 fluctuated during the first 8 days. The concentrations of NO2-N in all biofilter systems sharply increased on day 2 but dropped on days 3 and 4 and then reached their highest level on day 5 with concentra-tions of 2.6, 3.0, and 3.3 mg/L in SF, PF, and KF, respectively. After peaking, the NO2-N concentrations decreased sharply to 0.6 mg/L in all biofilters; the concentrations then increased again up to 1.2 mg/L in both SF and PF and 1.7 mg/L in KF. Subsequently, NO2-N concentrations decreased gradually and were in a steady state at approximately 0.4 mg/L in SF and PF and at approximately 0.8 mg/L in KF on day 13. When the TAN concentration entered the steady state, the NO2-N con-centrations had also entered a steady state.
NO3-N concentrations in SF, PF, and KF increased continu-ously up to day 13 of the experiment. After TAN entered a steady state, the NO3-N concentrations in all biofilters did not increase as rapidly as before. The highest NO3-N concentra-tions in SF, PF, and KF were 220.6, 207.4, and 202.6 mg/L, respectively, at the end of the experiment.
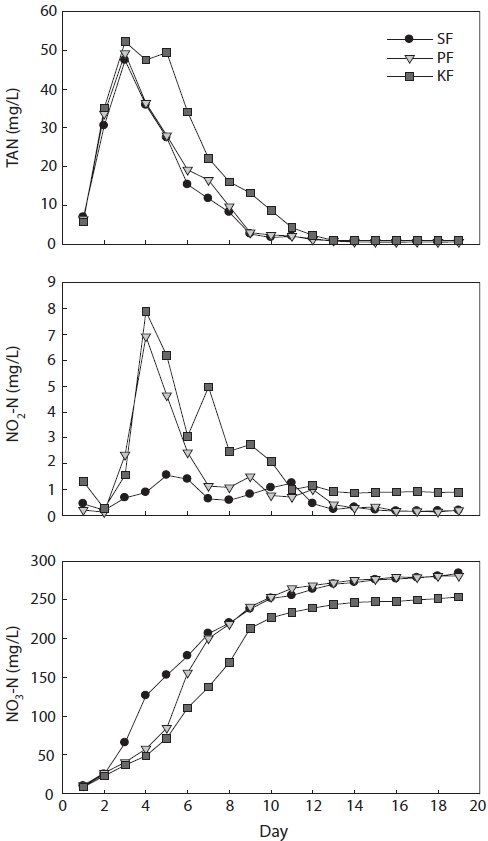
In treatment 3 (ammonia loading rate 50 g m-3 day-1), TAN concentrations in SF, PF, and KF all peaked on day 3 at 47.4, 49.2, and 52.2 mg/L, respectively (Fig. 4). Following the TAN peak, the TAN concentrations in SF, PF, and KF decreased gradually and reached a steady state in SF and PF at 0.5 mg/L on day 15 and in KF at 0.9 mg/L on day 13.
Treatment 3 NO2-N concentrations fluctuated until day 10. The peak NO2-N concentration in SF was reached on day 5 and those in PF and KF occurred on day 4, with concentrations of 1.6, 6.9, and 7.9 mg/L, respectively. Subsequently, NO2-N concentrations decreased gradually and attained a steady state in SF and PF at approximately 0.3 mg/L and in KF at approxi-mately 0.9 mg/L on day 13. When the TAN concentration en-tered a steady state, the NO2-N concentrations also entered a steady state.
The NO3-N concentrations in SF, PF, and KF increased continuously from day 11. After TAN entered a steady state, the NO3-N concentrations in all biofilters did not increase as quickly as before. The highest NO3-N concentrations in SF, PF, and KF were 284.3, 280.9, and 253.9 mg/L, respectively, at the end of the experiment.
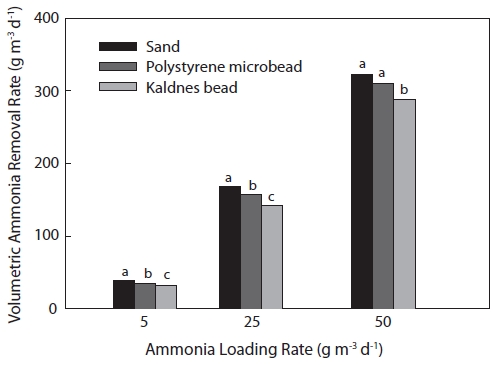
Significant differences were observed in the volumetric am-monia removal rates among the three biofilters (Fig. 5). The highest volumetric ammonia removal rates were found in SF for all ammonia loading rates of 5, 25, and 50 g m-3 day-1, and ammonia removal rates were 39.3, 168.6, and 322.7 g m-3 day-1, respectively. Ammonia removal rates in PF for the 5, 25, and 50 g m-3 day-1 loading rates were 35.0, 157.4, and 310.5 g m-3 day-1, respectively, whereas those in KF were 32.1, 142.5, and 288.1 g m-3 day-1, respectively. The volumetric ammonia re-moval rates increased with increasing ammonia loading rates in all biofilter systems.
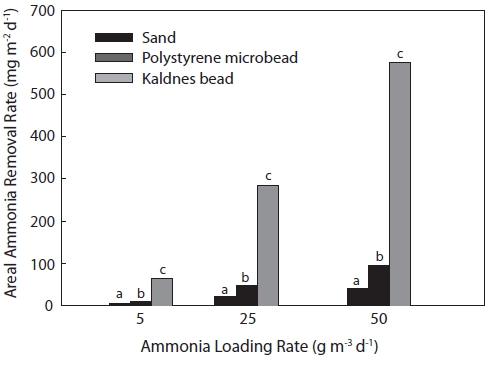
KF showed the highest ammonia removal rate based on
biofilter area (Fig. 6). The areal ammonia removal rates for KF under the ammonia loading rates of 5, 25, and 50 g m-3 day-1 were 64.1, 285.1, and 576.2 mg m-2 day-1, respectively, followed by PF (10.6, 47.9, and 94.5 mg m-2 day-1, respec-tively) and SF (5.0, 21.5, and 41.2 mg m-2 day-1, respectively). Areal ammonia removal rates also increased with increasing ammonia loading rates in all biofilters.
Similar to the TAN removal efficiencies, NO2-N volumetric removal rates under the ammonia loading rates of 5, 25, and 50 g m-3 day-1 were the highest in SF with actual values of 6.2, 8.6, and 8.6 g m-3 day-1, respectively, followed by those in PF (4.5, 7.3, and 8.0 g m-3 day-1, respectively). NO2-N volu-metric removal rates in KF under the ammonia loading rates of 5, 25, and 50 g m-3 day-1 were 5.2, 5.6, and 2.4 g m-3 day-1, respectively.
The NO3-N concentrations in SF at the end of the experi-ment were the highest among all biofilter systems and all am-monia loading rates. The NO3-N concentrations under am-monia loading rates of 5, 25, and 50 g m-3 d-1 were 39.5, 224.3, and 284.3 mg/L, respectively, followed by PF (37.3, 211.0, and 280.9 mg/L, respectively) and KF (32.3, 205.3, and 253.9 mg/L, respectively).
Temperature ranged from 22.4-25.6℃, DO ranged from 6.7-9.1 mg/L, and pH ranged from 6.7-7.4 in all systems under the different ammonia loading rates. These values are in the appropriate ranges for nitrification (Wheaton et al., 1994a). TAN is the most critical water quality parameter in intensive recirculating systems. According to Wheaton et al. (1994a) and Losordo et al. (1998), TAN should be maintained at < 1
mg/L in intensive recirculating systems. TAN consists of un-ionized ammonia (NH3) and ionized ammonia (NH4+), and the former is highly toxic to fish. The proportion of un-ionized TAN is dependent on pH and water temperature. When water pH and temperature increase, un-ionized ammonia increases.
The TAN concentration in all systems remained at >1 mg/L during the acclimation period. However, after the nitrifying bacteria had fully developed (steady-state phase), TAN concentrations in all systems were maintained at <1 mg/L. NO2-N, as a product of ammonia oxidation, should be maintained at <1 mg/L (Wheaton et al., 1994a; Losordo et al., 1998). Mean concentrations of NO2-N were maintained at <1 mg/L in all treatments once TAN entered the steady-state phase.
NO3-N concentrations were 32.3-284.3 mg/L in all aquaria with the three different ammonia loading rates at the end of the study. These values are within acceptable limits for aquacul-ture. Aquatic species can tolerate extremely high levels (>200 mg/L) of nitrate-nitrogen in production systems (Losordo et al., 1998). Furthermore, Masser et al. (1999) reported that ni-trate, the end product of nitrification, is relatively non-toxic except at very high concentrations (>300 mg/L).
SF had the best TAN removal rate compared to the other fil-ter media. This was related to the filter media characteristics. Sand media has a very high SSA (7,836 m2/m3) compared to the SSAs of PF (3,287 m2/m3) and KF media (500 m2/m3). The polystyrene microbeads in PF showed better performance than that of the Kaldnes beads in KF. This result was also associ-ated with the SSA. The SSA of PF was higher than that of KF. Malone and Pfeiffer (2006) noted that sand and polystyrene are high SSA media. Wheaton et al. (1994a) stated that the higher SSA of media, the more bacteria can grow per unit vol-ume of media, and the total ammonia removal per unit volume of filter will also be higher. Furthermore, Lekang and Kleppe (2000) reported that filter media with higher SSAs provide larger surface areas for bacterial growth. TAN concentrations in all systems should be maintained under the limit of <1 mg/L. The studied systems maintained TAN concentrations at <1 mg/L, indicating good performance by all three biofilters.
TAN volumetric removal rates in SF in the present study were 39.3-322.7 g m-3 day-1, which were lower than those in the study of Shnel et al. (2002). The volumetric removal rates in their study were 624.0-1,560.0 g m-3 day-1, which were due to the combination of a fluidized sand filter and a screen filter and relatively high ammonia loading rates of 1,138-1,339 g m-3 day-1. However, the present results are comparable with those of Summerfelt and Sharrer (2004), Pfeiffer and Malone (2006), and Summerfelt (2006). Summerfelt and Sharrer (2004) found that the volumetric ammonia removal rate was 101.1 g m-3 day-1 with an ammonia loading rate of 140.6 g m-3 day-1. Additionally, the volumetric TAN removal rates of Pfeiffer and Malone (2006) were 23.1-117.4 g m-3 day-1 with ammonia loading rates of 27-135 g m-3 day-1. TAN removal rates of Summerfelt (2006) were 140.0-160.0 g m-3 day-1 when using Mapleton sand with ammonia loading rates of 131. 5-165.9 g m-3 day-1 and were 170.0 g m-3 day-1 when using Richmond Dale sand with ammonia loading rates of 205.3-322.3 g m-3 day-1.
The TAN volumetric removal rates in PF of the present study were 35.0-310.5 g m-3 day-1 with ammonia loading rates of 5-50 g m-3 day-1. These results are lower than those of the two other studies. Greiner and Timmons (1998) reported that TAN removal rates by polystyrene were 84.0-480.0 g m-3 day-1 in high density tilapia culture (168 kg/m3). Timmons et al. (2006) also reported that the TAN removal rate of polystyrene beads was 1,200 g m-3 day-1 with an ammonia loading rate of 1,560 g m-3 day-1. These differences may be due to differences in the operating characteristics of the biofilter media such as flow rate, temperature, and water quality parameters.
TAN volumetric removal rates in KF of the present study (32.1-288.1 g m-3 day-1) were higher than those in the stud-ies of Lekang and Kleppe (2000), who used Norton rings and Finturf and Kaldnes filters (22.0, 56.8, and 60.0 g m-3 day-1, respectively). These differences might be due to differences in the SSA and ammonia loading rate. The SSAs of Norton rings and Finturf media were 220 and 284 m2/m3, respectively, compared to 500 m2/m3 for KF in the present study. Lekang and Kleppe (2000) also used a lower ammonia loading rate (1.5 g m-3 day-1) than that used in the present study (5-50 g m-3 day-1). The volumetric removal rate by KF in the present study was also higher than that in a study by Ridha and Cruz (2001), who used polyethylene blocks (8.9 g m-3 day-1) and polypro-pylene plastic chips (9.3 g m-3 day-1), as both media also have a lower SSA (200 m2/m3) than that of Kaldnes and were treated with a lower ammonia loading rate (10.3 g m-3 day-1). Com-pared with the results of Al-Hafedz et al. (2003), who used plastic rolls, PVC pipes, and scrub pads (3.46, 2.95, and 3.2 g m-3 day-1, respectively), the removal rate by KF in the present study showed higher performance, considering that the previ-ous study used a lower ammonia loading rate (11.8 g m-3 day-1) than that in the present study.
SF showed the lowest TAN removal rate based on area (
NO2-N concentrations in all biofilter systems were main-tained under the limit (<1 mg/L), indicating that the three bio-filters performed well to maintain water quality. SF always showed a higher NO2-N volumetric removal rate than that of the other media. KF showed the lowest removal rate and PF was in the middle. This result was also related with the SSAs of the biofilter media; the SSA of SF was higher than those of PF and KF.
The highest NO3-N concentrations in SF, PF, and KF were 284.3, 280.9, and 205.3 mg/L, respectively, and these were still under the >300 mg/L limit suggested by Masser et al. (1999).
Biofilter media preference depends on many factors such as surface area, durability, and cost. Low capital cost is an important factor to consider when establishing a recirculating system for fish culture (Al-Hafedh et al., 2003). The prices of SF, PF, and KF per cubic meter based on recent prices given by online sellers are approximately 150 US$, 100 US$, and 1500 US$, respectively. Considering variations in SSA among these media, the cost for obtaining a 100 m2 surface area is approximately 2 US$ for SF, 3 US$ for PF, and 300 US$ for KF. However, SF requires high energy requirements to fluid-ize the sand bed (Wheaton et al., 1994b; Summerfelt, 2006), which increases energy costs. Therefore, polystyrene micro-beads are recommended due to their good ammonia removal performance, light weight, and high economy per surface area volume.