The natural distribution of the solitary ascidian
The sea squirt are cultivated by the hanging culture method (Rho et al., 1993): seeds from a hatchery are attached to a vertical rope that is hung from a longline, much as oysters are cultivated (Kang et al., 1980). Hatcheries in Korea often use seeds that have been introduced from Iwate in Japan, but the details of the origins and breeding records of the introduced sea squirt are unknown. Also, large numbers of the cultured sea squirt in Korea have died from an unexplained syndrome over the last 20 years (Cho et al., 2008). Each dying Sea Squirt shows thinning of the tunica, and the meat becomes quite soft (thus the name “softness syndrome”). To manage and improve the sustainable production of this sea squirt resource in Korea, it is vital to identify the causative factors responsible for the
softness syndrome.
A major concern has been focused on genetic changes within cultured populations may threaten the integrity of wild populations (Allendorf and Ryman, 1987). Cultivation to enhance the stock has also been identified as one of the factors responsible for the depletion of wild populations, due to inbreeding, competition, and the spread of disease (Allendorf and Phelps, 1980). Furthermore, genetic variation is beneficial and important for the long-term survival of natural populations, because variation can provide the population with the ability to adapt to changing environmental conditions (Frankel and Soule, 1981 ).
Genetic variation within and between populations provides a potential resource for future adaptations (Hurt and Hedrick, 2004). In recent years, molecular markers have been used to observe the genetic variation in sea squirt populations to study phylogeography and population genetics (e.g., Ben-Shlomo et al., 2001, 2006; Tarjuelo et al., 2004; Lopez-Legentil and
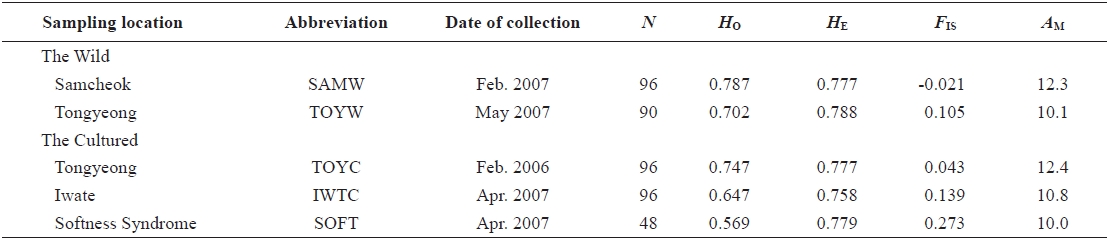
Sampling locations, date of collection, the number of samples (N), observed (HO) and expected (HE) heterozygosities, inbreeding coefficient (FIS), and mean number of alleles (AM) used for Halocynthia roretzi msDNA analysis
Turon, 2006). To date, no genetic study in
In the present study, we investigated genetic variability between the wild and the cultured populations of
In 2006 and 2007, sea squirt were collected from two wild populations at Samcheok (abbreviated as SAMW) and Tongyeong (TOYW), Korea, respectively, and three cultured populations: a population from Tongyeong (TOYC), a population from Tongyeong with softness syndrome (SOFT), and a population from Iwate, Japan (IWTC) (Table 1, Fig. 1). The TOYC population, which was introduced in 1989 from Iwate in Japan, originated from third generation spawners (body size > 10 cm) that had been reared continuously. The SOFT and IWTC populations had also been reared continuously, but no information is available about the origin of these populations. Samples of muscle from internal organs were collected from 426 individuals from the five populations. The muscle samples were preserved in 100% ethanol at room temperature until the DNA was extracted. Genomic DNA was extracted from the stored muscle tissues by an automated DNA extraction system (MagExtractor MFX-6100; Toyobo, Japan ) with a MagExtractor Genomic DNA Purification Kit (Toyobo). Extracted DNA was dissolved in 80 μL of Tris-EDTA buffer (TE; 10 mM Tris-HCl and 1 mM EDTA, pH 8.0) until genotyping.
Nine polymorphic microsatellite loci were examined by PCR amplification by primers previously developed for this species (Han et al., 2009). The forward primer of each pair was labeled with one of the following fluorescent dyes: 6FAM, NED or HEX. PCR amplification was performed with a PTC-200 thermocycler (MJ Research, Inc., Waltham, MA, USA ) and the following reaction conditions: initial denaturation for 5 min at 95℃, 40 cycles of 30 s at 95℃, 45 s at a primer-specific annealing temperature, 45 s at 72℃, and a final extension step at 72℃ for 30 min. The specific annealing temperature of each primer set is given in our previous paper (Han et al., 2009). The PCR products were analysed using an ABI 3130 XL genetic analyzer (Applied Biosystems, Foster City, CA, USA ) to screen for polymorphisms.
>
Analysis of population genetics data
The inbreeding coefficient
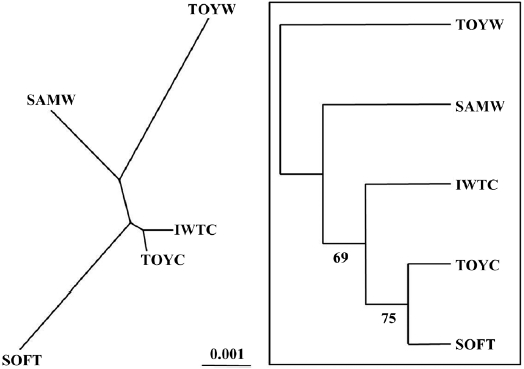
A matrix of genetic distances, based on the set of allele frequencies in different populations, was constructed according to Nei (1972). A neighbor-joining (NJ) tree was constructed for each replicated matrix by bootstrapping 1,000 replications with NEIGHBOR in PHYLIP version 3.5 (Felsenstein, 1993). The consensus tree was generated following the 50% majority rule by CONSENSUS, also in the PHYLIP package (available at http://www.evolution.genetics.washington.edu/phylip. html ).
To our knowledge, this is the first reported study on the population genetics of
Most of the sea suirt cultured in Tongyeong area have died during the last 20 years from the “softness syndrome” disease which has had a detrimental effect on the Korean aquaculture industry. Cho et al. (2008) discriminated normal and dying sea squirt by their differential patterns of gene expression. Low genetic variability in the cultured populations, which is caused by increased levels of inbreeding due to the use of a small effective number of parents, may generally lower resistance to various diseases. Although the mean
Pairwise population estimates of
populations, except TOYC and IWTC, and for pairs of wild populations. The highest values of
Pairwise population estimates of
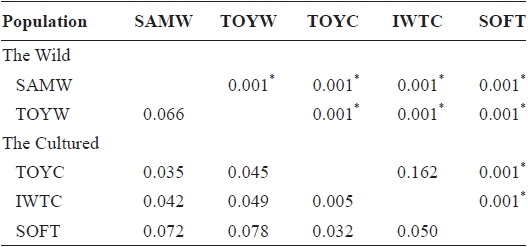
FST values between samples (below diagonal) and probability of differentiation with P-value in FST estimate (above diagonal)
southern coastal (TOYW) populations. The NJ tree also indicated that this wild population pair was genetically distinct. These results suggested low levels of gene flow between populations in different regions and long-term isolation between regional populations. Grosberg (1987) and Davis and Butler (1989) found that the larvae of colonial sea squirt were only dispersed over short distances. Thus, our findings suggest that genetic interactions between populations of
In conclusion, our results demonstrate that genotyping with microsatellite allele frequencies can be applied to the identification of stock and the estimation of genetic variability among and within wild and/or cultured populations. In particular, the results of the analysis suggested that genetic variation had decreased in a cultured population of the sea squirt