Mercury (Hg) is a major concern among hazardous heavy metals because of its high volatility and high toxicity. In environmental matrices, Hg usually occurs in very low contents, so that highly sensitive analytical methods are needed for the determination of the element.1 Therefore, with the increasing importance of the effect of mercury in environment on health, various analytical methods to detect a trace amount of mercury in various samples have been continuously developed. In atomic spectroscopy, analytical methods of mercury such as atomic absorption spectrometry (AAS),2 atomic fluorescence spectroscopy (AFS),3 and inductively coupled plasma mass spectrometry (ICP/MS)4 have been reported. Especially, isotope dilution-inductively coupled plasma mass spectrometry (ID-ICP/MS) had been developed and used as a primary method in inorganic atomic analytical method because ICP/MS is applicable to analyze isotope analysis.5?9 A method of isotope dilution-cold vapor-inductively coupled plasma mass spectrometry (ID-CV-ICP/MS) was developed in National Institute of Standards and Technology (NIST) at 2001 and applied to analyze small amount of mercury in various NIST Standard Reference Material (SRM) samples.10 National Research Council of Canada (NRCC) which is the national standard research institute in Canada adopted the ID-CV-ICP/MS method to determine mercury in river standard samples.11
In this study, an ID-CV-ICP/MS method coupled with flow injection (FI) has been applied to determine the content of Hg in BCR 176 fly ash CRM. Isotopic ratios were measured at two different signal processing mode in FI, that is, average mode and maximum mode, and the reproducibility of the obtained isotopic ratios were compared.
For mercury cold vapor generation, the solutions of 0.05% (w/w) NaOH and 0.2% (w/w) NaBH4 with3 % (w/w) HCl solution were used as reductant. For isotope dilution method, the 200Hg isotope was used as an enriched spike and 202Hg was used as a reference isotope.
Two different acid mixtures (acid mixture-A: 8mL HNO3 + 2mL HCl + 2mL HF, acid mixture-B: 8mL HNO3+ 2mL HClO4 + 2mL HF) were compared for fly acid sample digestion. The mineral acid mixture-A (HNO3 + HCl + HF) was used according to EPA method 3052. The mineral acid mixture- B (HNO3 + HClO4 + HF) was used according to the method that has been used for decomposition of NIST 1633a coal fly ash.12 To investigate the validity of the method described in this paper, Mercury in BCR CRM 176R fly CRM was analyzed and compared with the indicative value.
Dynamic Reaction Cell-ICP-MS (Perkin-Elmer SCIEX Elan 6100) was used in this study and FIAS 400 (Perkin-Elmer) device was used for continuous flow injection. A 1000mg/kg (in 10% HNO3) Hg standard solution was prepared and certified at the Korea Research Institute of Standards and Science (KRISS). BCR-176R fly ash was provided by the Institute for Reference Materials and Measurements (IRMM). Concentrated isotope of 200Hg (abundance 84.45%) was purchased from TRACE SCIENCES (International Corp., Ontario, Canada). NaBH4 (Sigma-Aldrich, granules, 99.99% Cat#480886), NaOH (Sigma-Aldrich, pellets, 99.99%, semiconductor grade, Catalog No. 30657-6), HCl (Dong Woo Fine Chem, Korea, Iksan, electronic grade) were used to produce mercury cold vapor. Milestone Ethos Plus/HPR 1000/100 Rotor (Italy) was used for microwave digestion.
>
Flow injection-cold vapor-ICP/MS system
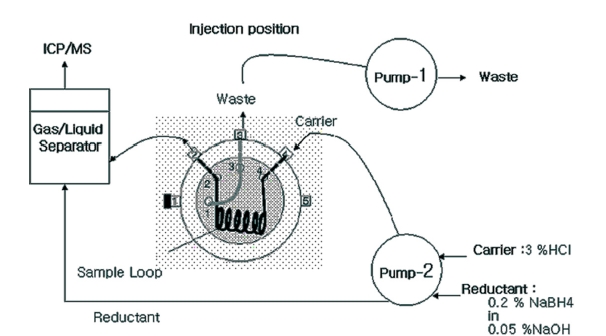
A flow injection device to produce hydride is shown in Figure 1. HCl solution (3%, w/w) was used as carrier with 9-12mL/min flow rate and 0.2% NaBH4/0.05% NaOH as reductant with 5-7mL/min flow rate was used in this study. Containing volume of sample loop was 500 μ;L. Gaseous mercury from gas/liquid separator was directly injected into ICP/MS through PTFE tubing (1/8 inch × 1m). In this step, flow rate of argon gas that was injected from argon nebulizer gas line was 1.0mL/min.
0.25 g BCR 176R fly ash was measured and taken into a Teflon reaction vessel of microwave digestion. Then some amount of concentrated isotope 200Hg was added into the measured sample. And the sample was decomposed after adding acid mixed solution A (8 mL HNO3 + 2 mL HCl + 2 mL HF) and acid mixed solution B (8 mL HNO3 +2mL HClO4 + 2 mL HF). In the microwave heating, the sample was decomposed at 120 ℃ for 5 min, 80 ℃ for 3 min, 180 ℃ for 10 min, 220 ℃ for 35 min, step by step.
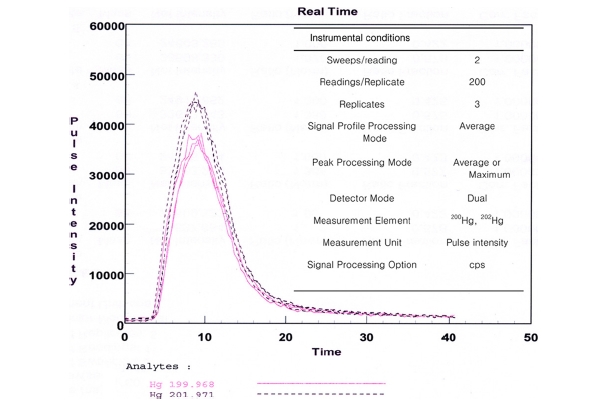
Typical signal and data acquisition conditions using the FI-CV-ICP/MS system is shown in Figure 2. This figure shows the three replicate signals for 1.0 ng/g of mercury solution. The introduction of mercury vapor into ICP-MS resulted in a single isotope sensitivity of 4.5 × 10⁴ counts·s?1 /ng·g?1 for 202Hg. The RSD of three replicates was within 0.5%. The reproducibility means significantly reduced memory compared with a traditional solution nebulization ICPMS.13
>
Repeatability for measurement of isotope ratio
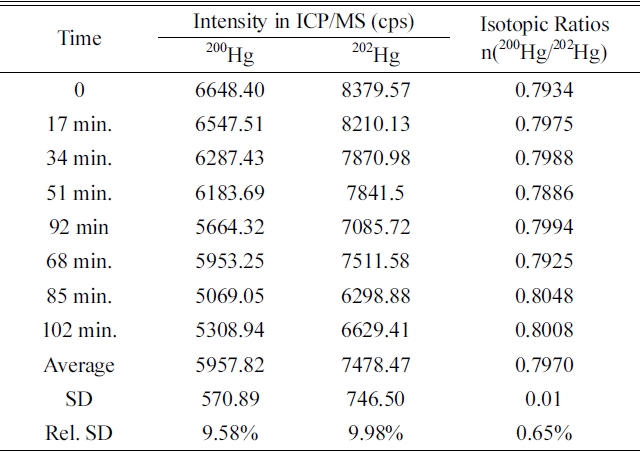
In this system, isotope ratio n(200Hg/202Hg) and intensity with eight times analysis for 102 min to investigate reproducibility of analysis of isotope ratio are shown in Table 1. The maximum and average mode of peak processing mode were used to investigate reproducibility using approximately 1.0 ng/g concentrated mercury sample. The relative standard deviation (RSD) of the intensity of the isotope 200Hg and 202Hg was high about 9-10%, but the RSD of the isotope ration(200Hg / 202Hg) was within the range of 0.65% at maximum mode and 0.85% at average mode

Repeatability of intensities and isotopic ratios of 200Hg and 202Hg in maximum peak processing mode of FI-CV-ICP/MS system (Concentration of Hg: 1.0 μg/kg).
based on the results.
>
Determination of Hg in fly ash by FI-CV-ID-ICP/MS method
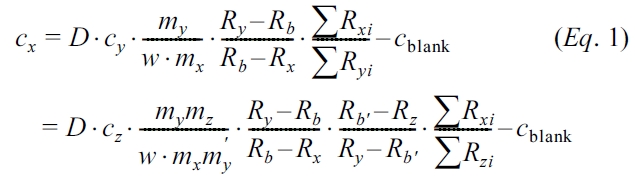
Each parameter of IDMS obtained from the following formulae is shown in Table 2.14
Hg content in standard samples, BCR176R (Fly ash from a city waste incineration plant) was determined by the isotope dilution method using the FI-CV-ICP/MS device. To use an isotope dilution method, the blend solution (blend b) was firstly prepared by adding some amount of enriched spike isotope (
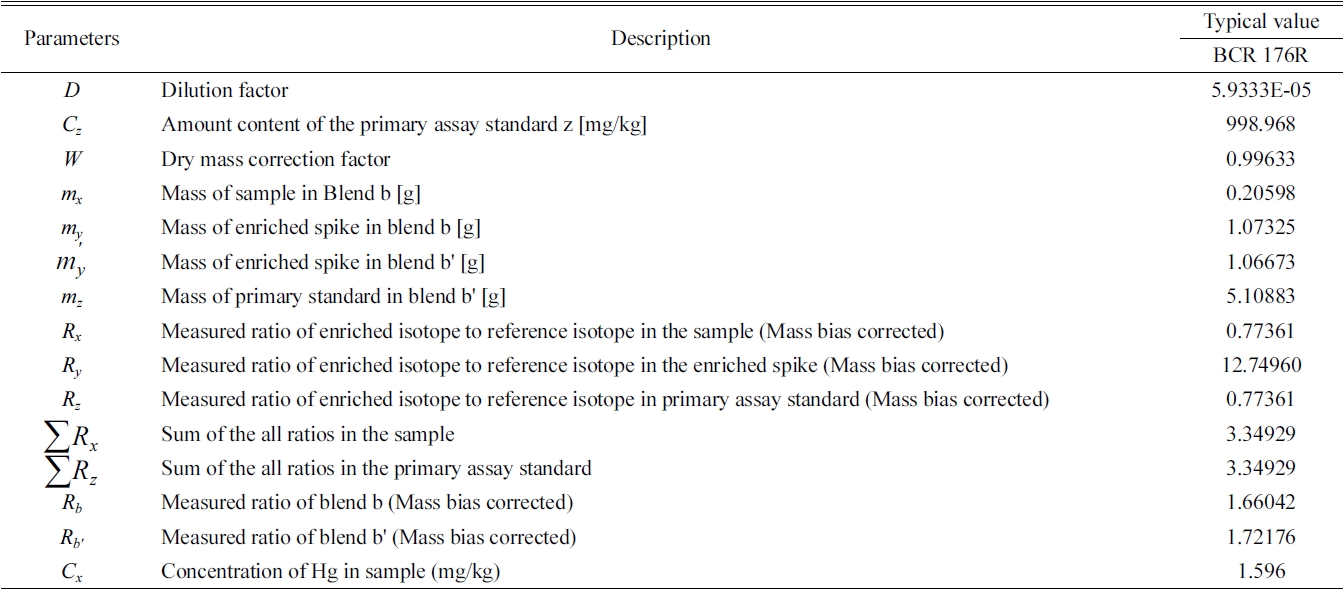
Typical value of each parameters of IDMS equation and the analytical results of Hg in BCR-176R fly ash.
[Table 3.] Analytical results of mercury in BCR-176R fly ash by FI-CV-ID-ICP/MS.
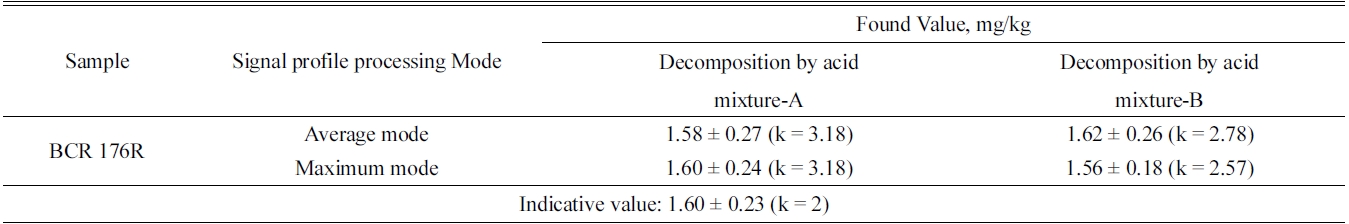
Analytical results of mercury in BCR-176R fly ash by FI-CV-ID-ICP/MS.
Representative values of each parameter and calculated concentration values by equation (
Dry mass determination of BCR176R fly ash sample was carried out by drying in ventilated oven at 105 ℃ for 3 hours, until constant weight is reached. Measured moisture content in

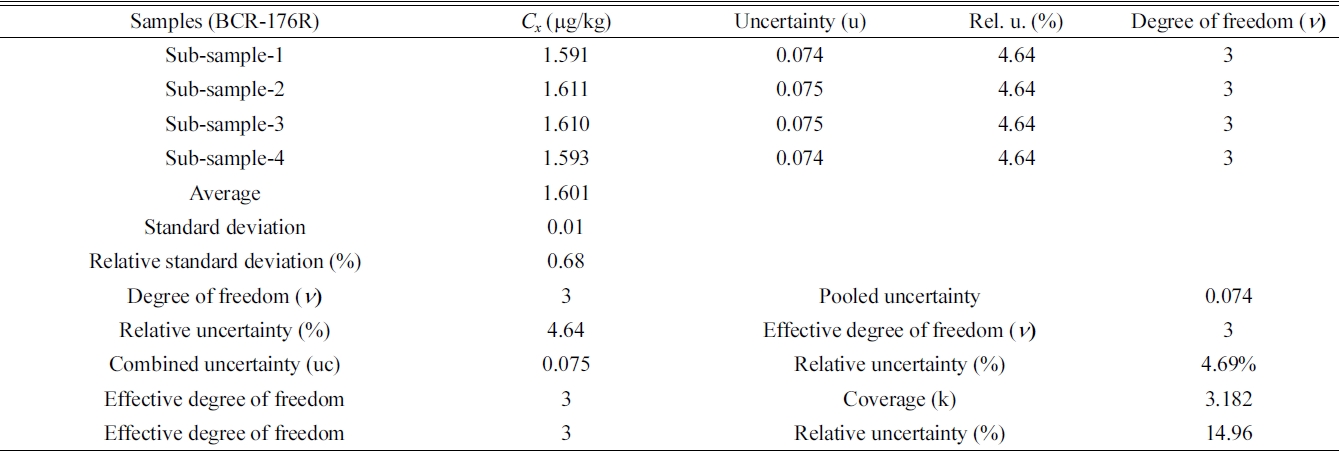
Summarize analytical results and calculation of combined and expanded uncertainty for Hg determination in BCR-176R by FI-CV-ID-ICP/MS.
0.25 g portions of BCR176R was 0.36% ± 0.02%, and the value of dry mass correction factor (
The analytical results of mercury in a BCR-176R fly ash by FI-CV-ID-ICP/MS are summarized in Table 3. The indicative value of Hg in BCR 176R fly ash was 1.60 ± 0.23 mg/kg (k = 2). The determined values of Hg in BCR 176R fly ash by the method described in this paper were 1.60 ± 0.24 mg/kg (k = 3.18) and the analysis results were in well agreement with the indicative value within the range of uncertainty.
>
Evaluation of measurement uncertainty
The typical example of the combined and expanded uncertainty calculation for Hg determination in BCR-176R by FI-CV-ID-ICP/MS are summarized in Table 4. In Sub-sample-1, concentration of mercury is (1.591 ± 0.074) mg/kg. Here, the uncertainty value, ± 0.074, of measurement is systematic uncertainty. Four sub-samples produced similar systematic uncertainty values. Table 4 shows average value of four subsamples, valid degree of freedom (
>
Linearity and limit of detection
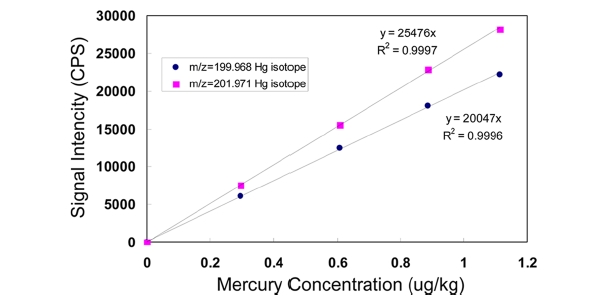
Validation processes for the proposed method were conducted as recommended by an international guide.17 In order to investigate the linearity and limit of detection for the proposed method, FI-ICP-MS signal intensities were examined as a function of mercury concentrations ranging from a 0.3 μ;g/kg to 1.11 μ;g/kg of 200Hg and 202Hg isotope. As shown in Figure 3, the values of
The limit of detection (LOD) for Hg concentrations using the proposed analytical system was determined based on the following criterion.18
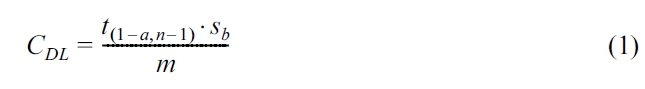
Where
The assigned value of the
approximately 0.008 μ;g/kg was obtained. And, for the 202Hg isotope, the slope of the calibration curves was 25476 cps per μ;g/ kg. With these values, the minimum detectable concentration,
FI-ID-CV-ICP/MS has been successfully developed and applied to the determination of mercury in fly ash sample. The determined value of Hg in BCR 176R fly ash by the method of FI-CV-ID-ICP/MS described in this paper was well agreed with indicative result within the range of uncertainty. The difference of analytical results between digestion methods used two different acid mixtures was negligible. And also the difference between average signal processing mode and maximum mode was insignificant. The use of this method described in this paper is a considerable advantage in that it affords complete separation of mercury from the HF treated sample matrix and much higher sensitivity than conventional sample introduction method and reduced memory effect.