Optical coherence tomography (OCT) is an emerging technology for non-invasive cross-sectional imaging of biomedical tissue samples [1]. It has been investigated for use in numerous applications, and thus, many types of system configurations have been developed. In most OCT systems, two beams are propagated to the reference arm and the sample arm and then re-coupled to produce an interfered optical signal [2,3]. The general configuration of these two separate arms has limited the application of OCT systems in endoscopic imaging because an arbitrary probe length is required to deliver the optical signal from the internal organ tissue to the optical imaging system, which exists outside the body.
Recently, a common-path OCT system based on fiber-optic autocorrelation has been developed in order to overcome the length, polarization, and dispersion mismatch between the reference and sample arms [4-7]. Since there is only one path in common-path OCT, the reference and sample signals are reflected separately from the partial reflecting probe and the sample, respectively, and they propagate back through a commonly shared optical path [8]. However, a critical problem with conventional common-path OCT is that the sample position distance between the reference and sample positions is limited. The interfered optical signal between the reference and sample signals can be detected only when the delay time is within the coherence time of the light source. If the delay time between the reference and sample signals is
In this research, we developed a novel method for post-tuning the optical path-length difference (OPD) between the reference and sample signals for an arbitrary location of the reference and sample positions [4]. We present a novel common-path OCT configuration by including an additional Mach-Zehnder interferometer in the post-path of the interfered optical signal. Both 1-D profiles and 2-D images obtained with this novel common-path OCT and the conventional common-path OCT are compared. The OCT image is implemented with a Fourier domain OCT (FD-OCT) system based on a wavelength-swept laser source and a balanced detector [9-13].
II. TUNING OF THE OPTICAL PATH LENGTH
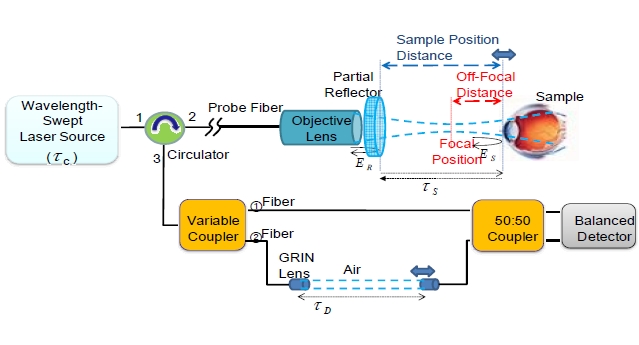
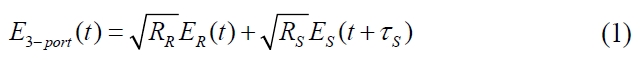
Fig. 1 shows a schematic of the novel common-path OCT system, in which the OPD is tuned by adding an extra interferometer in the post stage. A light beam from the wavelength-swept laser source propagates from the first port to the second port of the circulator and is transmitted through a probe fiber. The focused beam is reflected from the single-faced partial reflector and the sample, respectively. Then, it propagates to the third port of the circulator. Only one face of the partial reflector induces a small portion of the reflected light to act as the reference signal for the interferometer. The reference and sample signals share the common path of the fiber probe. There is a time delay,
where
In general, the axial imaging depth is determined by the OPD between the reference and the sample. Because of the finite spectral resolution of the spectrometer in spectral-domain (SD) OCT or the instantaneous linewidth of the wavelength-swept laser in swept-source (SS) OCT, an increase
in the OPD leads to decay of the signal-to-noise ratio (SNR) and limits the range of the axial depth. Thus, in conven-tional common-path OCT, the more closely positioned partial reflector can be interfered to the sample with higher visibility signal. On the other hand, the OCT image also depends on the reflected optical intensity from the sample, which becomes maximal when the sample is located at the focal position of the objective lens. However, this results in a decreased SNR from the sample because the distance at the focal position of the objective lens corresponds to the increased OPD in the common-path OCT system.
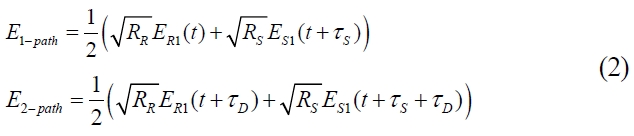
To solve the above dilemma of the sample position, whether it be closer to the partial reflector or closer to the focal position, we suggest the addition of a Mach-Zehnder interferometer including a variable coupler, a tunable optical delay line (ODL), and a 50:50 coupler in the post-path of the interfered optical signal, as shown in Fig. 1. The signal from the third port of the circulator enters a variable coupler and propagates separately in two fiber paths (①, ②). Then, those are combined at a 50:50 coupler. Therefore, the two terms on the right-hand side of equation (1) become four terms. When the splitting ratio of the variable coupler is 50%, the electric field along paths ① and ② can be mathematically expressed as
where
Therefore, we can show that the total electric field detected at one of the balanced photodiodes becomes
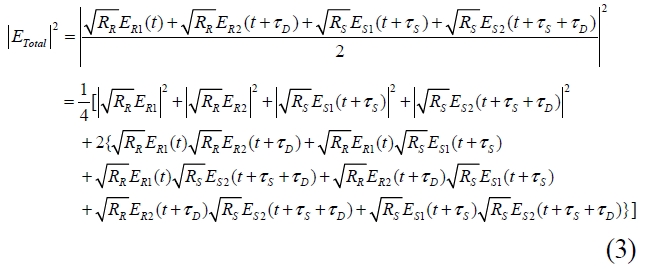
Among the combined terms with the reference and sample signals in the curly braces, it is clear that the term
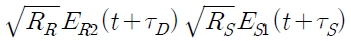
can be the final interference signal in the case of
This means that the post-tuning of the OPD in the additional Mach-Zehnder interferometer can induce the minimum OPD condition even when the sample is located at the focal position of the objective lens.
To determine the effect of the additional Mach-Zehnder interferometer, we can analyze the SNR of our proposed system. From the previous reports, SNR is defined as the signal power divided by the noise process variance [5,14-16].
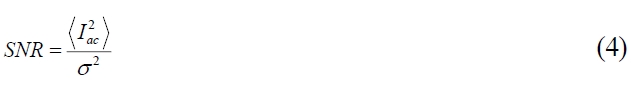
where

means the mean square signal photocurrent and
Using each mean photocurrent and noise variance in a conventional system and in our system, our proposed system shows theoretically 6 dB lower sensitivity than the conventional system [5,14-16]. However, our system is still promising because it provides flexible use of common-path probes by post-tuning of sample position distance. It means that this method is more suitable to obtain a clear cross sectional sample image at the long distance of sample position.
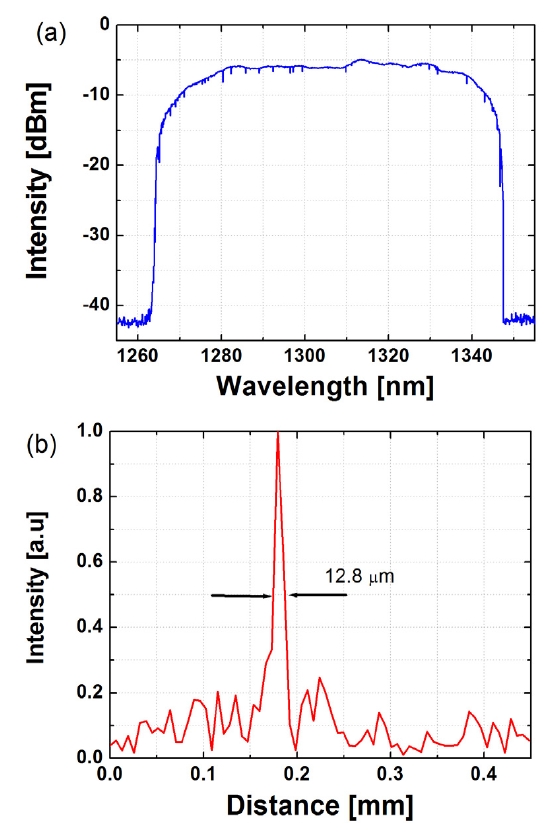
In this swept source OCT system, the output spectra from the wavelength-swept laser used is shown in Fig. 2(a). The laser has a fiber ring cavity configuration, with a semiconductor amplifier (SOA, InPhenix, Inc.), a piezo-actuated fiber Fabry-Perot tunable filter (FFP-TF, Lambda Quest, Inc.), an isolator, a polarization controller, and a fiber output coupler. The laser
output has a center wavelength of 1305 nm, a bandwidth of 80 nm, and an output power of 10 mW. As we used a Fourier-domain mode locked (FDML) swept laser with a 2.8 km delayed fiber in the ring cavity, a high repetition rate of 71.09 kHz is operated with stability. Fig. 2(b) shows the measurement result for an axial resolution of the OCT system processed by the Fourier transform of the acquired interferogram. The measured axial resolution is 12.8 μm at the OPD of 1.8 mm, which differs slightly from the theoretical value of 10 μm. It is thought that this difference can be attributed to the effect of dispersion introduced by the additional interferometer.
The objective lens, (model LSM03, magnification factor = x5, Thorlabs), has a focal length of 35.9 mm and a lens working distance of 25.1 mm. Its transverse resolution is estimated to be 25 μm from the mean spot size at the focal position. The partial reflector consists of two-sided glass. The antireflection-coated side has a reflectivity below 0.002, and the other side has a reflectivity of 0.05 and a transmittance of 0.95 in the 1300 ± 50 nm region. By posttuning the OPD, we could obtain OCT images, regardless of the distance between the partial reflector and the sample, within the long working distance of the objective lens. For the increased range of the sample position distance, the objective lens with lower magnification factor can be helpful to increase the working distance though the transverse resolution will be decreased.
An interferogram signal is detected by the balanced photodiode (model 1817, New Focus, USA), which has a band-width of 80 MHz, a trans-impedance gain of 50,000 V/A, and a responsivity of 0.8 A/W at 1300 nm. By dual balancing, the DC level is suppressed and no additional background subtraction is conducted. Acquired interferogram data are trans-ferred to a personal computer via a data-acquisition board (PCI-5124, National Instruments Corp., USA), which has a maximum sampling rate of 200 Msamples/s for the analog signal. Fast Fourier transformation is performed on the transferred data. To acquire a single cross-sectional image, a linear translation stage is driven with a saw-tooth waveform to provide transverse scanning over a 3 mm distance along the sample surface. General LabVIEW software is used to process the image.
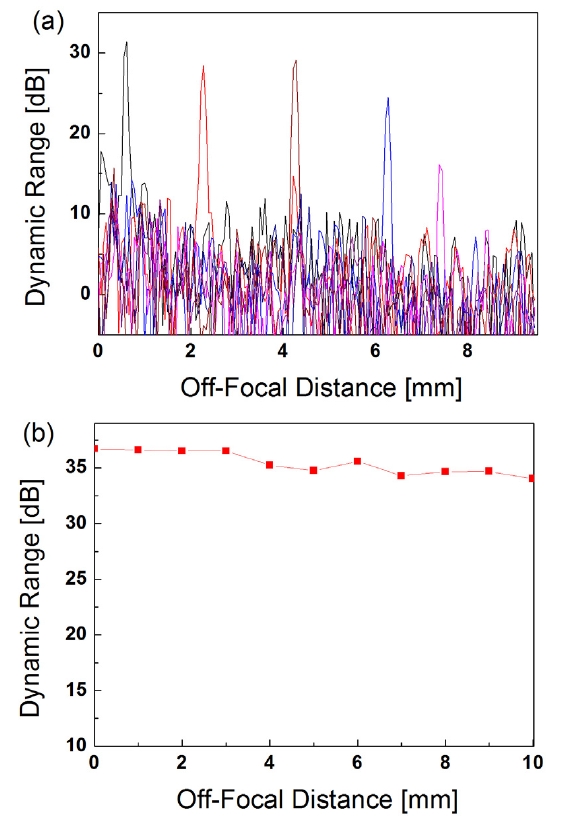
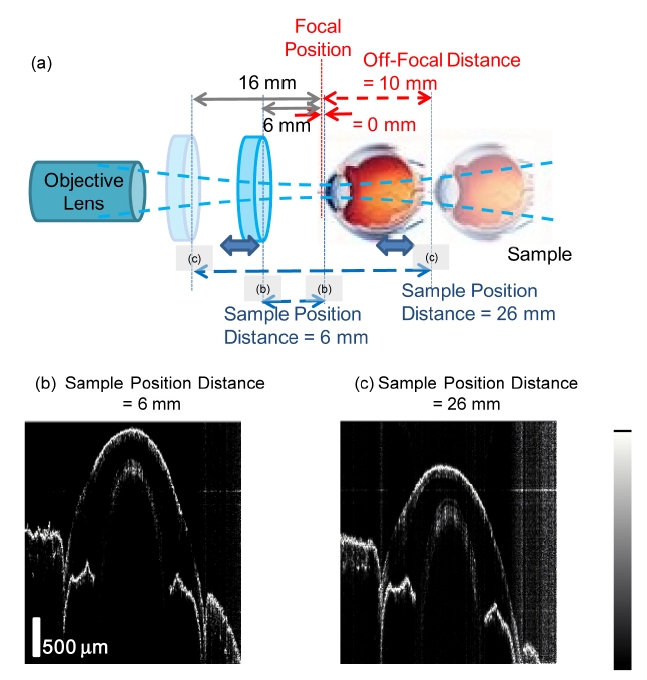
To discriminate between the absolute distance (sample position distance) and the relative distance (OPD) under the same conditions, we fixed the location of the partial reflector at 6 mm from the focal position, as shown in Fig. 1, by the repeated optimization process of the reference position for the maximized SNR [4]. Within the lens working distance of the objective lens, which is 25.1 mm, the position of the mirror sample is changed along the axial beam distance to measure a series of point-spread functions (PSFs). We call this distance between the focal position and the sample surface the “off-focal distance.”
First, for the conventional common-path OCT, the dynamic range roll-off is measured in Fig. 3 as the off-focal distance is changed incrementally. The off-focal distance range 0-9 mm corresponds to both “sample position distance” and “OPD” range of 6-15 mm because the interfered optical signal by the OPD is exactly the same with the sample position distance between the partial reflector and the sample in this conventional common-path OCT. The dynamic range is determined by the ratio of the PSF peak value and the noise level. The noise level is determined to be -5 dB by averaging the region between 0 and 9 mm. The system dynamic range drops rapidly Fig. 3(a), the dynamic range drops rapidly from 35.9 to 7.6 dB by increasing the off-focal distance from 0 to 10 mm. The 6 dB drop out is measured at off-focal distance of around 6 mm. As mentioned in the previous section, this rapid roll-off of 27.9 dB is due to two reasons. First, the finite sample number due to the thick instantaneous linewidth in the swept source leads to strong decay of the SNR for a deeper axial range of the incremental OPD. Second, the signal beam has weak reflectivity as the sample moves away from the focal position [9,10]. Therefore, when imaging with the conventional common-path OCT, the sample should be located as close as possible to the partial reflector at
around the focal position of the objective lens. These two requirements may restrict the available position of the sample significantly in the limited range.
In Fig. 3(b), for the purpose of comparison, the dynamic range is measured again using the novel common-path OCT setup by locating the mirror sample at the same off-focal distances from 0 to 9 mm. At every off-focal distance, the extra delay time,
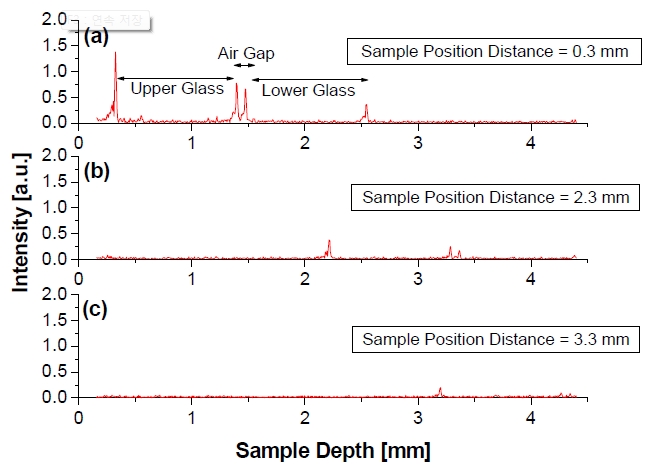
Dynamic range can also be compared for various samples by using the conventional and novel common-path OCT systems. Fig. 4 shows the depth profiles of a sample consisting of two slide glasses acquired at different sample position distances between the partial reflector and the sample using a conventional common-path OCT system. When the top surface of the sample is positioned close to the partial reflector at 0.3 mm (Fig. 4(a)), we can observe the two glasses and the air gap between them clearly. As the sample position distance increases, the image quality is strongly degraded because of the dynamic range roll-off. When the distance between the partial reflector and the top surface of the sample becomes more than 3.3 mm, the top surface of the upper glass can be monitored with difficulty, the other surfaces not at all. It means that there is no way to get a good-quality image in the conventional common-path OCT system without positioning the sample close to the partial reflector.
For the additional comparison with a cross sectional OCT imaging, the biological sample of a fish eye (
focal position as shown in Fig. 5 (a), the inner structure of eye sample can be clearly observed as shown in Fig. 5 (b). For the estimate the maximum available range of sample position distance, we moved the partial reflector toward the objective lens and the sample in the opposite direction, simultaneously, up to 10 mm for both sides. As the sample moves away from the reference position, we also increase the extra delay time,
We have developed a novel method for post-tuning the sample position distance in a common-path OCT system by including an additional Mach-Zehnder interferometer in the post-path of an interfered optical signal. From the experimental results of post-imaging depth tuning, the dynamic roll-off of the system is reduced to be as low as 2.7 dB during 10 mm axial scanning. This can solve the positioning problem for the objective lens, partial reflector, and sample in the conventional common-path OCT system. The proposed method may allow for greater flexibility in the use of OCT systems in endoscopic applications.