검색 전체 메뉴
PDF
맨 위로
OA 학술지
Horizontal-parallax-only Optical Scanning Holography with an Electronic Low-pass Filter
  • 비영리 CC BY-NC
  • 비영리 CC BY-NC
ABSTRACT
Horizontal-parallax-only Optical Scanning Holography with an Electronic Low-pass Filter
KEYWORD
Optical scanning holography , Horizontal-parallax-only holography , Low pass filter
  • I. INTRODUCTION

    Holography has a long-standing history in three-dimensional (3-D) display. For recent years, 3-D display based on digital holography has emerged as a potential candidate for real 3-D display of moving pictures. It is well known that an enormous amount of data is required for eventual holographic three-dimensional (3D) displays. The horizontal parallax only (HPO) hologram has been proposed as an excellent way to reduce the amount of required data for 3D electroholographic display [2-6]. However, digital hologram 3D display systems are limited in displaying computer-synthesized images of certain fictitious 3D objects. HPO optical scanning holography (OSH) has recently been proposed as an electrooptical technique that records the HPO hologram of real objects by a single two dimensional (2-D) scanning [7]. However, the proposed HPO-OSH requires truncation of scanning beam with a horizontal slit, which reduces the energy efficiency, and the slit size that determines the resolution of reconstructed image along the vertical direction is also restricted by the depth range of the object [7]. Most recently, in order to overcome drawback of the previously proposed HPO-OSH, an algorithm that converts full parallax holograms into HPO holograms has been proposed [8,9], such that the full parallax complex hologram of a real object is recorded and then converted to a HPO hologram digitally. However, since the proposed technique requires recording a full parallax hologram, recording time and recorded data amount are not reduced. In addition, this also requires additional digital post processing. Proposed in this paper is a novel technique that records a HPO hologram of a real object using OSH without beam truncation and additional digital processing. In the proposed technique, we invert the order of Raster scan lines and filter the fringes along the vertical direction with an electronic low pass filter.

    II. HPO-OSH WITH AN ELECTRONIC FILTER

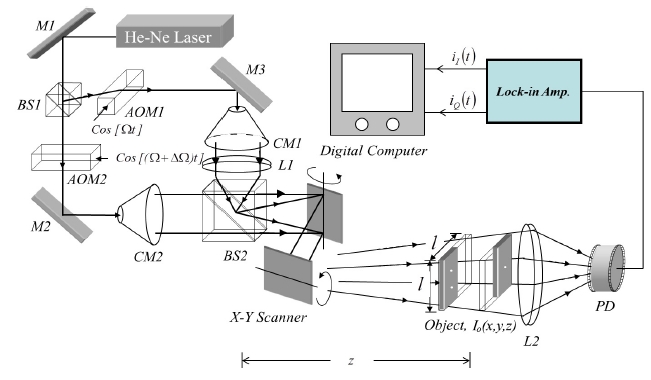
    In this section, we propose a novel technique that generates an HPO hologram using OSH with an electronic low pass filter. This generates an HPO hologram of a real object without digital post-processing. First, we briefly review a conventional OSH. The conventional OSH shown in Fig. 1 is composed of a time dependent Fresnel zone plate (TDFZP) generating unit and an electronic demodulation unit. The TD-FZP generating unit consists of a Mach-zehnder interferometer equipped with Acousto-optic modulators (AOM1,2),

    collimators (CM1, CM2) and focusing lens (L1). The AOM1,2 are driven by Ω and Ω+ΔΩ, and thus the interfered beam at a beam splitter BS2 beats with the frequency difference, ΔΩ. The focusing lens (L1) with a collimator (CM1) in the down path generates a spherical wave, and the collimator (CM2) in the upper path generates a plane wave. The spherical wave and the plane wave interfere at BS2. The spatial distribution of the interfered beam at BS2 becomes a Fresnel zone plate (FZP). The interfered beam with a spatial distribution of FZP also beats according to time, and thus we call the interfered beam TD-FZP. The TD-FZP is given by: [8]

    image

    where NA represents the numerical aperture defined as the sine of the half-cone angle subtended by the TD-FZP, λ is the wavelength of the laser beam. The TD-FZP scans an object, I0 (x, y, z), by Galva scanning mirrors in a Raster scanning scheme as shown in Fig. 2 (a, b). The transmitted light through the object is spatially integrated by collecting lens (L2). The spatially integrated light is then converted into electric current by a photo-detector (PD). The electric current is subsequently demodulated by a dual output lock-in amplifier. In- and Quadrature phase demodulated signals (iI(t), iQ(t)) generated by the lock-in amplifier are stored in a digital computer after analog to digital conversion. The stored digital signals are rearranged according to scan position (x(t), y(t)) as shown in Fig. 2 (a, b). The rearranged two dimensional matrixes denoted by iI(x, y) and iQ(x, y) become the real and imaginary parts of the full parallax complex hologram. In a digital computer, the full parallax complex hologram is constructed subsequently by adding the real and imaginary parts of the hologram in the following manner [8,10]:

    image

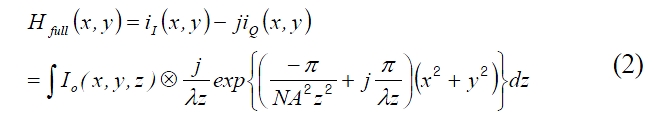
    where the symbol ? denotes the 2-D convolution operation defined as g1(x, y)? g2 >(x, y) = ∬ g1(x' , y')g2 (x ? x' , y ? y')dx' dy' . Note that the complex hologram recorded by the conventional OSH is an encoded pattern between the object, Io(x, y, z), and FZP that has symmetric extent along vertical and horizontal directions. In contrast, the horizontal parallax-only hologram is an encoded pattern between the object, Io(x, y, z) and one dimensional (1-D) FZP. In what follows, we propose HPO-OSH, generating an encoded pattern between the object, Io(x, y, z) and 1-D FZP.

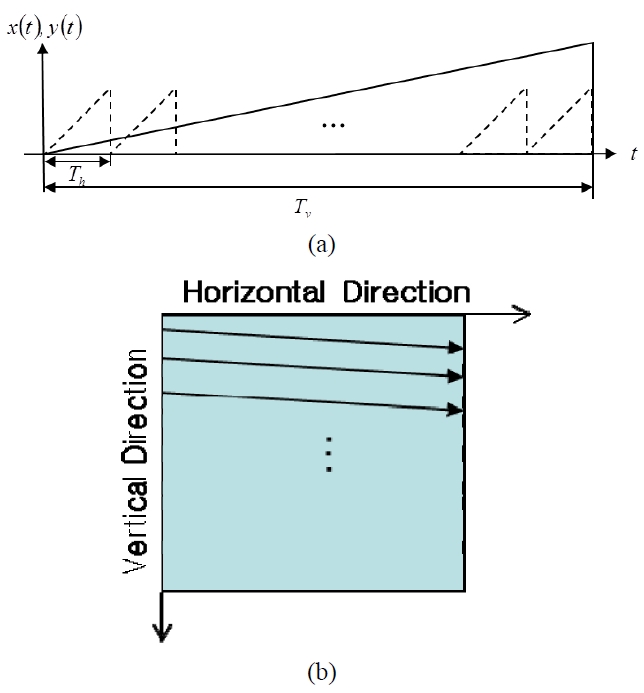
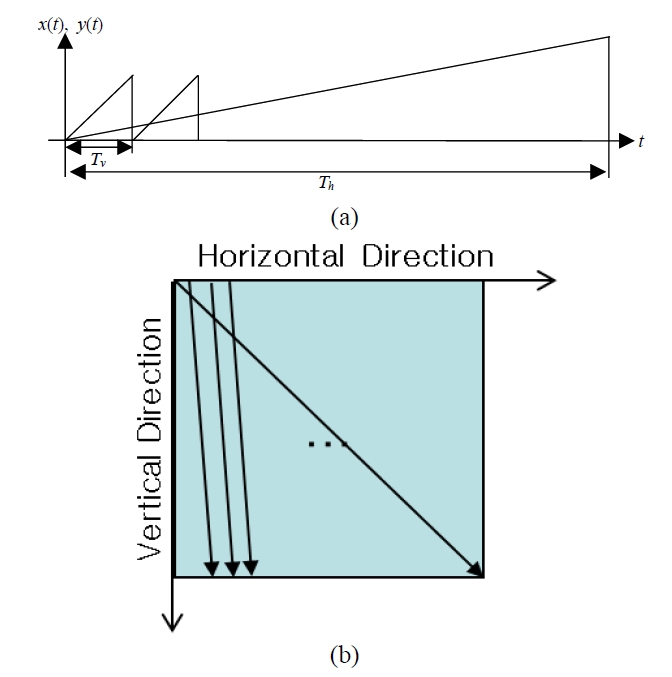
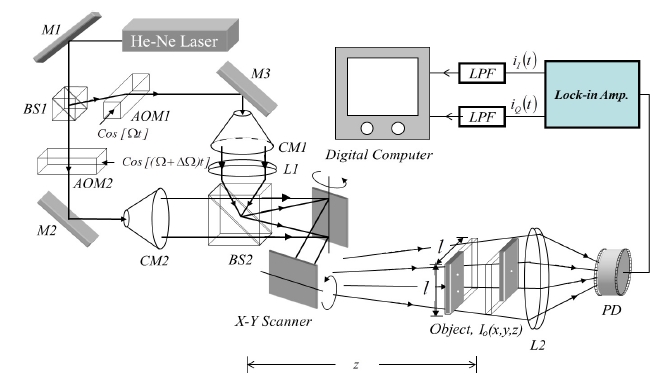
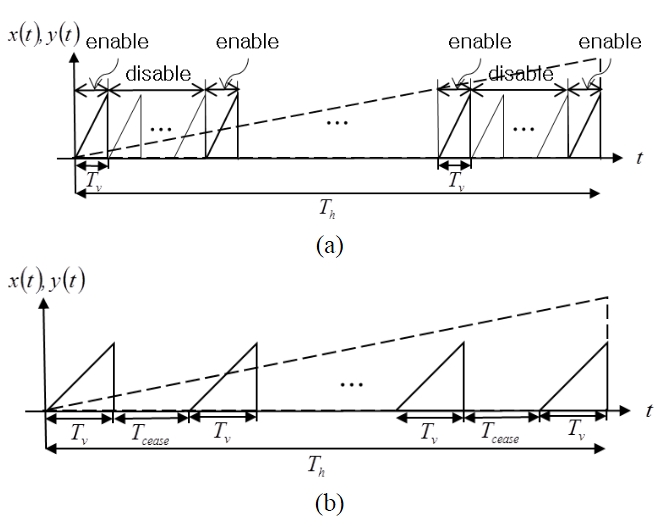
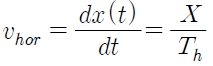
    The proposed HPO-OSH shown in Fig. 3 scans the object in an inverted Raster scan scheme as shown in fig. 4 (a, b). Unlike the conventional Raster scan scheme, the inverted Raster scan scheme scans an object along the vertical direction before the horizontal direction. This makes the moving speed of the scanning beam along the vertical direction faster than in the horizontal direction. Figure 4 (a, b) shows the scan lines and locus of the scanning beam along the vertical and horizontal directions. The vertical and horizontal locations of the scanning beam are denoted by x(t) and y(t) according to scanning instance. In Fig. 4 (a), the solid and dashed lines denote scan lines along the horizontal and vertical directions. Since the extent of the TD-FZP is limited by numerical aperture (NA), the spatial frequency of the TD-FZP is also limited by

    image

    [11]. When the TD-FZP scans the object with speed of

    image

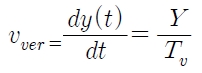
    along the vertical direction, where Y and Tv are the scanning length and time along the vertical direction as illustrated in fig. 4(a), the maximum temporal frequency of the electric current outputs of the lock-in amplifier becomes:

    image

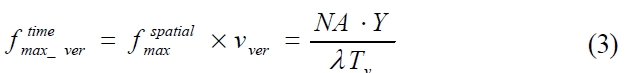
    Whereas, since the scanning speed along the horizontal direction is

    image

    where X and Th are the scanning length and time along the horizontal direction as illustrated in Fig. 4 (a), the maximum frequency of the electric current outputs of the lock-in amplifier becomes:

    image

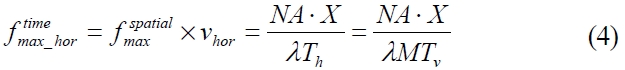
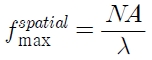
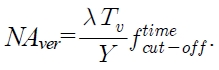
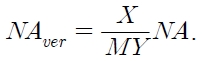
    where M is the number of vertical scans per one horizontal scan in the inverted Raster scan pattern. Note that the maximum frequency of the electric current according to vertical scan is M times greater than according to horizontal scan. This asymmetry of frequency output about the scanning directions is due to the inverted Raster scan scheme consisting of M vertical scans with a single horizontal scan. We can reduce the vertical extent of the FZP by using this asymmetry. First, we connect the outputs of the lock-in amplifier to the electric low pass filters (LPF1,2), and then we set the cut off frequency of the LPF1,2 greater than Eq. (4) and smaller than Eq. (3). Since we set the cut-off frequency greater than Eq. (3), the NA along the horizontal direction is preserved, whereas the NA along the vertical direction is reduced to

    image

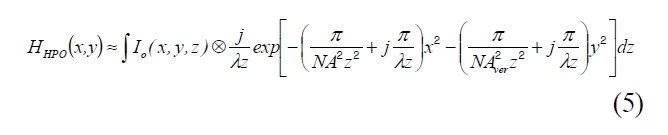
    The outputs of LPF1,2 are stored in a digital computer after analog-todigital conversion. The stored digital signals are rearranged according to the inverted Raster scan as shown in fig. 4 (a,b). The rearranged two dimensional matrixes become real and imaginary parts of the HPO complex hologram. In a digital computer, the HPO complex hologram is subsequently constructed by adding the real and imaginary parts of the hologram:

    image

    Since we set the cut-off frequency of the low pass filter at higher than the maximum frequency of the current outputs according to horizontal scanning in order to maintain horizontal parallax, the minimum numerical aperture along the vertical direction that determines the vertical extent of FZP is given by

    image

    However, we can decrease the vertical extent as small as we desire by using the following strategies. One is to control the enabling and disabling of the data acquisition operation, in which we disable the data acquisition during disable period as shown in fig. 5(a) while the scanning performs. The other is to create a ceasing period where we cease the data acquisition and vertical scanning as shown in fig. 5 (b). This makes the number of vertical scans, M as large as we desire without

    increasing amount of acquired data. Thus, the arbitrary data reduction rate can achieved by

    image

    where NFull and NHPO are the required number of samples for full parallax and HPO holograms, respectively [8,9].

    III. EXPERIMENTAL RESULTS

    We record the hologram of an object that is composed of three points on two slides using the proposed HPO-OSH (see Fig. 3). The depth distance between the two slides is 20 cm. The diameter of the points is 200 μm, and the two points are separated by 4 mm. We scan the object with the inverted Raster scan pattern with M=500 vertical scans per one horizontal scan. The scanning time along the vertical and horizontal directions are Tv =0.04s and Th =20s, respectively, and the scanning area is X × Y=8.6 mm× 8.6 mm. The scanning beam is generated by the interference between the plane wave and the spherical wave formed by the focusing lens L1 in fig. 3. Here, the diameter of the collimated beam is D=18 mm, the focal length of the lens L1 is f = 500 mm and the wavelength of the scanning beam is λ=532 nm. Thus, the NA of the recorded full parallax complex hologram becomes NA?D/(2f)=0.018. We record the HPO complex hologram with an electronic low pass filter with cut-off frequency,

    image

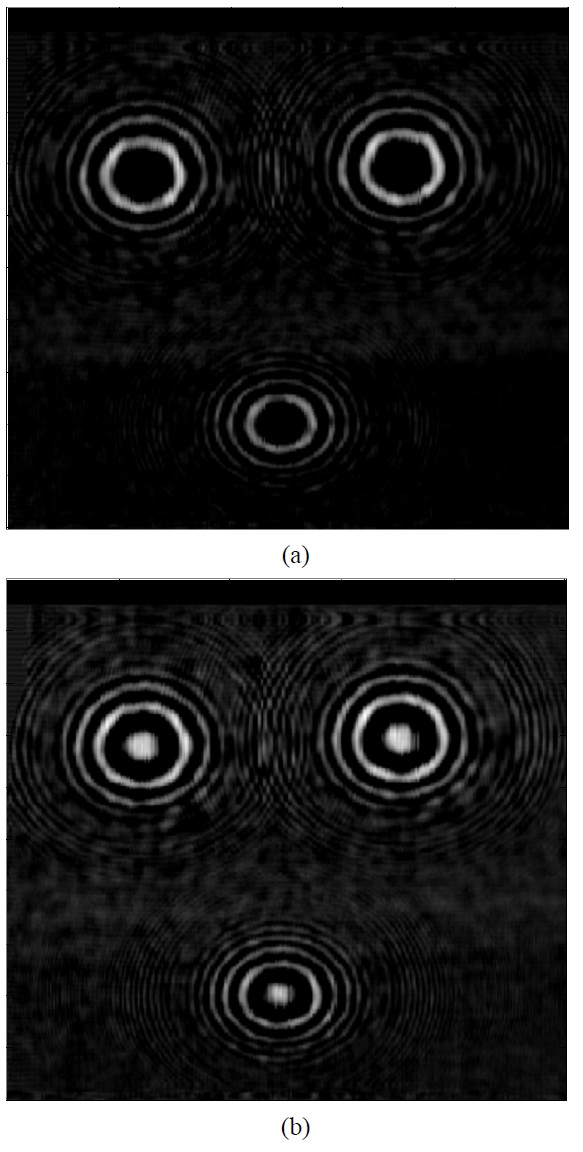
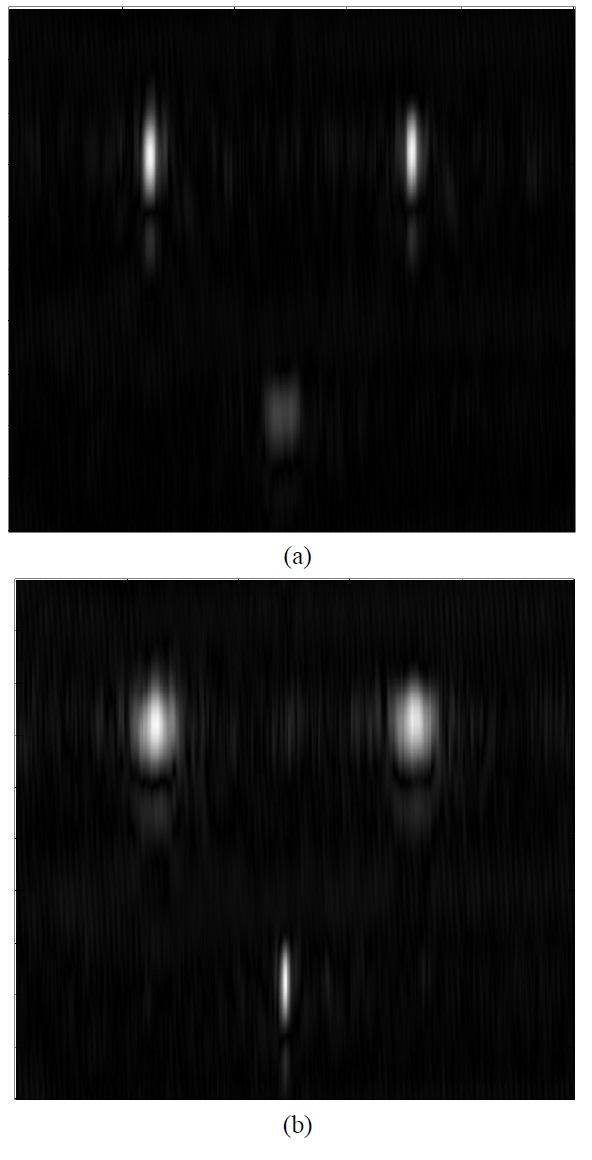
    The real and imaginary parts of the recorded HPO complex hologram are shown in figs. 6 (a, b). Compared to the full parallax hologram recorded by the conventional OSH shown in fig. 7 (a, b), the recorded HPO hologram does not contain fringes along the vertical direction as the HPO hologram converted by digital post processing [8,9]. Since we scan an object along vertical direction before

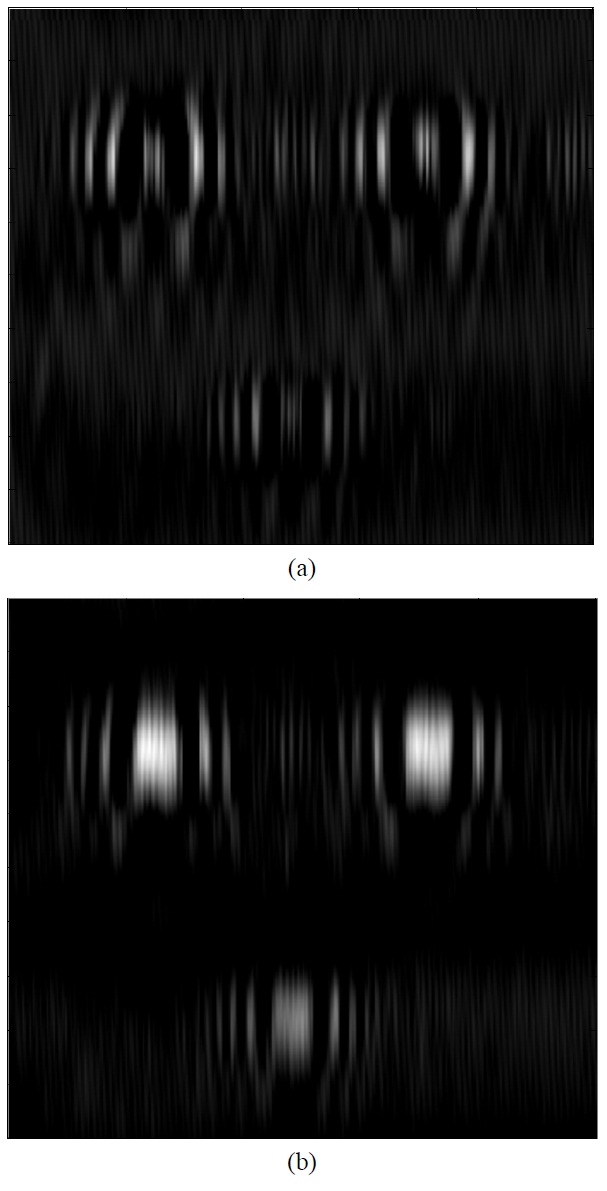
    horizontal direction in the proposed HPO-OSH, vertical fringes contributes high frequency components of the current output. Thus the electronic low pass filter that cuts the high frequency components removes the fringes along the vertical direction. The NA along the vertical direction of the HPO hologram becomes

    image

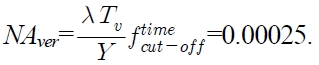
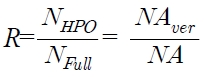
    The data reduction ratio is given by

    image

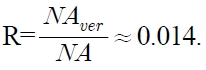
    We numerically reconstruct the HPO complex hologram by convolving the HPO hologram with the free space impulse response at each focused locations of the slides. Clearly, the reconstructed points at each focused locations shown in fig. 8 (a, b) are spread along the vertical direction. This shows that the vertical fringes of the HPO-hologram are removed. As vertical fringes are removed in an HPO hologram, viewing

    angle along the vertical direction is also reduced. In order to increase the viewing angle in reconstruction of an HPOhologram, a vertical diffuser or a cylindrical lens is used in reconstruction stage [2,4-7].

    IV. CONCLUSION

    We have proposed a novel HPO-OSH technique without digital post processing in which the HPO complex hologram of a real object is recorded by OSH operating in an inverted Raster scan scheme with an electronic low-pass filter. Since electronic low-pass filtering is an analog real-time process, the HPO complex hologram is recorded via single 2-D scanning without recording a full parallax hologram or any additional digital processing [7-9]. This saves recording and processing time and thus gives potential for a real-time

    3-D holographic imaging system in which the HPO complex hologram is recorded and reconstructed in real time.

참고문헌
  • 1. Leith E., Upatnieks J., Hildebrand, K., Haines K. (1965) “Requirements for a wavefront reconstruction television facsimile system” [J. SMPTE] Vol.74 P.893-896 google
  • 2. Hilaire P. S., Benton S. A., Lucente M. (1992) “Synthetic aperture holography: a novel approach to three-dimensional displays” [J. Opt. Soc. Am. A] Vol.9 P.1969-1977 google
  • 3. Yamaguchi T., Okabe G., Yoshikawa H. (2007) “Real-time image plane full-color and full-parallax holographic video display system” [Opt. Eng.] Vol.46 P.125801-1-125801-8 google
  • 4. Ito T., Shimobaba T., Godo H., Horiuchi M. (2002) “Holographic reconstruction with a 10-μm pixel-pitch reflective liquidcrystal display by use of a light-emitting diode reference light” [Opt. Lett.] Vol.27 P.1406-1408 google
  • 5. Stanley M., Smith M. A., Smith A. P., Watson P. J., Coomber S. D., Cameron C. D., Slinger C. W., Wood A. D. (2004) “3D electronic holography display system using a 100- megapixel spatial light modulator” [Proc. SPIE] Vol.5249 P.297-308 google
  • 6. Lucente M. (1994) “Diffraction-specific fringe computation for electro-holography” google
  • 7. Poon T.-C., Akin T., Indebetouw G., Kim T. (2005) “Horizontalparallax- only electronic holography” [Opt. Express] Vol.13 P.2427-2432 google
  • 8. Kim T., Kim Y. S., Kim W. S., Poon T.-C. (2009) “Algorithm for converting full-parallax holograms to horizontal-parallaxonly holograms” [Opt. Lett.] Vol.34 P.1231-1233 google
  • 9. Kim Y. S., Kim T., Poon T.-C., Kim J. T. (2011) “Threedimensional display of a horizontal-parallax-only hologram" [Appl. Opt.] Vol.50 P.B81-B87 google
  • 10. Poon T.-C., Kim T., Indebetouw G., Wu M. H., Shinoda K., Suzuki Y. (2000) “Twin-image elimination experiments for three-dimensional images in optical scanning holography” [Opt. Lett.] P.215-217 google
  • 11. Poon T.-C., Kim T. 2002 “Information display with optics” in Introduction to Information Optics P.617-664 google
이미지 / 테이블
  • [ FIG. 1. ]  Optical Scanning Holography (M1,2,3: mirrors, BS1,2: beam splitters, CM1,2: collimators, AOM1,2: Acoustooptic modulators, PD: photo-detector,L1,2: Lens).
    Optical Scanning Holography (M1,2,3: mirrors, BS1,2: beam splitters, CM1,2: collimators, AOM1,2: Acoustooptic modulators, PD: photo-detector,L1,2: Lens).
  • [ FIG. 2 ]  (a) Raster scan lines (Th: time interval along the horizontal direction, Tv: time interval along the vertical direction, : scan location along the horizontal direction, x(t): scan location along the vertical direction, solid line: vertical scan line, dashed line: horizontal scan line). (b) Locus of Raster scanning pattern.
    (a) Raster scan lines (Th: time interval along the horizontal direction, Tv: time interval along the vertical direction, : scan location along the horizontal direction, x(t): scan location along the vertical direction, solid line: vertical scan line, dashed line: horizontal scan line). (b) Locus of Raster scanning pattern.
  • [ FIG. 3. ]  Horizontal Parallax Only Optical Scanning Holography with an electronic low pass filter (M1,2,3: mirrors, BS1,2: beam splitters, CM1,2: collimators, AOM1,2: Acoustooptic modulators, PD: photo-detector, LPF: electronic low pass filter,L1,2: Lens).
    Horizontal Parallax Only Optical Scanning Holography with an electronic low pass filter (M1,2,3: mirrors, BS1,2: beam splitters, CM1,2: collimators, AOM1,2: Acoustooptic modulators, PD: photo-detector, LPF: electronic low pass filter,L1,2: Lens).
  • [ FIG. 4. ]  (a) Inverted Raster scan lines (Th, Tv: time interval along horizontal and vertical directions, X, Y : scan width along the horizontal and vertical direction, x(t), y(t): scan locations along the horizontal and vertical directions, solid line: vertical scan line, dashed line: horizontal scan line). (b) Locus of the inverted Raster scanning pattern.
    (a) Inverted Raster scan lines (Th, Tv: time interval along horizontal and vertical directions, X, Y : scan width along the horizontal and vertical direction, x(t), y(t): scan locations along the horizontal and vertical directions, solid line: vertical scan line, dashed line: horizontal scan line). (b) Locus of the inverted Raster scanning pattern.
  • [ FIG. 5. ]  (a) Enable and disable of data acquisition (Th, Tv: time interval along horizontal and vertical directions ). (b) Ceasing of vertical scanning (Tv, Tcease : time interval along vertical direction and ceasing time interval).
    (a) Enable and disable of data acquisition (Th, Tv: time interval along horizontal and vertical directions ). (b) Ceasing of vertical scanning (Tv, Tcease : time interval along vertical direction and ceasing time interval).
  • [ FIG. 6. ]  (a) Real part of the HPO complex hologram. (b) Imaginary part of the HPO complex hologram.
    (a) Real part of the HPO complex hologram. (b) Imaginary part of the HPO complex hologram.
  • [ FIG. 7. ]  (a) Real part of the full parallax hologram. (b) Imaginary part of the full parallax hologram.
    (a) Real part of the full parallax hologram. (b) Imaginary part of the full parallax hologram.
  • [ FIG. 8. ]  (a) Reconstructed image at the front slide. (b) Reconstructed image at the back slide.
    (a) Reconstructed image at the front slide. (b) Reconstructed image at the back slide.
(우)06579 서울시 서초구 반포대로 201(반포동)
Tel. 02-537-6389 | Fax. 02-590-0571 | 문의 : oak2014@korea.kr
Copyright(c) National Library of Korea. All rights reserved.