The Ti-Ni binary alloys show two kinds of thermoelastic martensitic transformation: B2 (cubic)-R (trigonal) and B2-B19' (monoclinic). The B2-R transformation is known to be suitable for highly sensitive actuator applications due to its small transformation hysteresis. Several methods for inducing the B2-R phase transformation in Ti-Ni alloys have been developed. Thermo-mechanical treatment of near equiatomic Ti-Ni alloys induces the B2-R transformation through by inducing high-density dislocations [1,2]. Aging of Ni-rich Ti-Ni alloys also induces the B2-R transformation by forming matrix-coherent Ti3Ni4 precipitates [3-5]. The addition of a third element such as Fe, Al, Mo, Cr, and Co to an equiatomic Ti-Ni alloy induces B2-R transformation [6-9]. Rapid solidification induces the B2-R phase transformation by forming matrix-coherent Ti2Ni particles and introducing high-density dislocations [10].
Ti-Ni alloys are usually subjected to various hot/cold working and heat treatment processes when they are manufactured into actuators. The R phase, which is induced by thermo-mechanical treatment and aging has relatively low thermal stability, disappears when Ti-Ni alloys are exposed to temperatures >873 K because most dislocations are eliminated by recrystallization [11]. The R phase induced by aging disappears when Ti-Ni alloys are exposed to temperatures >873 K because Ti3Ni4 particles grow and lose matrix coherence [12]. Therefore, it is desired to increase thermal stability of the R phase in Ti-Ni alloys from a practical point of view. The R phase induced by the third element addition method shows high thermal stability and it is preserved even after solution treatment at 1,073-1,173 K [6-9]. However, the
thermal stability of the R phase induced by rapid solidification is not yet known. In this study, therefore, the B2-R phase transformation was induced by rapid solidification of a Ti-47.3Ni (at%) alloy, and the microstructural characteristics and thermal stability of the R phase were then investigated.
A Ti-47.3Ni (at%) pre-alloy was prepared by arc melting. Billet charges of approximately 15 g cut from the pre-alloys were placed into quartz crucibles and the chamber of the melt spinning system was pumped down to >1 × 10⁻³ Pa before re- melting. After the re-melting, it was ejected through the nozzle on the outer surface of the rotating copper quenching wheel. The melt spinning temperature and the linear velocity were 1,703 K and 31 m/s, respectively. The obtained ribbons were annealed at temperatures in the range of 673 K and 1,223 K for 3.6 ks in a vacuum. After the heat treatments, samples for differential scanning calorimetry (DSC), X-ray diffraction (XRD), and transmission electron microscopy (TEM) were cut from the ribbons and then electropolished using an electrolyte of 95% CH3COOH and 5% HClO4 (vol%) in volume.
Transformation behavior and temperatures were investigated by means of DSC and XRD. DSC measurements were made using TA-DSC with a cooling and heating rate of 0.17 K/s. XRD experiments were made using CuKα with successively changing experimental temperatures. Microstructures were investigated with TEM observation using JEOL-2010 at an accelerating voltage of 200 kV. Thin foils for TEM observation were prepared using the twin-jet method with an electrolyte of 97% CH3COOH and 3% HClO4 in volume.
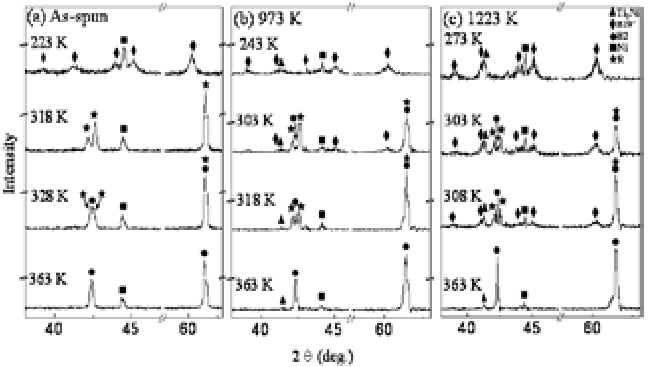
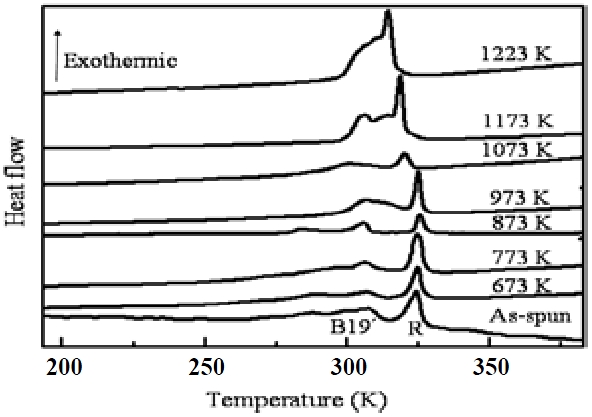
Figure 1 shows the DSC cooling curves of as-spun and annealed Ti-47.3Ni (at%) alloy ribbons. Annealing temperatures are designated in the figure. Multi exothermic DSC peaks are observed in all ribbons. To explain the DSC curves, XRD experiments were performed on the ribbons, the typical patterns of which are shown in Fig. 2. In the XRD pattern of as-spun ribbon, at 363 K, diffraction peaks corresponding to the B2 parent phase were observed in addition to those of Ni, which was used as a sample holder. Upon cooling of the ribbon, at 328 K, diffraction peaks of the R phase started to appear, meaning that the B2-R transformation started to occur. On further cooling, at 318 K, the
intensity of the diffraction peaks of the R phase increased while the diffraction peaks of the B2 phase disappeared, meaning that the B2-R transformation was finished. On further cooling, at 223 K, diffraction peaks of the B19' martensite were observed, while those of the R phase disappeared, meaning that the R-B19' transformation occurred. The DSC peak designated by R in the curve of as-spun ribbon was, therefore, attributed to the B2-R transformation, while that designated by B19' was attributed to the R-B19' transformation. It is noteworthy that the R-B19' transformation starts to occur after the B2-R transformation is finished. The DSC peak associated with the R-B19' transformation seems to be divided into two peaks, which is possibly due to a structural difference between the wheel side and the free side of the ribbons. Similar results due to microstructural heterogeneity were reported in Ti-Ni and Ti-Ni-Cu alloy ribbons [13,14].
In the XRD pattern of the ribbon annealed at 973 K, diffraction peaks corresponding to B2 and Ti2Ni appeared in addition to Ni in the pattern obtained at 363 K. On cooling, at 318 K, diffraction peaks of the R phase were observed, while the intensity of the diffraction peaks of the B2 phase decreased. On further cooling,at 303 K, diffraction peaks of the B19' martensite, B2, and R phases were observed simultaneously, meaning that the R-B19' transformation starts before the B2-R transformation is finished. On further cooling, at 243 K, the intensity of diffraction peaks of the B19' transformation increases, while those of the B2 and R phases disappear. Comparing Figs. 2(a) and (b), we found that diffraction peaks of Ti2Ni are observed in the latter but not in the former. In fact, Ti2Ni particles are observed in as-spun ribbons as shown in Fig. 3. The absence of diffraction peaks of Ti2Ni particles in Fig. 2(a) is attributed to the fact that their small size (<20 nm) to build up clear XRD peaks. A similar result was reported in rapidly solidified Ti-Ni based alloys [15].
In the XRD pattern of the ribbon annealed at 1,223 K, diffraction peaks of the B2 and Ti2Ni appeared in addition to Ni as seen in the pattern obtained at 363 K.
On cooling, at 308 K, diffraction peaks of the B2, R, and B19' appeared simultaneously, meaning that the B2-R and R-B19' transformations occurred almost concurrently. On further cooling, at 303 K, the intensity of the diffraction peaks of the B19' martensite increased, while those of the B2 and R phases decreased. On further cooling, at 273 K, the intensity of the diffraction peaks of the B19' increased, while those of the B2 and R phases disappeared. Therefore, we concluded that the B2-RB19' transformation occurs in Ti-47.3Ni ribbons even after annealing at 973 K and 1,223 K. This finding is obviously different from the results obtained from thermo-mechanically treated and aged Ti-Ni alloys in which the R phase does not appear when annealing temperature is >873 K [11,12]. Comparing Figs. 2(b)
and (c), the intensity of the diffraction peaks of Ti2Ni is found to increase with increasing annealing temperature. This is attributed to the fact that the volume fraction of Ti2Ni increases with increasing annealing temperature as will be mentioned later.
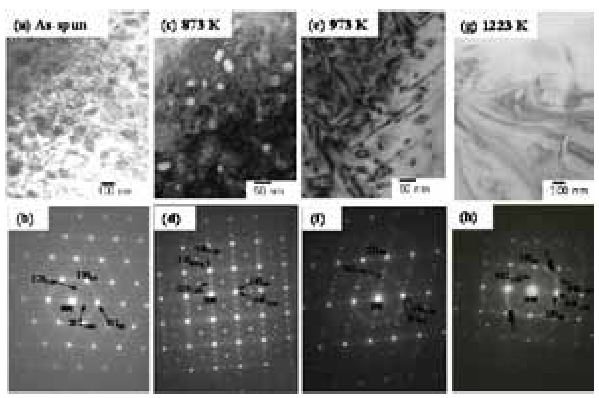
To elucidate the reason for the high thermal stability of the R phase in rapidly solidified Ti-47.3Ni alloy ribbons, TEM observations were made on the as-spun and annealed ribbons, and typical obtained results are shown in Fig. 3.
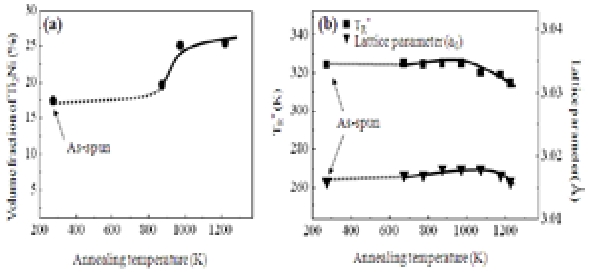
Figures. 3(a),(c),(e),(g) are bright field images of as-spun ribbon and ribbons annealed at 873 K, at 973 K, and 1,223 K for 3.6 ks, respectively. Figures 3(b),(d),(f ),(g) are corresponding electron diffraction patterns of Figs. 3(a),(c),(e),(g), respectively. Very fine Ti2Ni particles (<20 nm) having a specific orientation relationship with the B2 matrix are observed in the as-spun ribbon. We found that Ti2Ni particles grow with increasing annealing temperature. From bright field images taken from various areas in each sample, the volume fraction of Ti2Ni particles was measured and then plotted against annealing temperature in Fig. 4(a). The volume fraction was measured from an area fraction in the bright field images assuming that Ti2Ni particles are spherical. We found that the volume fraction of the Ti2Ni particles is in the range of 18-25% depending on the ribbon annealing temperature, which is large compared with that determined using the equilibrium Ti-Ni phase diagram (16.8%). This is attributed to the fact that rapid solidification enhances formation of Ti2Ni particles by suppressing Ti2Ni phase nucleation [16].
Judging by the equilibrium Ti-Ni phase diagram, the number of Ti2Ni particles decreases as temperature decreases. On the other hand, the volume fraction of the Ti2Ni particles increases from 18% to 25% as annealing temperature increases from 873 K to 1,273 K. This finding is possibly attributed to the fact that Ti is supersaturated in the matrix by rapid solidification. The annealing temperature leads to the increased Ti2Ni volume fraction. In fact, the Ti content in the matrix decreases as annealing temperature increases as shown in Fig. 4(b).
It should be noted here that a specific orientation relationship between the Ti2Ni particles and the matrix is preserved even after annealing at 1,223 K, which is considered to play an important role to induce the B2-R transformation. A previous study [17] found that the R phase formed in rapidly solidified Ti-49Ni (at%) alloy ribbons before the B2-B19' martensitic transformation occurred, which was attributed to Ti2Ni particles having a specific orientation relationship with the matrix. However, the R phase was not observed when the Ti2Ni particles lost their orientation relationship with the matrix after annealing at 1,123 K. In contrast to
the Ti-49Ni alloy ribbons, Ti2Ni particles in a Ti-47.3Ni alloy ribbon maintain a specific orientation relationship with the matrix even after annealing at 1,223 K, although part of the Ti2Ni particles lose the orientation relationship as indicated by the double-headed arrows. This finding may be attributed to the fact that the Ti2Ni particles of the Ti-47.3Ni alloy ribbons (~100 nm) are smaller than those in the Ti-49Ni alloy ribbons (100-200 nm) [17].
From Fig. 2, TR* (peak temperature of the DSC peak corresponding to the B2-R transformation) is measured and then plotted against annealing temperature in Fig. 4(b). TR* has been observed to remain almost constant with increasing annealing temperatures up to 973 K, above which it decreased as annealing temperature increased. To know the reason for the change in TR*, lattice parameter (ao) of the B2 phase was measured from Fig. 2 and then plotted against annealing temperature in Fig. 4(b). We found that ao remained almost constant with increasing annealing temperatures up to 973 K, above which point it decreased. Since the atomic radius of Ni is smaller than that of Ti, the decrease in ao suggests an increase in Ni content in the B2 matrix, which leads to the decrease in TR*. The increase in Ni content in the B2 matrix is attributed to the increased volume fraction of Ti2Ni as annealing temperature increased.
We investigated the transformation behavior of rapidly solidified Ti-47.3Ni (at%) alloy ribbons and the thermal stability of the R phase in the ribbons. The obtained results are as follows:
(1) Rapidly solidified Ti-47.3Ni alloy ribbons showed two-stage B2-R-B19' transformation behavior.
(2) The B2-R transformation was observed even after the ribbons were annealed at 1,223 K. The high thermal stability of the R phase was attributed to the fact that a specific orientation relationship between the Ti2Ni and the matrix was maintained even after annealing at 1,123 K.
(3) TR* (peak temperature of the DSC peak corresponding to the B2-R transformation) decreased as annealing temperature increased, a finding that was attributed to an increase in volume fraction of Ti2Ni, thus causing the increased Ni content in the matrix.