By the recent development of the micro electromechanical system (MEMS) technology, many applications of low cost MEMS-global positioning system (GPS) integrated navigation system are being popularly researched. These MEMS-based inertial sensors have been integrated with the GPS to provide reliable positioning solutions in case of GPS outages that commonly occur in the urban areas. Especially, low cost MEMS-GPS integrated navigation system is used for mobile robots, unmanned aerial vehicle or micro-aerial vehicle and pedestrian navigation system (Hasan et al., 2010; Noureldin et al., 2004; Yoon and Vaidyanathan, 2004).
In the MEMS-GPS integrated system, inertial sensor data includes large signal noise which makes significant error on the position result. Sensor noise is well compensated on a good observable trajectory in general integrated navigation system. But it cannot be exactly compensated on low cost systems. If the noise component could be removed, the overall inertial navigation accuracy is expected to improve considerably. The resulting position errors are proportional to the existing sensor noise.
In this paper, the wavelet denoising technique is implemented to eliminate the sensor noise for improving the accuracy of the navigation results (Hasan et al., 2010; Kang and Park, 2009; Nassar and El-Sheimy, 2005; Noureldin et al., 2004). Wavelet transforms have been successfully applied for denoising, classification, recognition, compression, and other applications. It can decompose the signal to a frequency component in local time. By using this characteristic, the wavelet denoising method shrinks the signal noise by eliminating the frequency component which contains only noise. Furthermore, Denoising quality is also improved by wavelet thresholding techniques. These are the schemes which are used to remove the noise in wavelet transform domain by using thresholding operator. Weaver and later DeVore proposed a technique known as the soft threshold. Donoho and several others coupled this result, known as wavelet shrinkage, with threshold selection techniques. This resulted in the methods such as, WaveShrink, SureShrink, and VisuShrink (Donoho 1995, Donoho and Johnstone, 1994, 1995). In this paper, the wavelet thresholding method is verified using the collected real data from the field test. It is implemented to the MEMS/GPS integrated system. This will be shown in the conclusion.
This paper is organized as follows: Section 2 describes the basic information of the wavelet denoising technique. Section 3 presents the wavelet denoising method implemented to the MEMS/GPS integrated system. It contains the structure of the MEMS/GPS integrated system and Kalman filter which are used in the integration of the system. The experimental result is analyzed in Section 4. Finally, conclusion is given in Section 5.
2. Wavelet Denoising Technique
2.1 Discrete wavelet transform
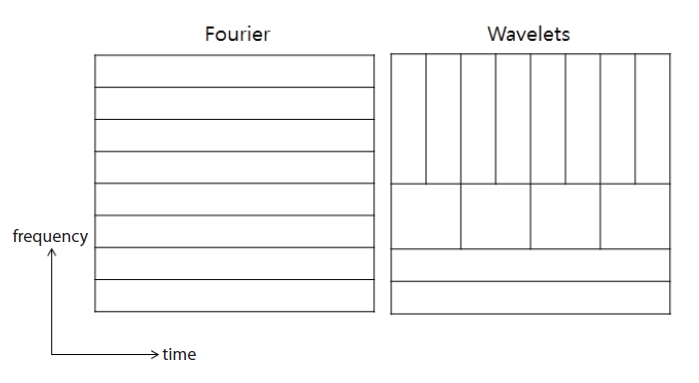
Wavelet transform is a signal transform technique which is popularly used in several areas such as image processing and audio signal processing. The comparison of the wavelet transform and Fourier transform is shown in Fig. 1. As specified in the left of Fig. 1, the Fourier transform decomposes the signal into each frequency component over the entire time interval. It means that the time domain information is lost in transforming to the frequency domain. When looking at a Fourier transform of a signal, it is impossible to recognize at what point a particular event takes place. To overcome this drawback, the transform is adapted to analyze a window of the signal at a particular instance of time. Furthermore, it is necessary to have multiple resolutions in time and frequency domain in order not to tradeoff corresponding to the choice of the window function’s width. The wavelet analysis is based
on a windowing technique with variable-sized windows as shown in Fig. 1. The wavelet transform applies the wide window (long time intervals) to low frequency and the narrow window (short time intervals) to high frequency.
Discrete wavelet transform is executed as in Eq. (1).

Where, d is an
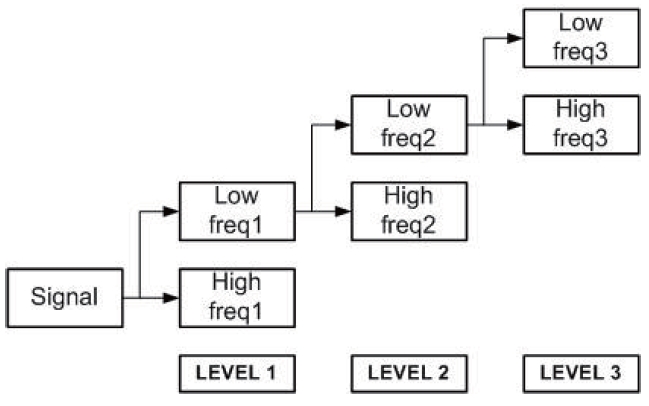
The scaling coefficient can be expressed as the convolution of the scaling coefficient and the wavelet coefficient in the lower level. It means that the low-frequency area can be decomposed to the high-frequency area and low-frequency area. The relationship is shown as in Fig. 2.
Wavelet transform is progresses stage by stage. When the signal is divided into low-frequency waves, it requires twice the amount of data. In addition, the lowest possible decomposable frequency area matches the DC value of the Fourier transform. This is calculated by using the entire data (Goswami and Chan, 1999).
2.2 Wavelet thresholding technique
Wavelet denoising technique was developed to estimate a signal which is corrupted by additive noise. Wavelet thresholding technique is a signal estimation technique that exploits the capabilities of a wavelet transform for signal denoising. It removes the noise, by eliminating coefficients that are insignificant compared to some threshold. Wavelet thresholding technique assumes that the magnitude of the actual signal is greater than the noise level, and the noise is white noise.
General low-pass filter (LPF) has the characteristics of
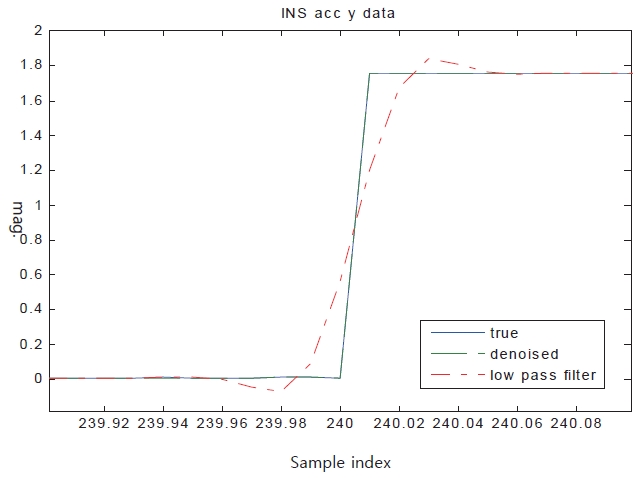
removing all the frequencies over a certain threshold. If sensor data exists in the high-frequency component, low pass filter results in the loss of the sensor signal. For example, the accelerometer signal has sudden change when the vehicle accelerates. The LPF distorts this change of signal. It turns it into a gradually changing signal. It is clearly shown in Fig. 3. In Fig. 3, the actual signal is expressed with a solid line. The result of the low-pass signal is expressed with the 1-dot chain line, which is found to smoothly follow the signal change. For this reason, the LPF cannot be used as the pre-processing filter in the inertial navigation system.
However, the wavelet thresholding technique reduces the noise level with almost no distortion for the sudden change in signal, as shown in Fig. 3. The result of the thresholding technique has almost no distortion and is accurate. So that it sits right on the actual signal almost indistinguishably. Therefore, it can be used by the pre-processing filter for the inertial sensor signal and overcomes the shortages of the existing LPF.
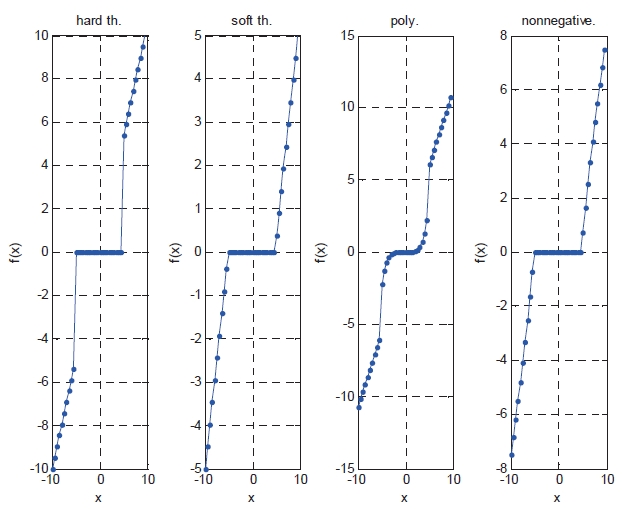
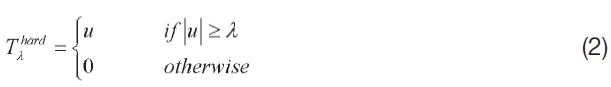
There are some kinds of thresholding methods namely, hard thresholding scheme, soft thresholding scheme (Antoniadis, 2007), nonnegative garrote function scheme (Gao, 1998) and polynomial thresholding scheme (Smith et al., 2008), which are illustrated in Figure 4. The figure shows the results of the thresholding schemes when the input signal
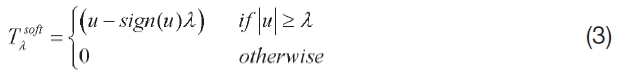
The soft thresholding scheme generally results in systematically biased estimates. The hard thresholding estimates are less biased but denoising performance is worse. Equation (2) shows the hard thresholding function and Eq. (3) shows the soft thresholding function.
Where,
To overcome the drawbacks and to achieve better performance, compromise thresholding schemes have been suggested in previous studies. As an example, nonnegative garrote function is mentioned. The resulting wavelet thresholding scheme off ers generally smaller mean squared error (MSE), less sensitive perturbations in the data, smaller bias and overall MSE. Equation (4) shows the nonnegative garrote function.
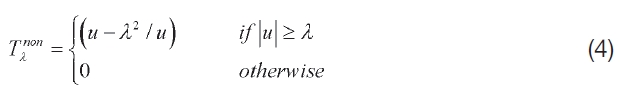
These schemes are functions dependent on the statistical models which give zero for small values of u and close values to u for larger values of the argument.
Polynomial thresholding scheme is also one of the solutions to remedy the drawbacks of both hard and soft thresholding scheme. The threshold operator used in this scheme is in the form of polynomials of
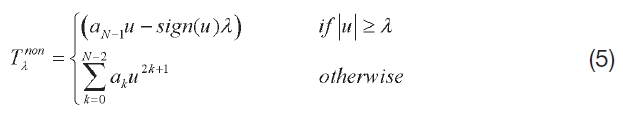
Where
preserving others.
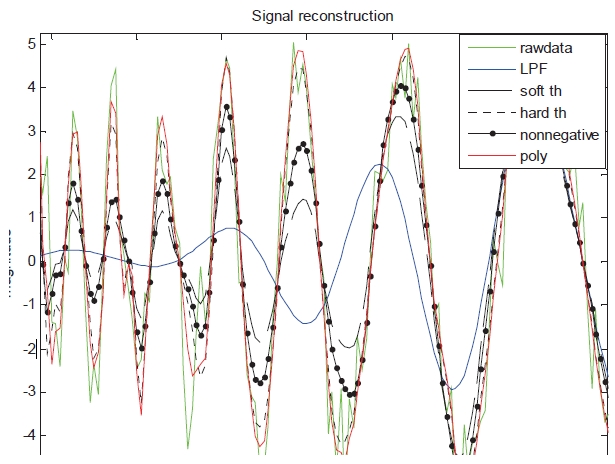
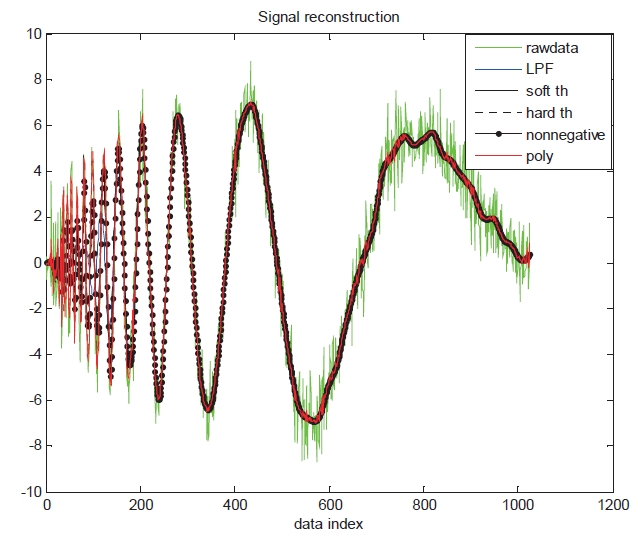
Among these methods, polynomial thresholding scheme has better performance of reconstruction of the signal than other schemes. So, the polynomial thresholding scheme is used for this experiment. The performance of reconstruction of the signal using thresholding schemes is shown in Fig. 5. The MSE of reconstruction is presented in Table 1. Doppler signal varying in its center frequency is used in the performance test. Figure 5 and Table 1 indicate the simulation results which demonstrate the superiority of the polynomial thresholding approach over the other schemes.
One of the important elements influencing the performance in thresholding technique is how the standard value of λ is set (Chan and Peng, 2003; Hasan et al., 2010). Generally, it is determined by Eq. (6). Here, σ is the standard deviation of the signal, and n is the number of signal samples.

The value determined by Eq. (6), however, does not lead to the optimal result. So, the appropriate value must be determined through experimentation. The thresholding algorithm is executed as follows. First, the wavelet transform is executed for the signal to acquire the wavelet coefficients. Next, the thresholding operation is executed for each wavelet coefficient. Then, the original coefficients are replaced to the coefficients from the result of the thresholding operation. Finally, inverse transform is carried out (Chan and Peng, 2003; Yoon and Vaidyanathan, 2004).
3. MEMS Inertial-GPS Integrated Navigation System using Wavelet technique
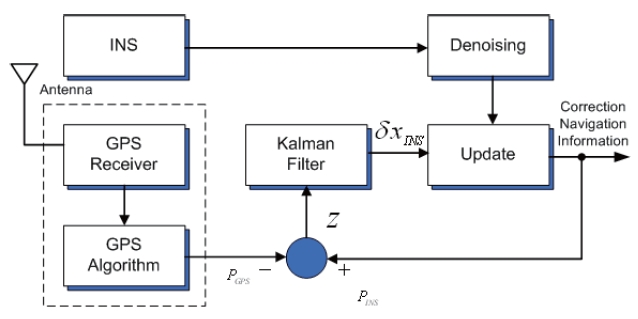
The MEMS-GPS integrated navigation system is used in the experiment. It is the general 15th order loosely coupled model (Titterton et al., 1997). The construction of the system is explained in Fig. 6.
The state variables of the Kalman filter consist of the position error, speed error, attitude error, accelerometer error, and gyro error. The measurement of the Kalman filter is the position information of the GPS which updates every second. The inertial sensor signal using wavelet thresholding technique is updated for every 0.01 second. It is used to calculate the integrated navigation result. If the LPF is applied
[Table 1.] MSE of the signal reconstruction
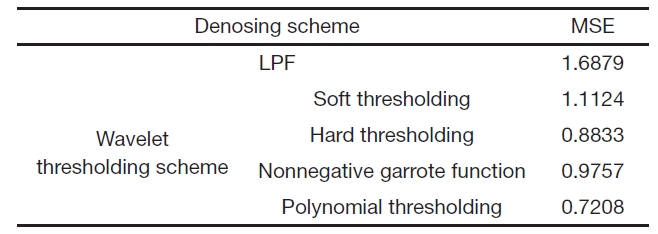
MSE of the signal reconstruction
to the GPS signal, it will yield better performance. However, the GPS signal was not filtered separately, as the objective of this research is to find out how much performance is improved by the denoising of the inertial sensor signal.
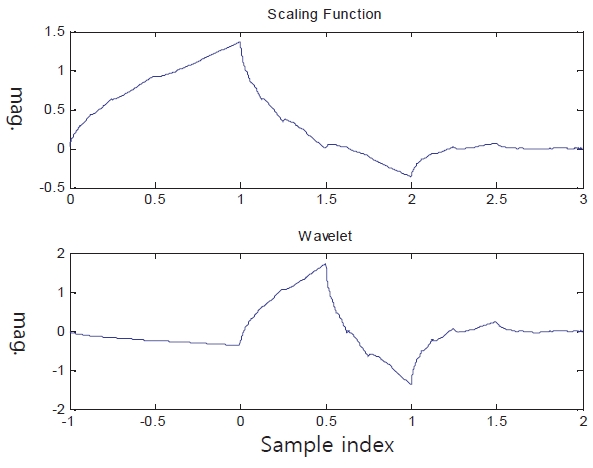
In this paper, the Daubechies wavelet (Daubechies, 1992) is used for wavelet transform as shown in Fig. 7. The setting of the wavelet does not have a big difference no matter which one is used. MEMS inertial sensor signal includes the actual vehicle motion dynamics and the sensor noise as well as some other undesirable noise such as the vehicle engine vibration. Therefore, the criterion for the selection of the appropriate wavelet level of decomposition (LOD) will be different from the stable motion case. Furthermore, the choice of threshold is crucial to maintain the quality of the denoising process. This should be made carefully (Hasan et al., 2010).
The wavelet transform was carried out to the 3th order. The threshold value is selected from Eq. (6) for the accelerometer and the gyro. These values are determined experimentally through multiple simulations.
The thresholding algorithm is implemented to the inertial
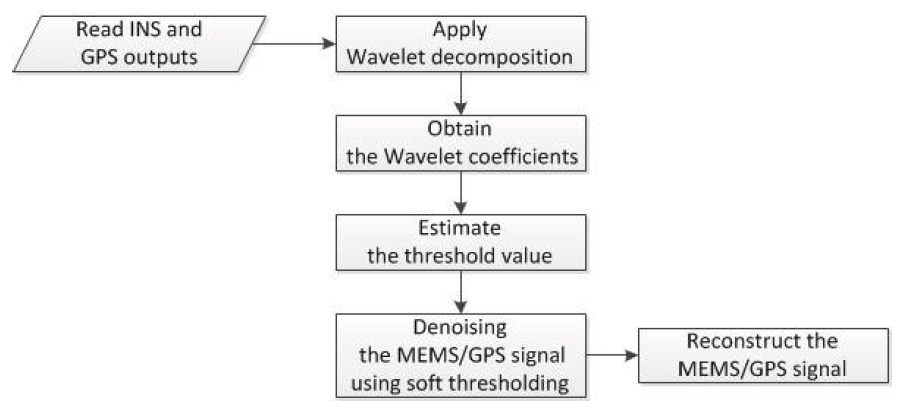
sensor as follows. The wavelet transform is executed for the gyro. The accelerometer signals of each axis and the wavelet coefficients are acquired. Next, the wavelet coefficients are replaced by the coefficients resulting from the thresholding operation. The inverse transform is carried out. The inverse transformed signal is the noise-mitigated signal, which is used to execute the MEMS inertial-GPS integrated navigation. The process is described briefly in the flowchart shown in Fig. 8.
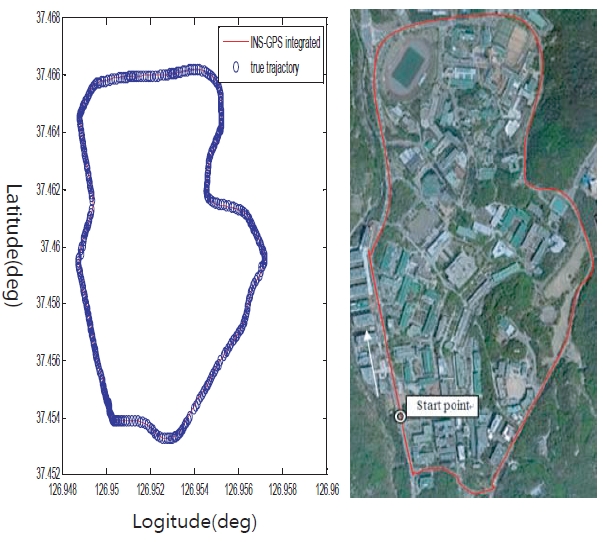
The trajectory of the experiment is the belt way of the Seoul National University campus shown in the Fig. 9. It also shows the position data of the MEMS-GPS integrated system. The true trajectory is measured by differential GPS for twenty minutes of travelling. In this test, a low grade MEMS inertial
[Table 2.] Typical performance of the MTi-G
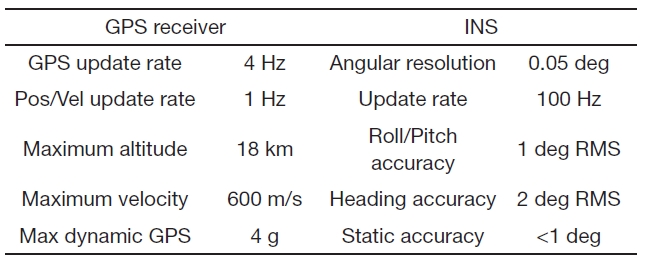
Typical performance of the MTi-G
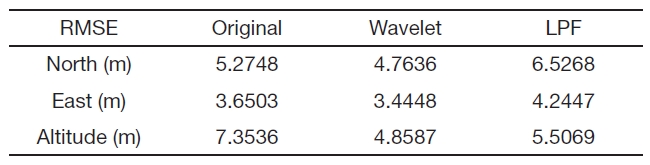
[Table 3.] RMSE of the MEMS-GPS integrated system

RMSE of the MEMS-GPS integrated system
navigation system (INS) (MTi-G) and GPS integrated system are used. The sensor specifications used in the test are shown in Table 2. The minimum number of available satellites was 8. The average vehicle speed was 40 km/h. All the analysis results in this paper are implemented using the MATLAB computer-aided design software including the wavelet analysis.
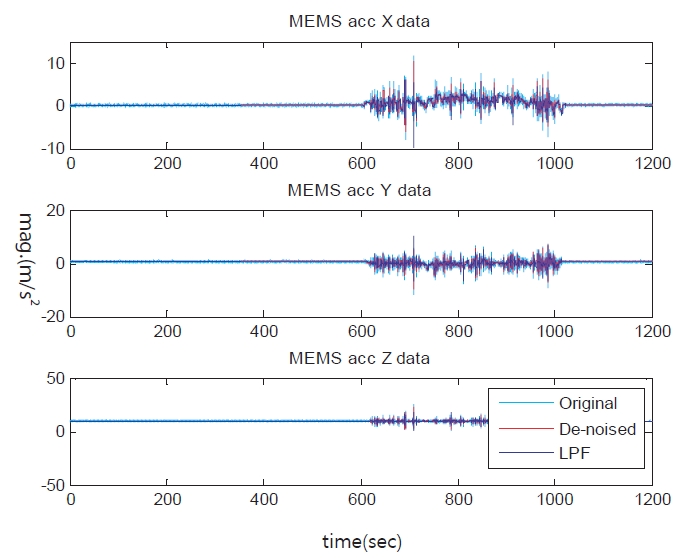
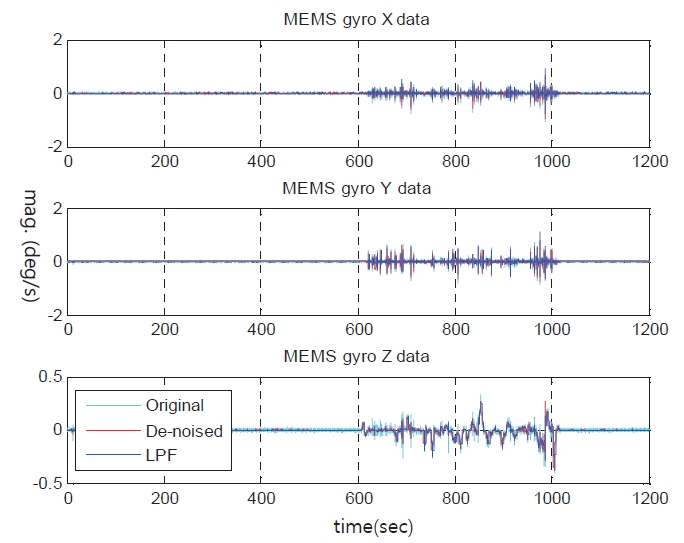
Figure 10 illustrates the experimental result of the MEMS output signal arranged x, y, and z axis in order. It shows original MEMS sensor signal. It also shows the signals applied to the filtering methods. Comparison was made between the wavelet threshold method and the noise reduction method used in the research of Sameh and Naser (2005). In the research of Sameh and Naser (2005), the method of controlling LOD eliminates the noise of the INS signal. Its results are almost identical to that of the LPF, as the frequency response of the scale function is similar to the LPF. Thus, this result is marked as LPF in Figs. 10-12.
Figure 10 shows that result of the comparison between the wavelet thresholding technique and LPF. The original signal shown in cyan line means the raw data without any de noising technique. The signal applied to wavelet thresholding technique and LPF is shown as a red line and blue line, respectively. LPF means the signal applied to wavelet transform without thresholding technique.
In the stable state, both Wavelet thresholding technique and LPF do not distort the sensor data. On the other hand, LPF is more efficient than the Wavelet thresholding technique in terms of signal denoising.
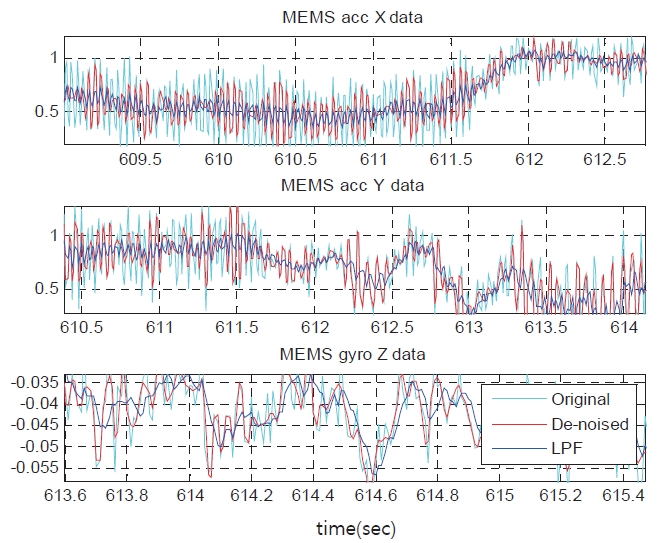
In the case of INS signals, passing through the low pass filter often cause the distortion of sensor signal as shown in Fig. 11. This shows the data influenced by the dynamic motion of the vehicle for a period of one second. On the other hand, the signal applied to Wavelet thresholding technique maintains good performance during this period.
Consequently, using the pre-filtering method such as the low pass filter to remove the noise of the MEMS signal, it results in the decreased navigation performance.
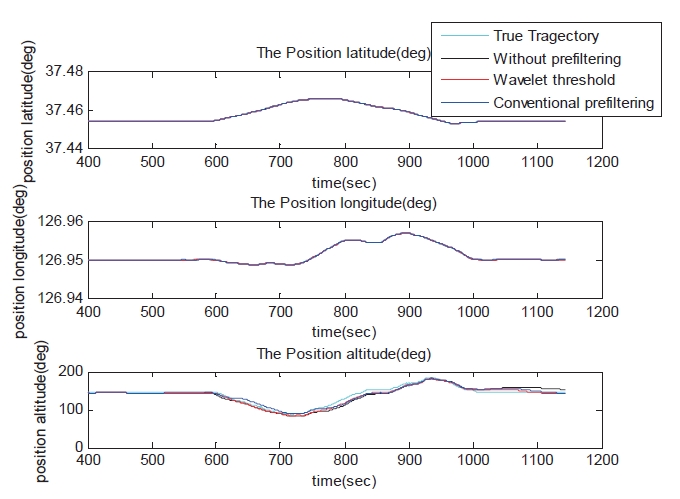
Figure 12 shows the MEMS-GPS Navigation position output data. The navigation error is arranged latitude, longitude, and altitude in order. The data in the altitude position component applied to LPF is verified so that the LPF distorts the sudden change signal.
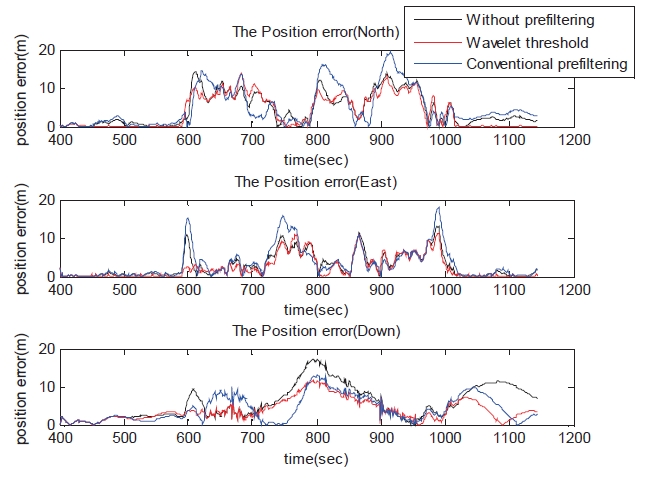
Table 3 shows the root mean square error (RMSE) of the MEMS-GPS integrated system’s position output data based on DGPS position data. It compares the RMSE between the wavelet thresholding method and the LPF in the direction of north, east and down. The RMSE of wavelet thresholding technique is smaller than LPF. This verifies whether the wavelet thresholding method has better performance than LPF or not.
Therefore, the chosen wavelet filter (Daubechies wavelet) and thresholding technique contributed to eliminate the undesired noise in the system and maintain better performance than the result used by LPF.
The LPF used in the MEMS-GPS integrated navigation system has limitations such as signal distortion and delay. Such issues cause the deterioration of the navigation performance. However, the wavelet denoising techniques which use the thresholding method can reduce the signal distortion. This technique is useful for denoising MEMS INS signal which rapidly changes according to the motion of the vehicle.
By applying the wavelet denoising techniques using polynomial thresholding scheme in this paper, it was proved that the overall navigation performance was enhanced by 19.72% more than the performance using conventional prefiltering technique.