The possibility of extraterrestrial life has excited the human imagination for hundreds of years. However, the first (and only) dedicated life detection experiments on another planet were not performed until the Viking Landers of 1976. One experiment in particular, the Labeled Release (LR) experiment of Levin and Straat [1-4] satisfied a stringent set of prior agreedupon criteria for the detection of microbial life on Mars (i.e. a significant increase in evolved radioactive carbon-containing gas over baseline after 14C radiolabeled nutrient administration to a Mars soil sample, and abolition of that response by pre-heating the soil to 160℃). However, controversy has reigned ever since over these findings. Until recently, chemical interpretation of the LR results has dominated but discoveries of Martian atmospheric methane [5,6], sub-surface water ice on Mars [7], drops of liquid water at the Phoenix landing site [8], and the incredible hardiness of terrestrial extremophiles [9] have all led to the re-examination of the possibility of extant Martian microbial life.
In past work [10], we have shown that the “active” (gasevolving) Viking LR experiments exhibited strong circadian rhythms in radiolabeled gas release. These oscillations rapidly grew in amplitude and regularity in the first two sols (one sol=24.66 hr, a Martian solar day) of the active experiments to reach a near steady state of constant amplitude and period. Perhaps, this reflects the synchronization of a population of microbes to the temperature cycle imposed by the Viking landers. When tested, heat-treated (control) samples of the same soil showed a greatly attenuated rhythm, or no rhythm whatsoever. In the two experiments in which the active soil samples were stored for several months before administering the nutrient solution, rhythmicity was almost completely absent.
We now report a new methodological approach to these data, complexity analysis. Due to the high order present in biological systems [11] , time series of biological variables, with their short- and long-range correlations, scale-invariance, complex periodic cycles, quasi-periodicities, positive and inverse “memory” and the like, exhibit behaviours that are different from the complete unpredictability of pure random physical processes (white noise). Moreover, they are also distinguishable from the trivially smooth landscape of a completely predictable deterministic process, often manifesting themselves with flicker (pink) noise (temporal scale statistical invariance) [12,13]. We have now found that a set of complexity measures (appendix#1 for definition) unambiguously distinguishes the active LR experiments, or portions thereof, from various abiotic controls (p<0.001). These measures very strongly suggest, in agreement with terrestrial analyses, that the active LR experiments in all likelihood detected microbial life on Mars.
Summary of initial analyses
In the thousands of tests that were conducted on a wide variety of terrestrial microorganism-laden soils in 20 years of testing before and after the Viking mission, radiolabeled gas, presumably CO2 (or possibly CO2 plus some other carboncontaining gas such as CH4) was produced by cellular metabolism, always evolving immediately after the injection of the radiolabeled LR nutrient (e.g. Biol 5, see Methods). Heat-treated control soils produced insignificant responses (e.g. Biol 6). There was never a false positive or ambiguous result in the terrestrial experiments. In the current study, terrestrial LR pilot experiments using bacteria-laden active (Biol 5) and sterilized (Biol 6) soil samples were analyzed, using the same nonlinear approaches that were employed for analysis of the Martian data.
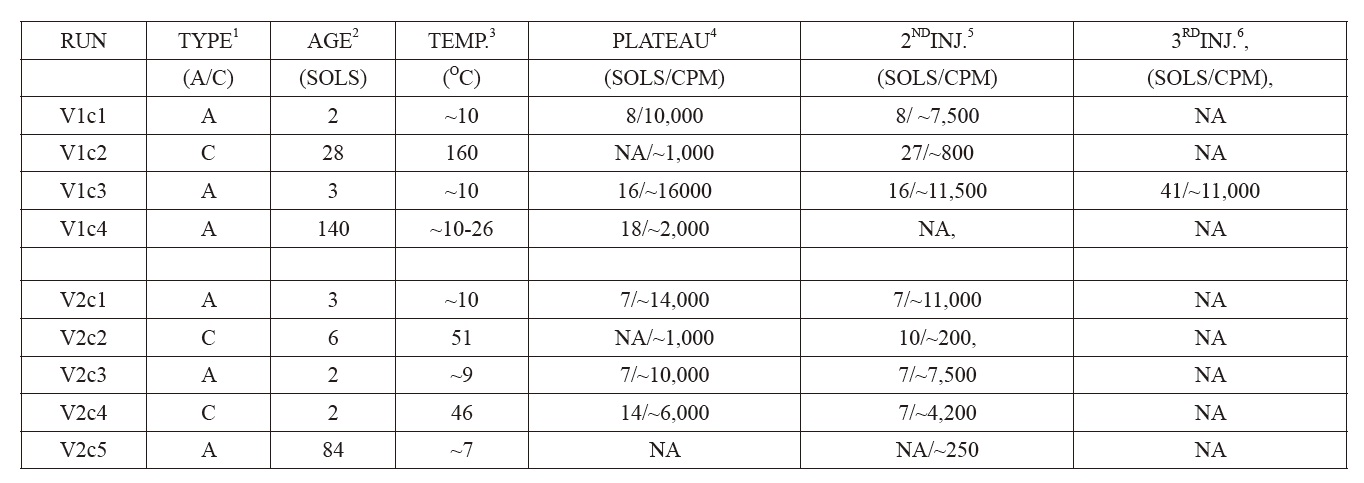
On Mars, injected soil samples evolved radioactive gas [3,14] rapidly, subsequently approaching plateaus of 10,000 ? 15,000 cpm after several sols (Fig 3, top panel). These “actives” (VL1c1, VL1c3, VL2c1, VL2c3), were run at Viking Lander sites 1 and 2, with similar results. In contrast, the LR response in VL1c2, the 160℃ control, was very low, essentially nil, thereby, in conjunction with the active experiment results, satisfying the pre-mission criteria for life (see appendix #2 for a brief description of the Viking LR results).
Martian soil heated for three hours at 51℃ produced an erratic succession of declining low-amplitude oscillations, each rising for about a sol, then precipitously falling to baseline (VL2c2). Soil treated for three hours at 46℃ responded with typical “active” kinetics, but 70% reduced in amplitude (VL2c4). Further, formerly “active” soils stored at 10℃ for three and five months, at Lander 2 (VL2c5), and Lander 1 (VL1c4), respectively, failed to respond to the nutrient [15].
A second nutrient injection was made to each “active” soil after seven sols (VL1c1, VL2c1, VL2c3) or 16 sols (VL1c3). Each time, the gas briefly spiked, followed immediately by a 24% mean decrease in the accumulated 14C gas. Laboratory simulations [16] showed absorption of CO2 by wetted Mars analog soils (pH 7.2) indicating that the Viking LR gas was, at least in part, CO2. In a terrestrial experiment, upon second injection [17] to an Antarctic soil with known bacterial content (pH 8.1) a brief spike also occurred, followed by a decrease in the accumulated gas. CH4, now known to be a component of the Martian atmosphere (6) and a possible biological metabolite, is virtually insoluble in aqueous media at temperatures and pressures recorded in the Viking Landers. If produced in such experiments, then it must have remained in the non-reabsorbed 14C-labeled gas fraction. These results indicate that a significant fraction of the 14C-labeled gas evolved on Mars was CO2, at least a part of which (~24%) was reabsorbed on wetting of what was likely an alkaline soil [18], while the unabsorbed fraction could have contained CH4.
As mentioned in the Introduction, circadian oscillations in the evolved LR gas developed gradually after the first nutrient administration in the active experiments. The oscillations were superimposed on the initial rise in cpm, and also on the subsequent linear rise following the mean 24% reduction in cpm after the second nutrient administration. The oscillations were relatively stable in amplitude, but phase-delayed by about two hrs compared to the daily oscillation in the lander temperature. These oscillations were not slavishly driven by the diurnal temperature cycle. All these effects are more characteristic of a biological rhythm than a purely physical temperature-driven process [10]. Our detailed consideration of the possible effects of soil pH, thermal variation in CO2 solubility, and a review of the ground-based and LR controls found that CO2 absorption and release could account for at most about 50% of the oscillatory response. Thus, some fraction of the circadian oscillations as well as the evolved gas remaining in the headspace of the instrument following second or third nutrient injection could have been any water-insoluble carbon-containing gas, such as CH4, which gas, since Viking, has become of possible biological interest in studies of Mars [19].
Nine LR experiments (VL1c1, VL1c2, VL1c3, VL1c4, VL2c1, VL2c2, VL2c3, VL2c4, VL2c5) were performed on Mars soil samples collected with a robotic arm from the surface to a depth of about 4 cm. Each sample (0.5 cc) (Levin and Straat, 1976a)[2] was injected with 0.115 ml of a solution of formate, glycine, glycolate, D-lactate, L-lactate, D-alanine and L-alanine, each at 2.5 x 10?4 M, with each ingredient uniformly labeled with 14C. The soil samples were monitored for the evolution of 14C gas as preliminary evidence of microbial life. L-lactate and D-alanine were included to detect alien metabolism that might require amino acids and sugars with a chirality different from ours [20](Levin et al., 1964) (using opposite chirality enantiomers in separate experiments was later proposed as a follow-on life detection experiment [21] (Levin, 1987) ). To confirm a positive response, a second soil sample was heated to sterilize it without destroying possible inorganic chemical agents, these agents presumably being far more heat resistant than the biological mechanism that might plausibly have produced the positive response. Thus, a negative LR response from a heat-treated soil confirmed that the initial response in the active experiments was likely biological, rather than inorganic.
Four experiments (VL1c1, VL1c3, VL2c1, VL2c3) were performed on untreated soil samples. Another soil sample was heat-treated (“sterilized”) for three hours at 160℃ (VL1c2). Two experiments utilized samples that were heattreated (46℃ and 51℃) for three hrs (VL2c4, VL2c2). Two soil samples (VL1c4, VL2c5), after sub-samples showed active responses, were stored at 10℃ in the dark sample distribution box for 3 and 5 months, respectively, before nutrient solution was administered. In all experiments except VL2c5, a second nutrient injection was given at least four sols after first injection, and gas measured as above.
Biol 5 and Biol 6 data were obtained from pre-flight tests conducted in a test instrument that was essentially identical to the flight instrument. In these tests, LR nutrient was added to “active” terrestrial soil with a known microbial population (Biol 5) or to soil that had been heated for three hours at 160℃ (Biol 6). The results for Biol 5 showed immediate and rapid 14C-labeled gas evolution, typical of terrestrial soils with modest microbial populations, whereas Biol 6 results were essentially nil.
We employed both positive and negative controls (known presence or absence of life) to further characterize the LR experiments. Pre-nutrient administration background radioactivity, a series of internal Viking Lander 1 temperature measurements (1980 data points each taken sequentially every 960 sec), a series of external Mars atmosphere temperature readings (1000 data points each taken sequentially every hr) and a terrestrial heat-sterilized sample test (Biol 6) constituted negative controls. A terrestrial bacteria-laden active test (Biol 5) and a 23- day series of core temperature readings taken every minute from a rat in constant darkness constituted positive controls.
Nonlinear indices (Relative LZ Complexity or LZ; Hurst Exponent H; Largest Lyapunov Exponent λ; Correlation Dimension CD; Entropy K; BDS Statistic; and Correlation Time τ; see appendix #1 for definitions) were calculated (Chaos Data Analyzer Pro, J.C: Sprott & G. Rowlands, American Institute of Physics, 1995) as an operational numerical method to measure quantitatively the complexity of the LR signal during active and control experiments on the Viking landers and in terrestrial pilot experiments on sterile and bacteria-laden soil samples. Moreover, negative controls included complexity analyses of variations in pre-injection background radioactivity, Mars atmosphere temperature and lander temperature. A positive terrestrial control consisted of a twenty-three day series of rat core temperature measures that were taken every minute. Data were analyzed in three different ways: 1) all usable data from a given experiment were pooled 2) data from each experiment were analyzed in sequential 92 bin samples (approximately one sol of data) throughout the experiment in which each bin constituted one 960- sec data point 3) all data points were detrended of linear and circadian periodic components. The residuals (noise) were then analyzed as in 1) above. For the Viking data, only
960- sec data samples were analyzed, to standardize time and the areas of signal dropout were ignored. The number of data points/experiments varied from 790 (~8 sols; VL1c2) to 6879 (~69 sols; VL2c3).
For the purpose of this work we define “order” as relatively high H, BDS and τ, and relatively low LZ, λ, CD and K. Similarly, “disorder” may be defined as relatively low H, BDS and τ, and relatively high LZ, λ, CD and K.
K-means cluster analysis (Systat 12) was employed to determine whether the Viking LR experiments, averaged over all sols, would automatically sort, on the basis of the complexity variables, with known physical measures (terrestrial LR pilot experiment (Biol 6) on sterile desert soil, pre-injection random background radioactivity, Mars atmospheric temperature, Viking lander temperature), or with known biological measures (terrestrial LR pilot experiment (Biol 5) on a known microbe-positive soil sample, rat core temperature data series). The cluster analysis was repeated only on the Viking LR active and control experiments. These analyses were applied both to the raw data series and to the same series following linear and circadian detrending (SigmaPlot 11). The derived clusters
were then validated via discriminant analysis. This allowed the determination of jack-knifed assignment accuracy of the individual experiments to the proposed clusters, as well as a measure of the relative discriminative power of each complexity measure (sequential F to remove procedure).
Repeated measures multivariate and univariate analysis of
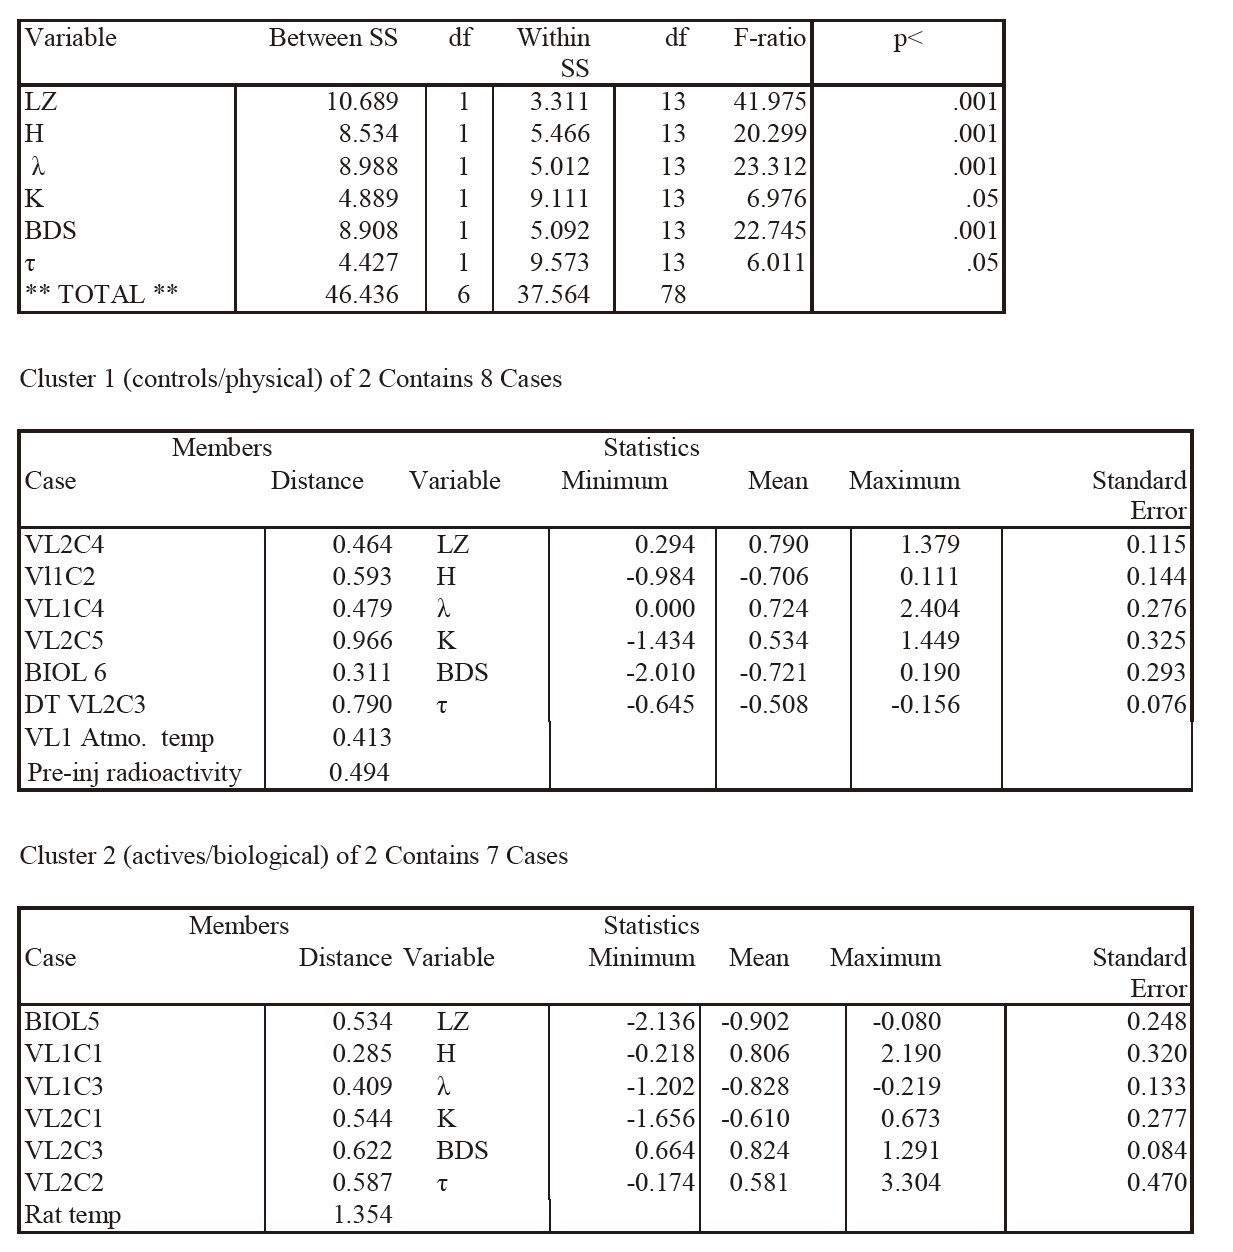
K-means Cluster Analysis of Averages across Sols of All Detrended Data Sets Summary Statistics for All Cases
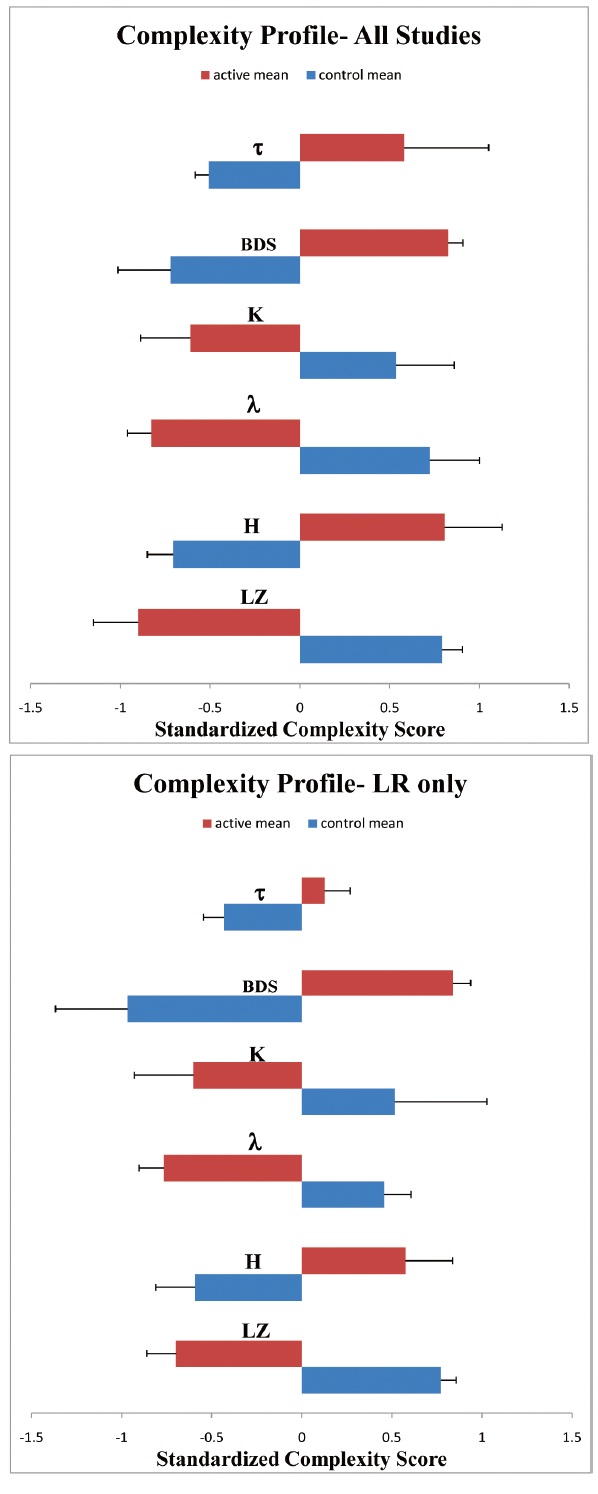
This table lists F-ratios and p values for the complexity variables discriminating the two clusters in the K-means cluster analysis, top panel). Cluster members (individual experiments and data series) of the two clusters are shown (second and third panels) with distances from the centroid for each experiment, as well as means, SEs, and ranges for each discriminating complexity variable, as plotted in Fig 1. It may be seen that the various experiments sort into what can be labeled as control or physical data (Cluster 1) or active biological data (Cluster 2). Discriminant analysis indicated that the two clusters differed significantly on the complexity variables (p<.001).
variance was also performed to determine whether the seven complexity variables could discriminate between active and control Viking LR experiments over the first six sols of the experiments on a sol-by-sol basis. Finally, a stability analysis compared the complexity scores between the clusters for the first and the last sol of each experiment.
5. Results. Complexity Analysis
K-means cluster analysis (Fig 1; Table 1 automatically sorted the active Viking LR experiment data, averaged across all sols (VL1c1, VL1c3, VL2c1, VL2c3) with known biological measures averaged in the same way (terrestrial LR study Biol 5 on a soil sample with known microbial content, terrestrial rat core temperature data series). These experiments exhibited flicker (pink) noise in the detrended active samples (LZ active mean ± SEM =.565 ±.044). In contrast, the Viking LR 160℃ control (VL1c2), the sterile soil terrestrial LR control (Biol 6), the Viking LR sample heated to 46℃ (VL2c4) and the two long-term stored soil samples maintained in the dark at approximately 10℃ (VL1c4, VL2c5) sorted with the purely physical measures (Viking LR pre-injection background radioactivity, Mars atmospheric temperature series and the VL2 lander temperature measured at the beta detector), all approximating white noise (e.g., LZ control mean ± SEM =.958+.022).
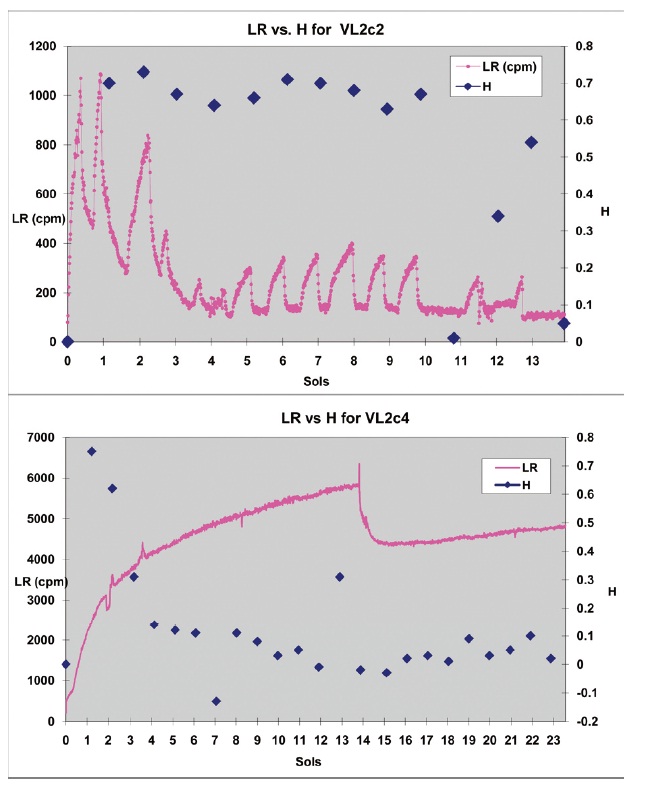
Another sample (VL2c2), heated to 51℃, sorted with the actives. The acute LR response in this experiment was much less attenuated than in the other modestly (46℃) heated sample (VL2c4). A series of circadian oscillations with periods identical to those seen in the active experiments, but with lower amplitudes, was observed in the 51℃ heated sample VL2c2. The concomitant complexity measure H remained high until the tenth sol, at which time the values declined rapidly (Fig 2, top panel). In contrast, the 46 ℃ heated sample VL2c4 exhibited high H values for a few sols, but then rapidly declined to the level of random noise (e.g. pre-injection background radioactivity) for the rest of the experiment, causing it to sort with the controls in the solaveraged cluster analysis (Fig 2, bottom panel; Table 1).
The average cluster profiles are nearly mirror images of each other (Fig 1), with all complexity variables (F ratios ranging from 6 to 42, df=1,13, p<.001, Table I, top panel) except Correlation Dimension (CD), well discriminating the clusters in this analysis. The cluster membership structure persisted whether the raw LR data were used or data detrended for linear and circadian components. Table 1 (top panel) illustrates the relative strengths (F values, p values) of the complexity variables in sorting the detrended means of the experiments into Cluster 1 (middle panel) which we named Actives or Cluster 2 (bottom panel) which we named Controls on the basis of the cluster membership. Moreover, the same sorting of the Viking experiments into “active” and “control” clusters was seen if the analysis was limited only to the LR experiments (Bottom panel; Fig 1). Euclidean distances to the cluster centroids, and the mean, range and SE of each complexity variable are also presented (middle panel, bottom panel).
The cluster structure was robust across either Euclidean, Minkowski, or Pearson distance measures. If three clusters were requested, rather than two, this caused the control cluster to fragment into sub-clusters while the active cluster persisted. The cluster membership (all data series) was further validated by a two-group discriminant analysis which showed that the two clusters were easily discriminated (Lambda =0.03, df=5,1,13; approximate overall F=59.1, df=5,9, p<.001). Assignment of individual experiments to the two clusters was 100% correct by the jack-knife classification procedure. The variables best able to discriminate the two clusters in the discriminant analysis were LZ, H, λ, BDS and entropy (K) with F to remove ranging from 5.3 (K) to 36.9 (LZ), approximately p<.02 to p<.001 (Systat12). If the analysis was limited to the LR data series, results were essentially the same (discriminant analysis, Lambda=.028, df=4, 1, 9; approximate overall F=51.4, df=4,6, p<.001, 100% correct classification of experiments by jackknife). For the restricted analysis LZ, H, BDS and K were the best cluster discriminators, with F to removes ranging from 5.7 to 36, approximate p=.05 to p<.001.
Multivariate and univariate analysis of variance indicated that most of the complexity variables with the exceptions of K and CD, discriminated the two clusters averaged across all sols (Hotelling-Lawley Trace, Wilk’s Lambda, Pillai
Trace, df=7,1, p<.02 for all three statistics). For the other five variables F values ranged from 5.8 to 46.3, with p values from .007 to .05. The LZ mean value for the detrended active LR experiments was consistent with pink or flicker noise (mean ± SEM =.565 ±.044) while the LZ mean for the controls was characteristic of white noise (mean ± SEM =.958±.022), and was significantly higher than the active LZ mean (two tailed independent t test, LZ actives vs. controls, t=8, df=7, p<.001).
Changes in complexity restricted to the first six sols of each experiment were also examined. Fig 3, Top panel, plots the raw LR data from an active experiment (VL2c3) and the 160℃ control (VL1c2), while the bottom panel plots the complexity variable, H, over the same time course for the two experiments.
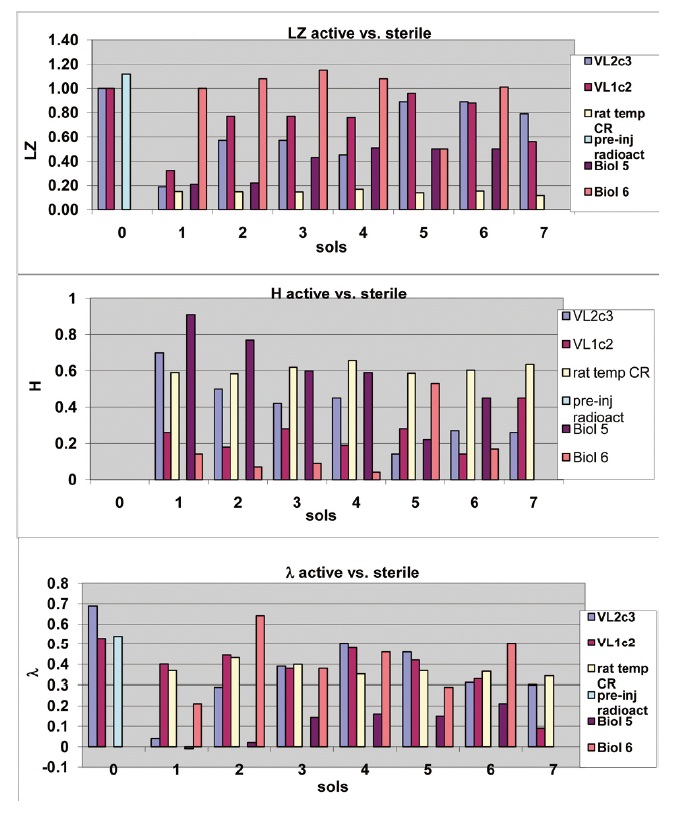
A two-tailed independent t test showed that this complexity variable easily discriminated the two experiments (n=16 sol by sol data points, df=14, t=3.76, p<.005). In order to show sol to sol variability, additional complexity variables are plotted over the first several sols for selected individual LR experiments in Fig 4. In general, H values are higher for active experiments than for controls (Note that H=0 for pre-injection measures (sol 0) of radioactivity for VL2c3, and VL1c2) while the reverse is true for LZ and λ. In active experiments (i.e.,VL2c3, Biol 5), λ and LZ climb and H declines over sols. In contrast, the rat temperature series and
the sterile control series (VL1c2, Biol 6) maintain relatively stable values.
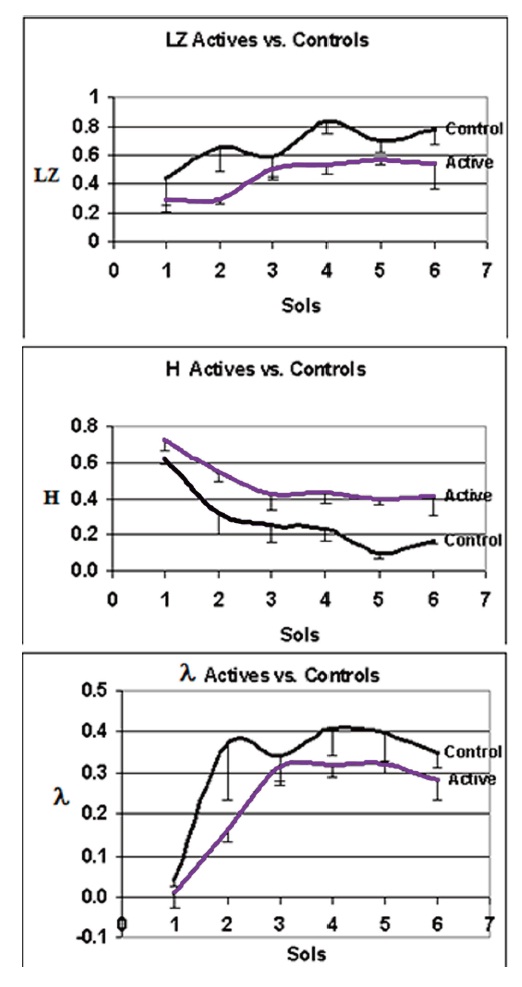
The cluster mean data for active and control experiments are plotted across sols for the three best discriminating complexity variables (LZ, H, λ) in Fig 5. H is significantly higher when it is averaged across all the active experiments than when it is averaged across the controls. The reverse is true for LZ and λ.
While the confidence intervals overlap to some extent, in 18 separate comparisons on these three complexity measures the active experiments differed consistently in complexity from the controls. The probability of this occurring by chance for independent events is 1/218, much less than p<.001. For the Between-Clusters effects on each complexity variable (df=1,9), F=9.26, p=.01 for LZ; F=17.46, p<.002 for H; F=6.44, p=.03 for λ; F=3.95, p<.08 marginal for BDS, F=3.28, p=0.10 marginal for τ. CD and K failed to discriminate the clusters over the first six sols. A significant Sol effect (df=5, p<.05) was seen for all complexity variables except CD, K and τ. Cluster x Sol interactions were non-significant for all the complexity variables.
A stability analysis compared the first and the last sols of the experiments. It demonstrated that the complexity measures evolve over time in the direction of disorder, defined as relatively high K, LZ, λ and CD, but relatively low τ, H and BDS in all the experiments, in agreement with the significant Sol effect seen in the six sol analyses (Fig 3,4,5). However, the starting values of the complexity variables LZ (p<.05), H (p<.004), λ (p<.02), BDS (p<.07, marginal) and τ (p<.01) were significantly different, favoring greater order, for the active experiments compared to the controls. K and CD indices were numerically smaller on Sol 1 for the actives vs. the controls, but these differences were not significant. By the last sol of the experiments, all complexity scores had evolved in the direction of disorder and there was no longer any difference in complexity between the actives and the controls. Furthermore, active experiments were longer in duration (mean=34 sols) compared to the controls (mean=20 sols). Thus, it took over 40 sols for complexity to change in the active experiment VL2c3, whereas the moderately heattreated experiments VL2c2 and VL2c4 exhibited substantial order for several sols, typical of an active response. However, the response then rapidly decayed to a near-random state of disorder for the remainder of the experiments, perhaps indicating a cessation of biological activity soon after dosing (Fig 2).
For almost 35 years a controversy has raged over whether or not the Viking LR experiment detected life on Mars. Although the results of the LR experiment met the pre-launch criteria for the detection of life, the dominant explanation of the results was that a superoxide in the soil was responsible for oxidizing the organic molecules in the LR nutrient. Levin and Straat [22] spent three years seeking a chemical or physical method of duplicating the Mars LR test and control data, to no avail. Moreover, Levin [23] reviewed more than two dozen abiotic explanations that had been proposed over the years, and found all of them wanting. None of the strong oxidants proposed over the years exhibit the thermal profile of the active Martian agent as established by the LR experiments. Superoxides synthesized in the laboratory [24] as candidates for the LR response turned out to be unstable in aqueous media, breaking down in seconds. In contrast, stable LR signals were detected for many weeks after the administration of the aqueous nutrient. Furthermore, it is unclear why sample storage for 3-5 months at 10℃ in the dark would virtually destroy the response from a strong oxidant or superoxide. The perchlorate discovered in Mars soil [18] similarly fails as a candidate for the LR response.
On the other hand, in recent years, biological interpretations of the LR experiment have become more acceptable with the discovery of equatorial methane-generating regions on Mars overlapping areas with extensive sub-soil water ice deposits and atmospheric water vapor (http://www.esa.int/ SPECIALS/Mars_Express/SEML131XDYD_0.html). Furthermore, study of terrestrial extremophiles, including methanegenerating microbes in desert sub-soil [25] indicate that such organisms can thrive in arid sub-soil environments comparably harsh to the Martian environment. It has been proposed by Levin and Straat [26] and later by Miller et. al, [19] that both the persistence of methane in the Martian atmosphere and its required sink can be explained by the possible presence of methane-producing and methane-consuming microorganisms similar to those on Earth.
In past work [10] we have shown that the active LR signal is periodic, exhibiting a circadian (more appropriately circasolar) rhythm with a period of 24.66 hr, approximating the rotational period of Mars. The periodicity in the LR experiments rapidly evolves over time, and can be almost entirely extinguished by heat treatment or long-term soil sample storage. Circadian rhythms are robust biosignatures, and the presence of such rhythms in the LR signal is at least consistent with a biological interpretation.
In the current work we have demonstrated that the LR signal (and the associated noise) in active LR experiments is very different from the LR signal for heated or long-termstored soil samples. Furthermore, the active LR experiment data cluster with known biological signals (rat temperature series, the active terrestrial LR pilot study Biol 5), exhibiting flicker (pink) noise in the detrended active samples , whereas the LR control studies cluster with non-biological signals such as random background radiation, Mars atmospheric temperature, Mars lander temperature, and a terrestrial LR sterile control (Biol 6), approximating white noise . These clusters are robust under different measures of inter-cluster distance and persist even when the individual cluster membership is restricted to the Viking LR experiments, with active experiments and control experiments sorting into two distinct clusters. An attempt to form a third cluster simply fragments the controls. Discriminant analysis confirmed the cluster structure and classified each experiment correctly into either the active or control clusters. Repeated measures analysis of variance indicated that the complexity differences between actives and controls were generally stable over the first sols of the study, but decreased in magnitude gradually in that period and very strongly when evaluated over the entire experiment in the stability analysis. Most importantly, the active experiments exhibited higher order, defined on the basis of the complexity measures, early in the experiments compared to the controls. Order declined more slowly over time in the active experiments than did the already low order in the controls. Overall, the complexity variables that best discriminated actives from controls were LZ, H, λ, BDS and τ, while K and CD failed to do so. In terms of the definition of the complexity variables (Methods), the active experimental data were more predictable and pinker (LZ), persistent (H), periodic (λ), and less random (BDS, τ) compared to the control data. Entropy (K) was numerically higher in the controls, consistent with the other results, but the difference from the K values for the active experiments was not statistically significant.
The multivariate analyses, especially the cluster analyses, clearly distinguished between active and control Martian LR experiments. When a number of terrestrial time series, known to be biological or non-biological, were added to the set of LR experiments, the biological time series automatically sorted with the LR active experiments, and the non-biological time series sorted with the LR controls, forming two distinct clusters on the basis of the complexity variables. In the multidimensional space defined by those variables, the cluster analysis indicated that the active LR experiments were more similar to the terrestrial biological time series and the control LR experiments were more similar to the non-biological terrestrial time series. In mathematical terms, the Euclidean distance between the centroids of the two clusters was significantly larger than the intra-cluster distances between any members of either cluster. It is reasonable to infer from this analysis that the Martian active LR experiments were more likely detecting a biological process, whereas the Martian control LR experiments were more likely detecting a non-biological process.
Thus, we have shown that complexity variables distinguish active LR experiments (Martian and terrestrial samples) from control LR experiments. The active experiment Viking LR signals have a complexity that is similar to the biological signals, such as the terrestrial microbe-positive LR pilot study, Biol 5, while the controls (heated, Martian and terrestrial) LR signals are more similar in complexity to non-biological signals. Moreover, stability analysis indicated that the kinetics of complexity decay are very different for the actives vs. the controls. It is difficult to see why order declined so strongly in the active experiments if a purely non-biological process were responsible. On the other hand, an increase in the disorder of a biological measure can simply reflect the decline of a microbial population under deprivation or heat stress (a much smaller extant population surviving in the control experiments could nevertheless exhibit a small reduction in residual order over time for the same reason). In contrast the complexity measures on the rat temperature rhythm are very stable (e.g. Fig.4), an expected outcome from a continuously viable preparation. It is also possible that 46℃-51℃ is near threshold for the deleterious effects of heat stress on the microbial population, since one of the moderately heated soil samples produced a response that consistently sorted with the active experiments (VL2c2), while the other (VL2c4) always sorted with control experiments (In spite of an early, transient, possibly biological response, the dominant pattern over the rest of this experiment caused it to sort with the controls, see Fig.2).
It is important to say that, the nature of the LR gas (es) and the degree to which apparent circadian oscillations reflect CO2 solubility in moist Mars soil is not completely resolved. Nevertheless, if the LR gas evolution in the active experiments were entirely non-biological, it would sort with the other purely physical, rather than biological processes. In actuality, LR gas evolution in the active experiments sorted with the biological measures, while gas evolution controls (e.g. heat-sterilized) sorted with non-biological measures. We believe that these results provide considerable support for the conclusion that the Viking LR experiments did, indeed, detect extant microbial life on Mars.
??????????????????????????????????????????????????????????????????????????????????????????????????????????????????
>
Appendix #1. Brief description of complexity variables
Relative LZ complexity, LZ: Relative LZ complexity is a measure of the algorithmic complexity of a time series [27]. According to the Kaspar and Schuster algorithm, each data point is converted to a single binary digit according to whether the value is less than, or greater than, the median value of a set of data points [28]. Applying the software used in the present paper to known series, LZ results are:
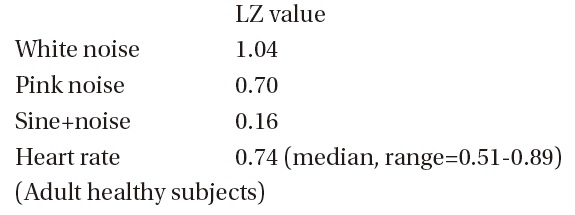
White noise (a pure random signal, common in physical systems, that exhibits equal power across all the component frequencies of the signal), has an LZ value that is close to 1.0. Pink noise (flicker noise or 1/f noise), exhibits decreasing power as frequency increases, and is associated with a relatively low LZ value; it is common in biological systems (see Heart rate). A sine function with 10% superimposed Gaussian white noise yields an LZ value that is close to zero. The algorithm for calculating LZ, applied in the present paper, converts it to a single binary digit which indicates whether the value was less than, or greater than, the median value of a set of at least 92 such data points.
Hurst exponent, H: The Hurst exponent is the slope of the root-mean-square displacement of each data point versus time. Applying the software used in the present paper to known series, H values are:

The H value for white noise is equal to 0. If H ≠ 0.5, then correlation exists, the noise is “colored” and the process exhibits a “memory”: if the exponent is greater than 0.5, persistence occurs (past trends will statistically persist in the future, see sine function), and, vice versa, if H is less than 0.5, anti-persistence occurs (past trends tend to reverse in the future, see Pink noise and biological signals such as Heart rate). For Brownian motion, a random process in which, on average, each point moves away from its initial condition by an amount that is proportional to the square root of time, the Hurst exponent exhibits a value which is close to 0.5 (no memory) [29].
Largest Lyapunov Exponent,
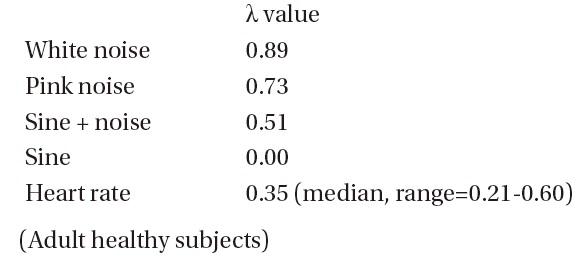
The exponent is numerically high for pure randomness (white noise). Pink noise and biological signals e.g. Heart rate, exhibit relatively low values. λ =0 (or a negative value) for purely periodic data, such as the sine function.
Correlation Dimension, CD: The fractional correlation dimension was obtained by counting the data points that are inside hyperspheres of various radii centered on each data point in a phase space of some embedding dimension, according to a published algorithm [31]. The correlation dimension in these data sets was calculated with embedding dimensions between 1 and 10. A plot of correlation dimension vs embedding dimension was performed and the value of the Correlation Dimension (CD) at plateau was chosen.
A simple deterministic function, such as a sine function, exhibits a CD value that is close to 1, while a purely random distribution exhibits a CD value of 6 or more. Biological signals, such as Heart rate exhibit CD values that are less than 6, but are larger than 1.
Entropy, K: The entropy index chosen here [32] is a measure of the disorder in a data set and was calculated as the sum of the positive Lyapunov exponents.
Randomness is indicated by numerically high values of entropy. Ordered series like the sine function exhibit values that are close to 0.
BDS statistic, BDS: The Brock-Dechert-Scheinkman statistic detects serial dependence in time series and can thereby quantitate the deviation of the data from pure randomness. Applying the software used in the present paper to known series, the results are as follows:
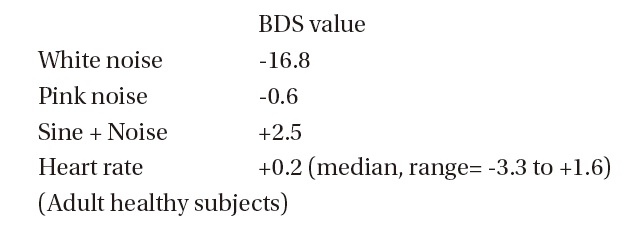
In short discrete time series, pure randomness (white noise) exhibits BDS values <<0, while more ordered series exhibit greater values of BDS [33] .
Correlation time, τ: A measure of how dependent data points are on their temporal neighbours. It is taken as the time at which the correlation function first falls to 1/e. By applying the software used in the present paper to known series, the results are as follows:
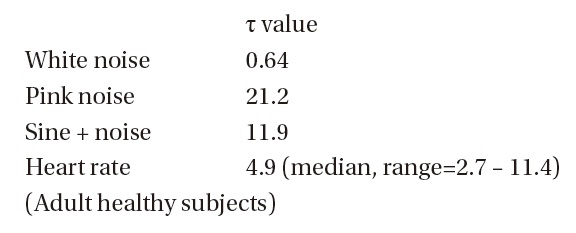
Pure random data (white noise) will have no intercorrelation and the τ value will be close to zero [34]. Larger correlations with time result in larger τ values.
??????????????????????????????????????????????????????????????????????????????????????????????????????????????????
[Table.2] 1Active or Control sample

1Active or Control sample
>
Appendix #2 Viking Mission Labeled Release Experiment Results
The LR controls established that the “active agent” detected in the Martian soil was destroyed at 160℃, was greatly impaired at 46℃, essentially destroyed at 51℃, and fully depleted after storage in the dark inside the sample distribution box at approximately10℃ for three and four months at the respective sites. All the results were supportive or consistent with the detection of a biological agent.
??????????????????????????????????????????????????????????????????????????????????????????????????????????????????
Figure 1. Cluster analysis discriminates active and control LR experiments. The top panel gives the two cluster result for K-means clustering of all Viking LR studies, VL1c1-VL1c4, VL2c1-VL2c5, the two ground-based studies, microbepositive Biol 5 and sterilized Biol 6, VL1 atmospheric temperatures, VL2c3 detector temperatures, plus two anchor cases, a terrestrial rat circadian rhythm, and random preinjection radioactivity. The means ± S.E. for the active (red bars) and control (blue bars) clusters are given for each of the six complexity variables which discriminated the clusters. The bottom panel shows only the VLR study means across the same complexity variables for the active (red bars) and control (black bars) clusters. The cluster membership (all data series) was further validated by a two-group discriminant analysis. This showed that the two clusters were easily discriminated (Lambda =0.03, df=5,1,13; approximate overall F=59.1, df=5,9, p< .001). For the LR studies alone (Lambda=.028, df=4, 1, 9; approximate overall F=51.4, df=4,6, p< .001. N for each experiment varied from 790 (VL1c2) to 6879 (VL2c3) data points.
Figure 2. Hurst analysis of VL2c2 and VL2c4. This graph compares the raw LR scores with the complexity variable H on every sol throughout experiments VL2c2 and VL2c4 in which the soil samples were heated to intermediate temperatures (51℃ and 46℃, respectively) before the nutrient administration. The top panel shows the complexity score H which is maintained at a high level for most of VL2c2, even though the amplitude of the circadian oscillations is markedly reduced following partial sterilization. When the LR values drop to baseline noise (~ 140 cpm; e.g. sols 10-11, or after sol 13 in VL2c2), H values drop to near zero. This pattern resulted in this experiment automatically sorting with active experiments in the cluster analysis. In contrast, the bottom panel shows relatively high H values for VL2c4 for the first few sols which decline rapidly over the rest of the experiment. Since the cluster analysis is performed on the average complexity response, indices like H cause this experiment to automatically sort with the control experiments, in spite of an early transient response. This possibly indicates a rapidly expiring biosignature due to the thermal exposure. N=1203 data points and 14 H measures for VL2c2; 2128 data points and 23 H measures for VL2c4.
Figure 3. Complexity measures differ radically between the active and control LR experiments. Top panel: Radioactivity counts (RC) in cpm plotted against time in sols from first nutrient injection to second nutrient injection for an active experiment (VL2c3) and the 160 ℃ sterilization control (VL1c2). Note oscillations beginning at about Sol 1 on the x axis. N=555 data points for VL2c3 and VL1c2.
Bottom panel: The Hurst exponent H is plotted as in the top panel but Sol 0 is pre-injection background radioactivity for which the expected value of H is zero. An independent two-tailed t test was calculated for eight daily H values in the active sample (VL2c3) vs. the eight daily H values for the full sterilization control (VL1c2), N=16 data points, df=14, t=3.76, p< .005.
Figure 4. Complexity scores for first six sols discriminate individual active and control experiments. This graph plots individual complexity scores starting with pre-nutrient injection background radioactivity (a good example of white noise) and extending across the first six sols of an active VLR experiment (VL2c3), the sterilization control (VL1c2), a microbe-positive terrestrial control (Biol 5) a sterile terrestrial control (Biol 6) and a rat circadian temperature rhythm that functions as another terrestrial positive control. The top panel plots LZ vs Sols, the middle panel plots H vs. Sols and the bottom panel plots λ vs. Sols for the various time series. N=92 data points, each taken every 16 min, constituting one sol of data per complexity measure. Note that H=0 for preinjection radioactivity and that Biol 5 and Bio6 do not have pre-injection radioactivity scores or scores on Sol 6.
Figure 5. Average complexity measures vs. time in sols discriminate active and control LR experiments.
This figure plots the mean values of the active (N=5; VL1c1, VL1c3, VL2c1, VL2c2, VL2c2) vs. the control Viking LR experiments (N=4; VL1c2, VL1c4, VL2c4, VL2c5) for each of the three complexity indices (LZ, H, λ ) against time in sols. Top panel: LZ vs Sols. Middle panel: H vs. Sols. Bottom panel: λ vs. Sols. Error bars are SEM. For the Between Clusters effects on each complexity variable (df=1,9), F=9.26, p=.01 for LZ; F=17.46, p< .002 for H; F=6.44, p=.03 for λ