It is generally believed that the occurrence of a magnetic storm depends upon the solar conditions, particularly the southward interplanetary magnetic field (IMF) component. Some researchers have suggested a relationship between magnetic storms and solar wind parameters (Weigel 2010). Wu & Lepping (2006) investigated geomagnetic activity induced by interplanetary magnetic cloud (MC) during the past four solar cycles, 1965~1998, and found that the intensity of geomagnetic storms is more severe in a solar active period than in a solar quiet period.
As suggested by some researchers, it is important to discuss the interplanetary drivers causing geomagnetic storms. Echer et al. (2008) also identified the interplanetary causes of intense geomagnetic storms and their solar dependence occurring during the solar cycle 23 (1996~2006). They concluded that the most important interplanetary structures leading to intense southward
On the other hand, many studies have examined the role of solar wind parameters in the development of geomagnetic storms. Choi et al. (2008) investigated the statistical characteristics of solar wind dynamic pressure enhancements during geomagnetic storms. In their study, about 81% of storms studied indicate at least one event of dynamic pressure enhancements. Weigel (2010) quantified the influence of solar wind density using two statistical measures, and concluded that the solar wind density modifies the ability of a given value of the solar wind electric field to create a
It is well known that magnetic storms are caused by enhanced magnetospheric convection during a prolonged period of southward IMF (Burton et al. 1975). On the other hand, Du et al. (2008) studied a geomagnetic storm that occurred on 21-22 January 2005, and found that magnetic storm is highly anomalous because the storm main phase developed during northward IMFs. They have interpreted this case as energy storage in the magnetotail and delayed release into the magnetosphere.
After classifying MC polarity, Echer et al. (2005) presented a statistical study of MC parameters and geoeffectiveness.Considering that the IMF polarity of developing magnetic storms is important, it would be interesting to examine the influence of polarity change during magnetic storms. To identify the dependence of IMF polarity change, magnetic storms are divided into CME-driven storms, CIR-driven storms, and complicated types. Then, variation of magnetic field polarity (
Hourly average values of solar wind plasma and magnetic field data were obtained from National Aeronautics and Space Administration (NASA)'s OMNIWeb site (http://nssdc.gsfc.nasa.gov/omniweb) during 1997~2003. Magnetic field components are given in the GSM. To analyze the variation of IMF polarity and solar wind parameters, these data are used during the period of magnetic storms. Storms are classified according to their solar wind driver, including CME and CIRs. According to Borovsky & Denton(2006), CME-driven storms include CME sheaths, MC, and ejecta, while CIR-driven storms contain high-speed streams. Sheath fields present in the region between the interplanetary shock and the interplanetary CME (ICME). MC is characterized based on the following criteria: strong magnetic field, rotation of a large angle direction, low proton temperature, and low plasma beta (Burlaga et al. 1981). MC is classified as ejecta if it is hard to identify the rotation of magnetic field (Oh et al. 2007). CIR corresponds to an interaction region between low and high solar wind speed. It is also characterized by high proton temperature, and low number density.
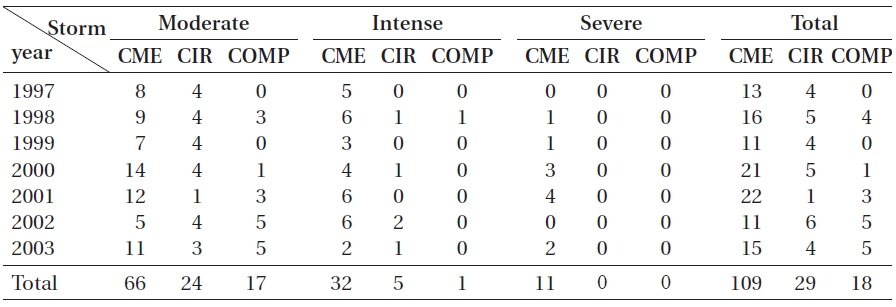
From some reference criteria, CME and CIR-driven storms were selected through an inspection of the data available OMNIWeb site. Through this process, a total of 156 storms were selected from the period of 1997~2003, that is, 109 (69.9%) CME-driven storms, 29 (18.6%) CIR-driven storms, and 18 (11.5%) complicated types. As mentioned above, complicated types were not included in this analysis.
The
[Table 1.] List of magnetic storms used in this study.

List of magnetic storms used in this study.
total of 156 magnetic storms, including 11 severe storms, 38 intense storms, and 107 moderate storms, were selected from the period of 1997~2003. Table 1 shows the list of storms used in this study during the main phase of magnetic storms. Assuming that the ring current provides the main contribution to the
3.1 Variation of Magnetic Field (By, Bz) Polarity during the Main Phase of Magnetic Storms
Tsurutani et al. (1988) noted that magnetic storms are caused by long duration, intense southward IMFs. As mentioned in the introduction, Du et al. (2008) studied about a storm main phase during northward IMFs. Considering that the direction of IMF is important for magnetic storms, it would be worth investigating the interplanetary conditions of IMF
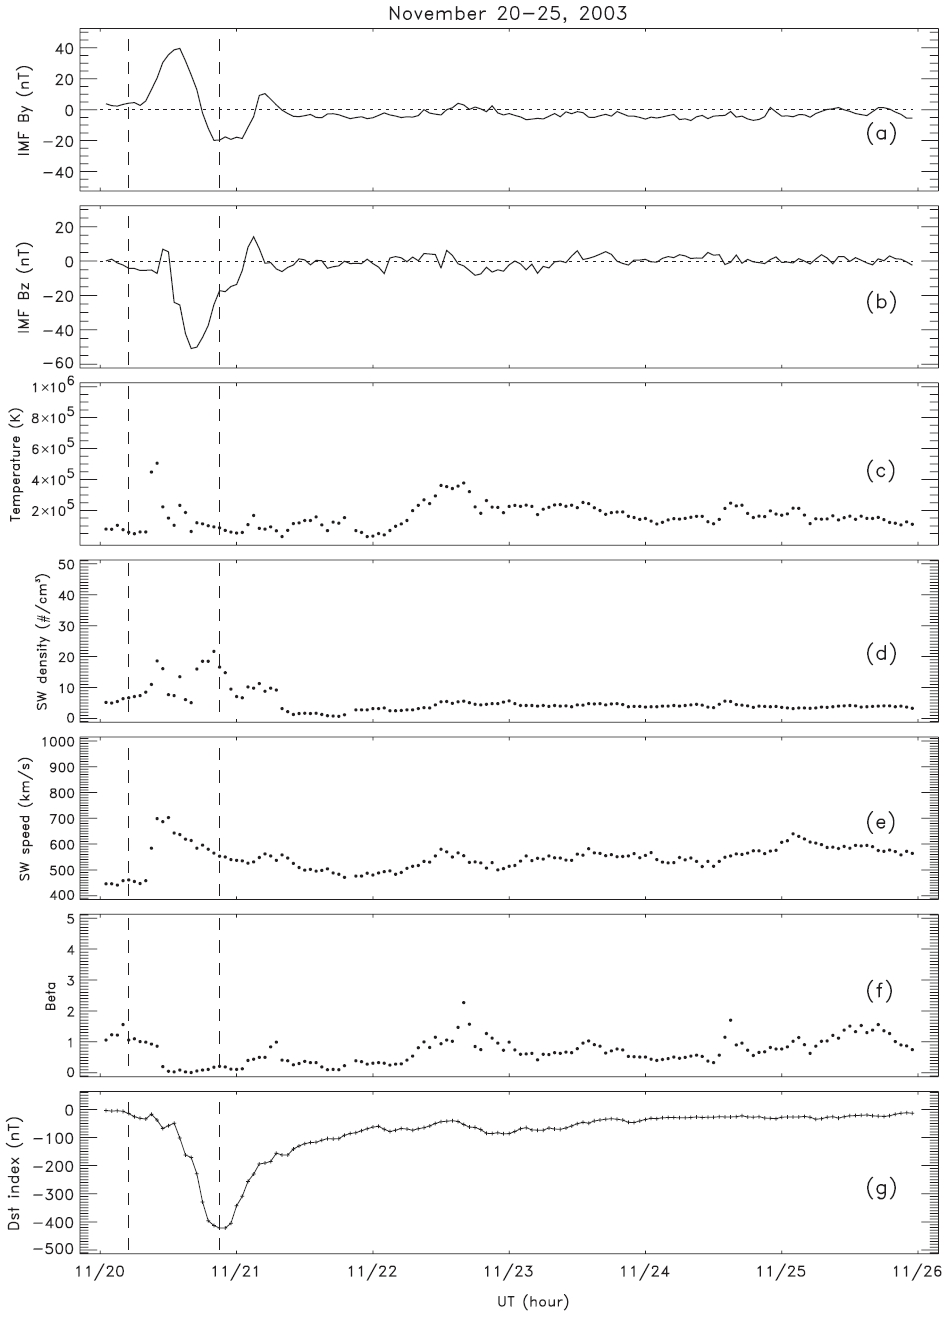
Fig. 1 shows temporal variations of (a)
It is believed that the Bz component of IMF is more important than By on the development of magnetic storms. For this reason, Bz component was inserted in the first column of Table 2. Table 2 shows the classification of interplanetary conditions in terms of IMF
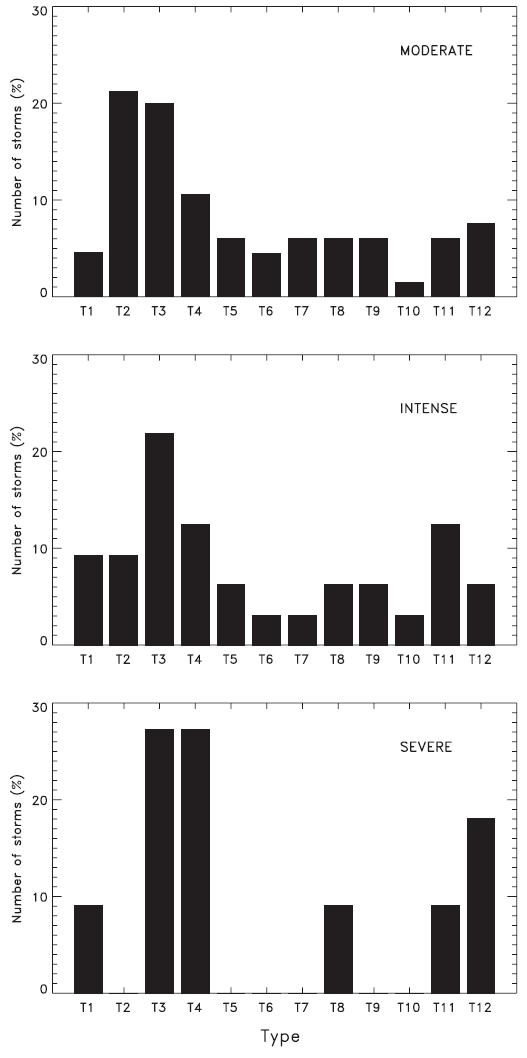
histograms for 12 types during the main phase of CME-driven storms with the three storm categories. Since the number of storms in each category is not the same, the vertical axis is expressed in terms of a percentage value. For the CME-driven storms, it is found that the average number of storms for negative sign of IMF
[Table 2.] Classification of interplanetary conditions in terms of IMF Bz and By signs.
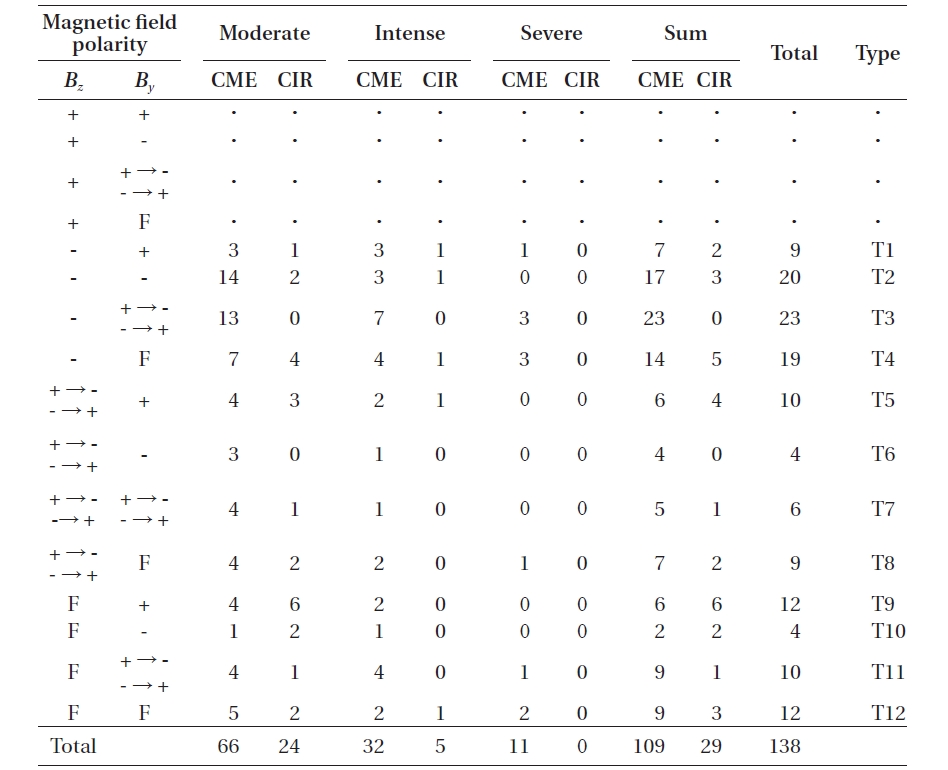
Classification of interplanetary conditions in terms of IMF Bz and By signs.
respectively. For the moderate storms, T2 shows the highest number of storms, while T3 has the highest percentage value for intense and severe storms. In particular, the sum of T3 and T4 for the severe storms is more than half in CME type storms. It is noted that IMF
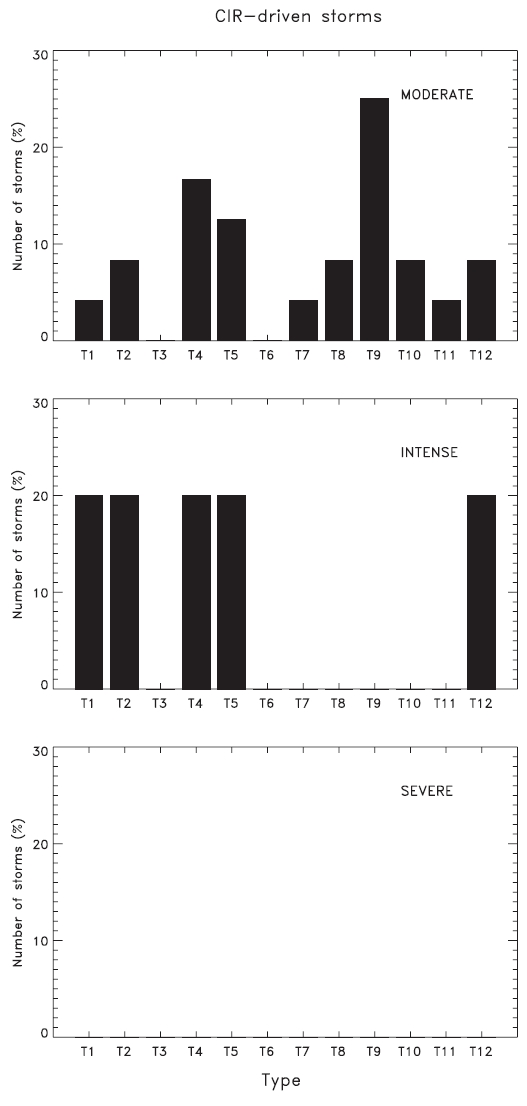
On the other hand, the results for CIR-driven storms are different from those for the CME storm type. As shown in Fig. 3, the percentage of storms for T1~T4 is found to be low, at 29.2%, compared to that of T9~T12, which is 45.8% for moderate storms. When the condition is
Echer et al. (2008) investigated the dependence of peak
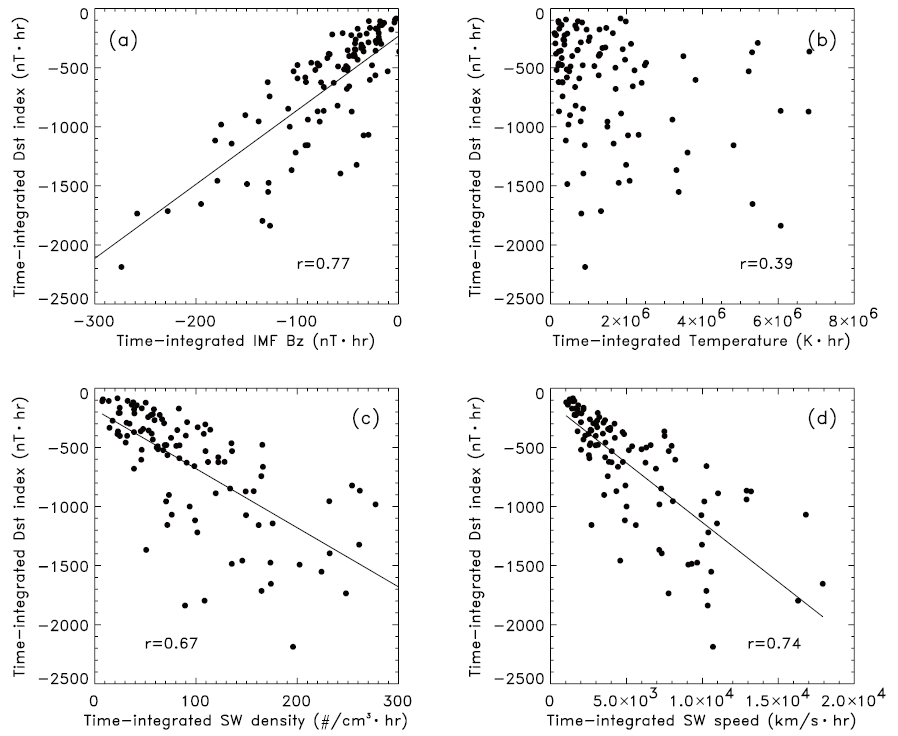
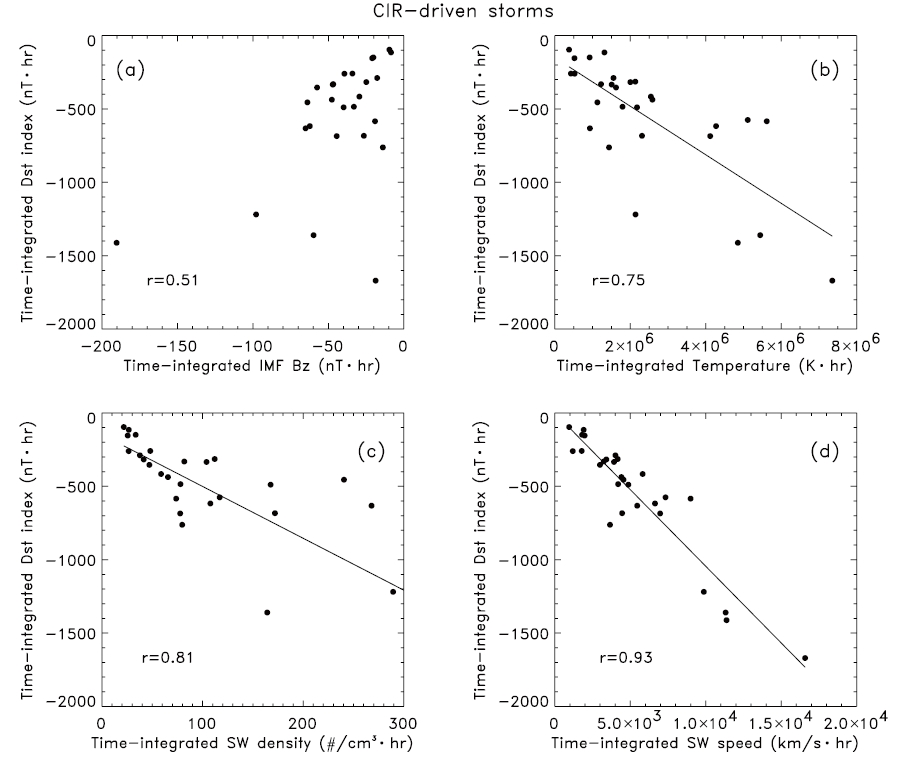
Fig. 4 shows the correlations between the time-integrated Dst index and various solar wind parameters for the CME-driven storms: (a) time-integrated IMF
the main phase for the CME-driven storms. On the other hand, no direct relation seems to exist between time-integrated temperature and time-integrated
Table 3 shows the average values between the properties of CME-driven storms and CIR-driven storms. As can be seen from Table 3, for the CME-driven storms, |
the CIR-driven storms, and |
[Table 3.] The average values between the properties of CME-driven storms and CIR-driven storms.
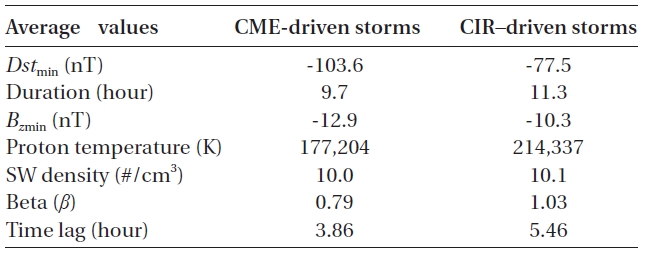
The average values between the properties of CME-driven storms and CIR-driven storms.
CME-driven storms. Also, temperature for the CIR-driven storms is higher than that of the CME-driven storms. Average beta (β) is low, at 0.79, for CME-driven storms while beta is above 1.00 for the CIR-driven storms. These results correspond to the results obtained by Borovsky & Denton (2006). According to Borovsky & Denton (2006), plasma density is described as more superdense for CME-driven storms than for CME-driven storms. However, plasma density for the CME storms is similar to the CIR-driven type in the present work. This may be due to the selection criteria and periods used.
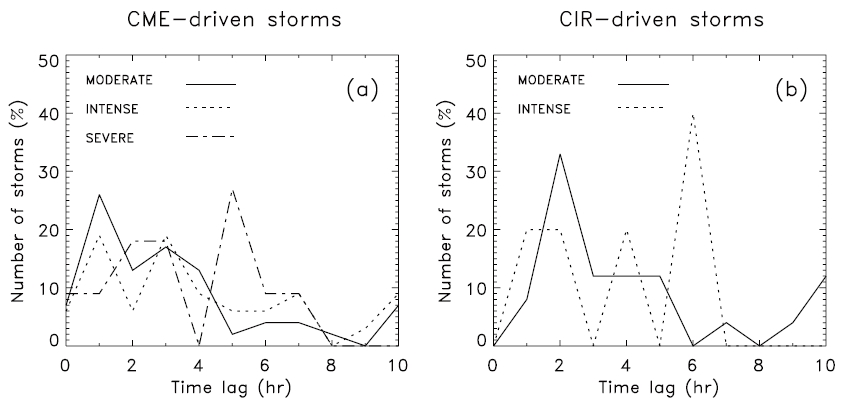
3.3 Time Lag with Storm Size for CME-Driven Storms and CIR-Driven Storms
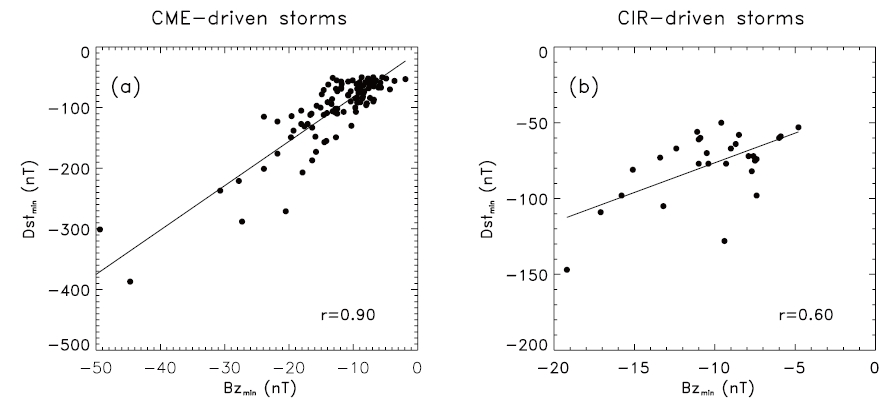
Fig. 6 shows the relationship between
cases are different. The relationships between
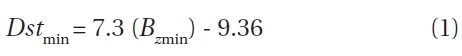
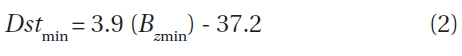
Eqs. (1) and (2) are for the CME-driven storms and CIR-driven storms. Compared with Figs. 6a and b, the slope in Fig. 6a is about two times higher than that of Fig. 6b. When
Fig. 7 shows the comparison of time lag for the CME and CIR-driven storms with storm size. For the CME-driven storms, time lag of 26% moderate storms is one hour, whereas time lag of 33% moderate storms is two hour for the CIR-driven storms. The pattern of intense storms is similar to that of moderate storms for the CME-driven storms, but the pattern of time lag for the severe storms is different. For CIR-driven storms, time lag of moderate storms is concentrated on two hours whereas that of intense storms is longer.
In this research, the manner in which the direction change of IMF
Several interesting results were summarized, and their implications briefly discussed. For the CME-driven storms, under steady conditions of
The correlation coefficient is highest, at 0.77, between the time-integrated IMF
The correlation coefficient between