Erbium-doped fiber amplifiers are essential devices in current high capacity fiber-optic telecommunication systems that are based on wavelength division multiplexing (WDM)technology [1]. Commonly used silica-based EDFAs are known to provide sufficient signal gain over an amplification bandwidth of ~30 nm in the C or the L bands,depending on the configuration. Even though the conventional silica-based EDFAs are well-suited for current WDM systems, there has been extensive work done in order to increase the EDFA gain bandwidth, due to the ever increasing demand for the expansion of data transmission capacity that has been caused by the large increase in the amount of data traffic on the Internet.
Ultra-wideband EDFAs that can cover a gain bandwidth of more than 50 nm have been successfully demonstrated using EDFs based on non-silica host materials, such as tellurite [2], bismuth oxide [3], and antimony silicate [4].Among the non-silica host material-based EDFs, the tellurite and bismuth oxide based ones are known to be capable of providing sufficient signal gain over the C and the L bands. The demonstrated gain bandwidth of tellurite and bismuth oxide EDFAs was ~70 nm, whereas the bandwidth of the antimony silicate EDFAs was ~50 nm. Another benefit of the tellurite and bismuth oxide EDFs is found in their high erbium doping concentration, which is enabled by the host materials’ high solubility to erbium ions. This feature is useful in the creation of compact fiber amplifiers with short fiber lengths.
Compared to both the antimony silicate-based and the tellurite-based EDFs, a huge benefit in using bismuth oxidebased EDFs is the fact that they can be readily spliced to conventional silica fibers using a commercially available fusion splicer with a splicing loss of less than 0.5 dB [3].This shows that bismuth oxide EDFs are superior to the other new host materials in terms of the ease of integration with pre-existing silica fiber-based communication systems.
One concern in realizing high-performance ultra-broadband amplifiers using bismuth oxide EDFs is the limitation in the amplification performance due to the various inhomogeneous and nonlinear effects caused by the high erbium concentration and the large host material nonlinearity. A range of experimental and theoretical studies on such effects as four wave mixing [3], cooperative up-conversion [5], pump excited state absorption (ESA) [6], and signal ESA [7] have been carried out.
In addition to the above-mentioned effects, another important effect that needs to be investigated is the pairinduced quenching (PIQ). The PIQ is an inhomogeneous phenomenon caused by clustered ions when the Er3+ ions are not evenly distributed. The PIQ is known to be strongly dependent on the host material; it is always observed in highly Er3+-doped fibers [8]. In an ion pair,one ion (donor) transfers its energy to the other (acceptor)when both of them are excited. The donor ion relaxes to its ground state, whereas the acceptor ion jumps to a higher energy level and relaxes back to its metastable state[9]. The PIQ can thereby cause EDFA performance degradation, such as gain reduction.
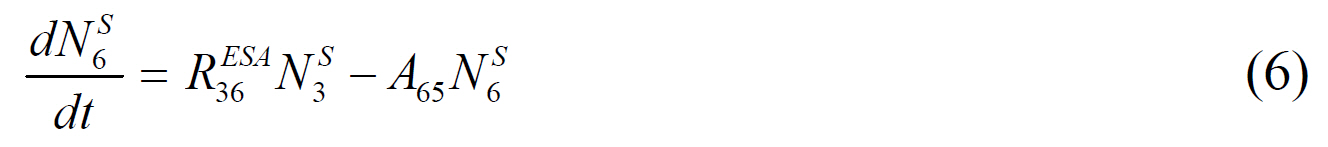
In this paper, we investigate the PIQ effect in a bismuth oxide-based EDFA in both a theoretical and an experimental manner. In the theoretical analysis we used a 6-level amplifier model that incorporates cooperative upconversion,PIQ, pump ESA, and signal ESA. In a comparison between the numerically calculated and experimentally measured gain and noise figure (NF) values, the relative number of paired ions is estimated to be ~ 6.02% in a commercially available bismuth oxide-based EDF. The impacts of the PIQ on the gain and the NF were also investigated.
This paper is organized as follows: In Section II the theoretical model used for this investigation is presented.In Section III the relative number of ion pairs in a commercially available bismuth oxide EDF is estimated, by comparing the numerically calculated gain and NF values with the experimentally measured ones. In Section IV, the PIQ is shown to be a significant degradation factor in the gain and NF performance. This is done by comparing the numerical and experimental output gains both with and without the PIQ. In Section V our conclusions are drawn from the obtained results.
II. THEORETICAL MODELING OF A BISMUTH OXIDE-BASED EDFA
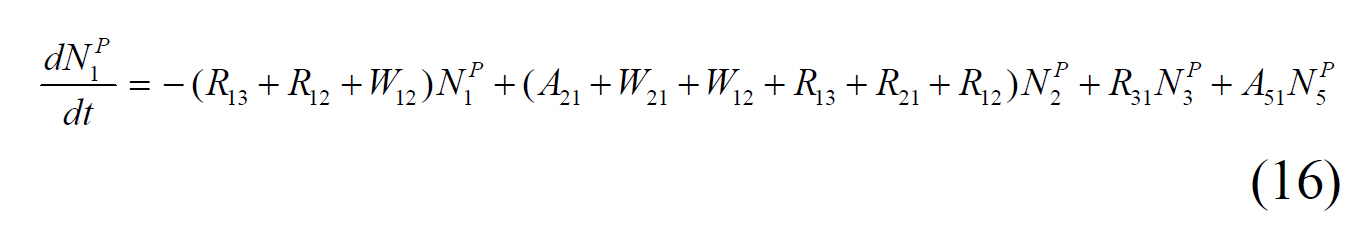
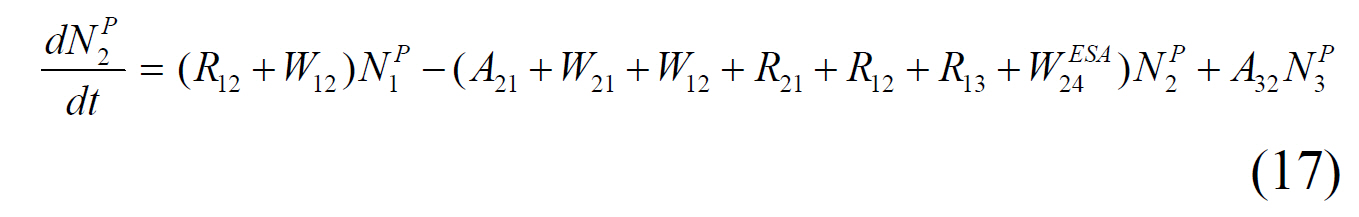
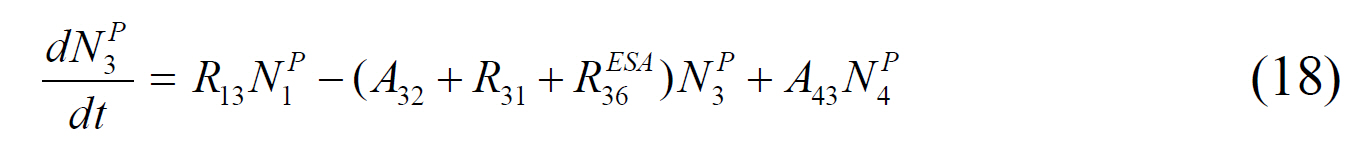
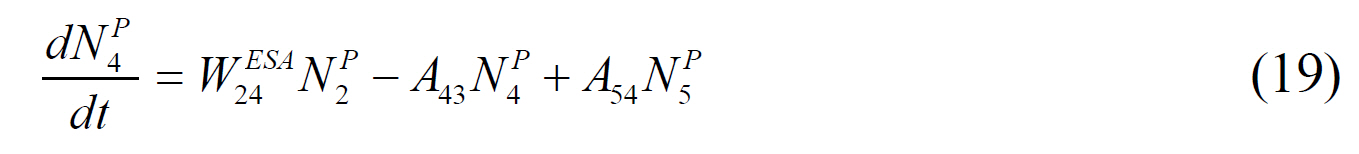
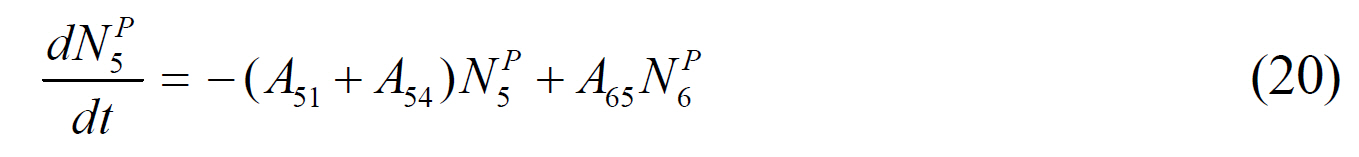
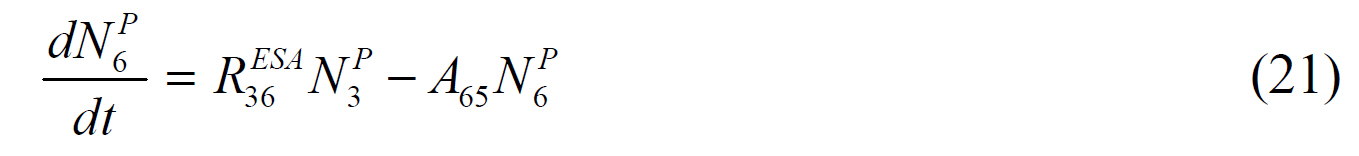
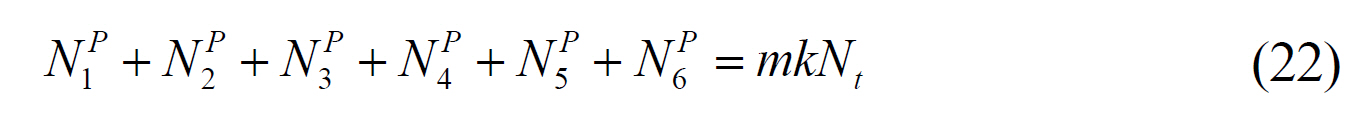
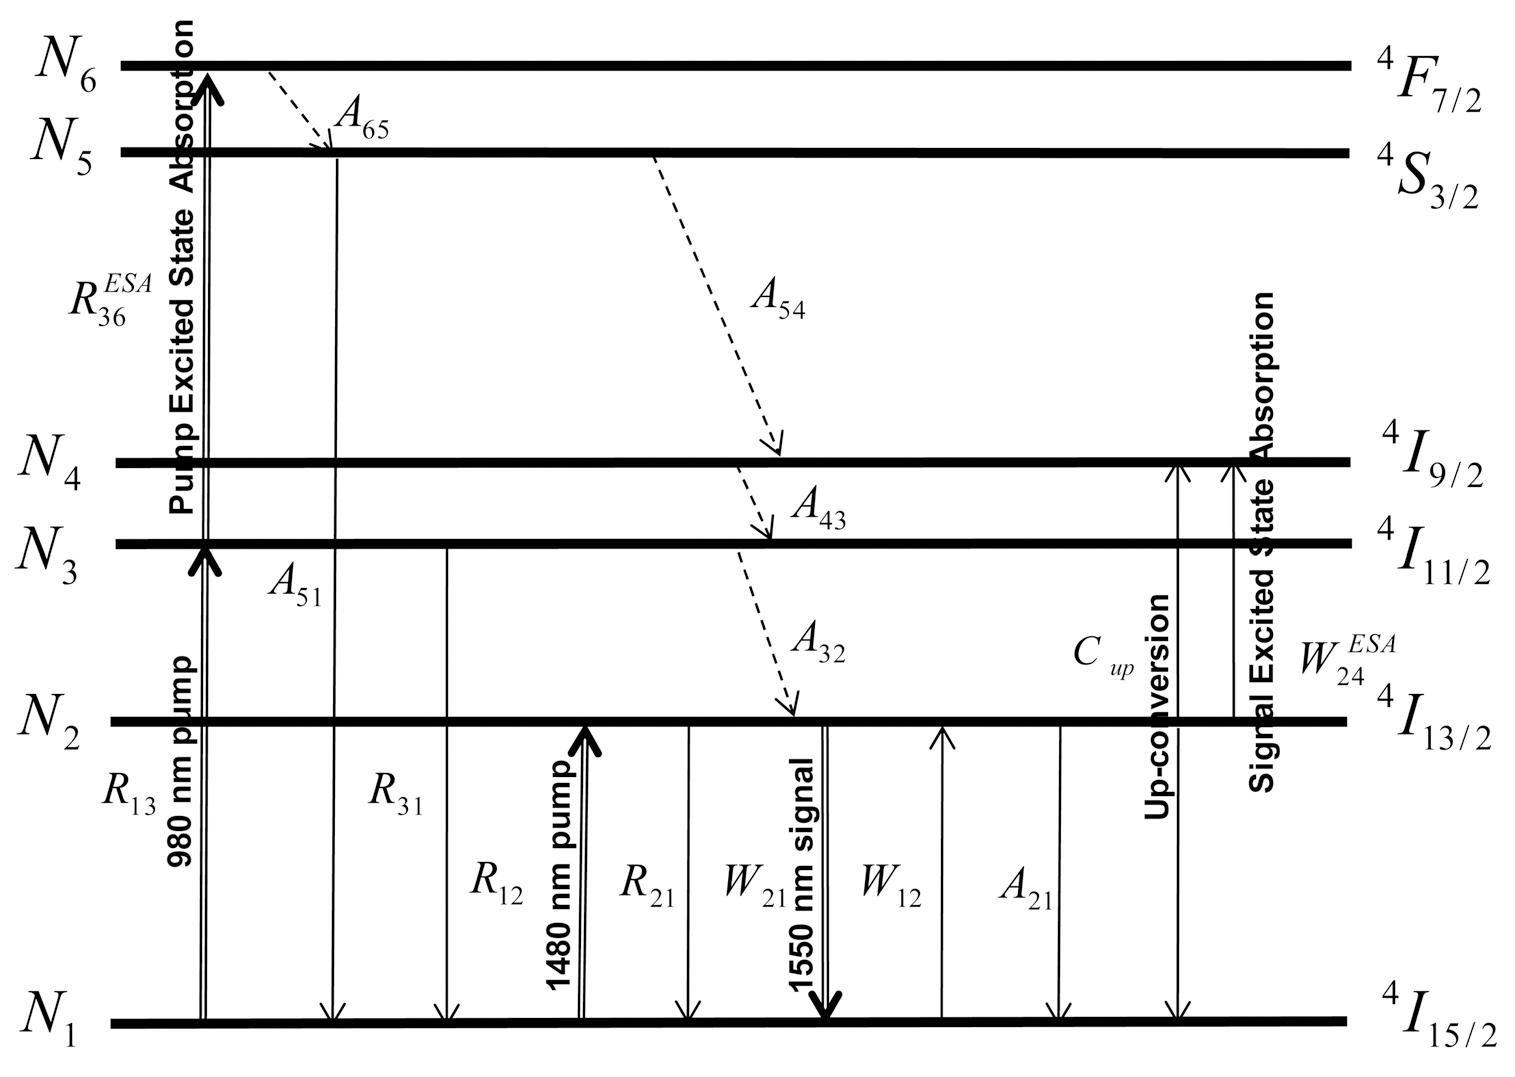
For the numerical simulation, the bismuth oxide EDFA was assumed to be a six level system composed of the
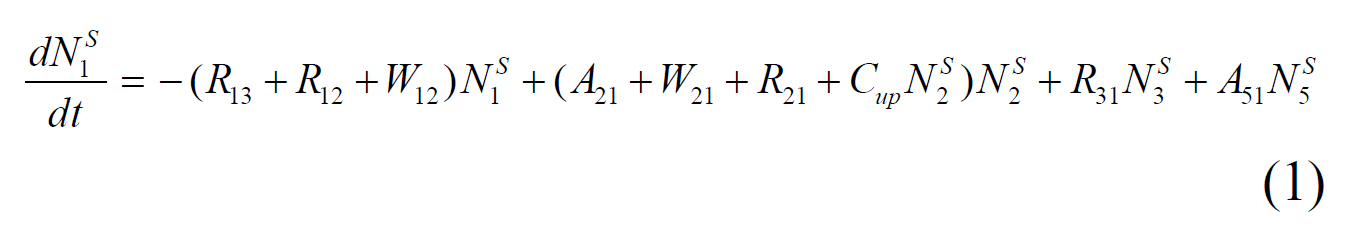
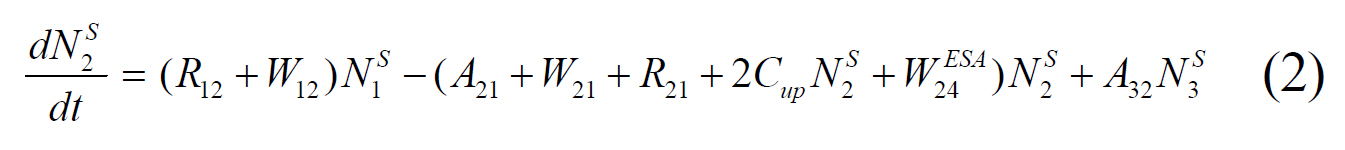
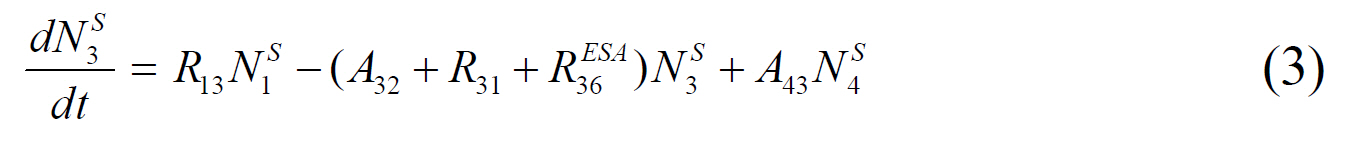
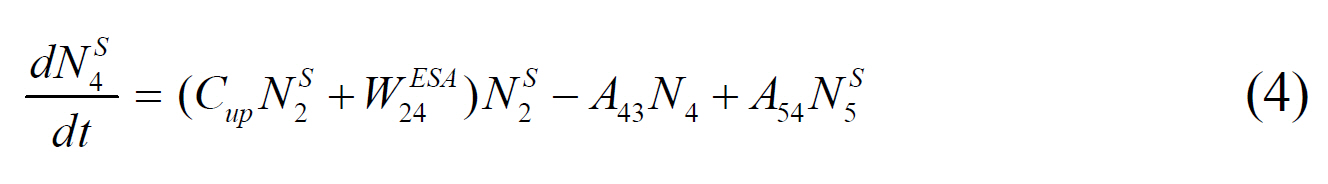
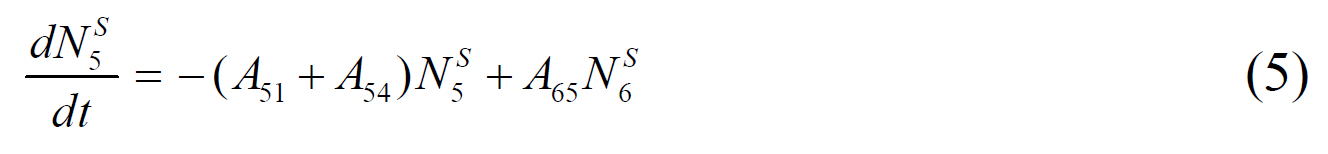

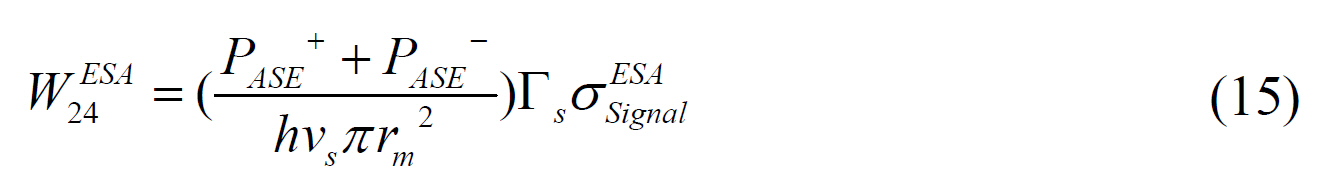
where
The superscripts of + and 1 indicate the relative beam propagation direction.
where


where
The evolution of the pump, signal, and ASE powers along the EDF length can be described through the following propagation equations:
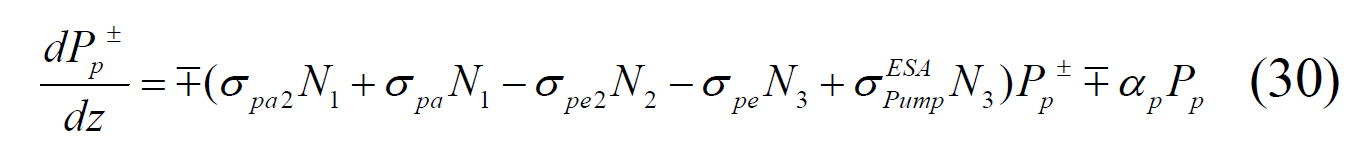
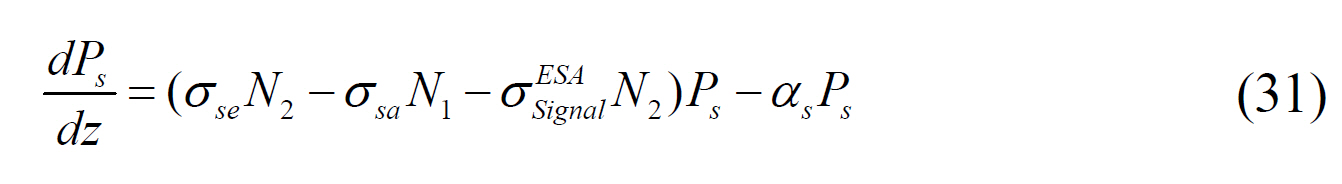
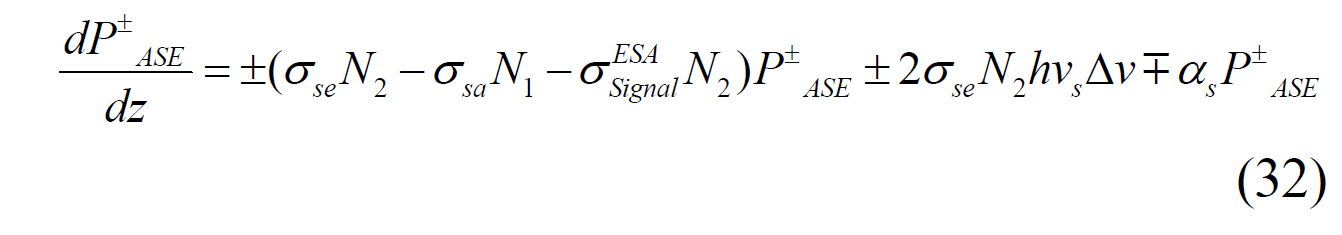
where
The initial conditions for the numerical calculation are as follows:
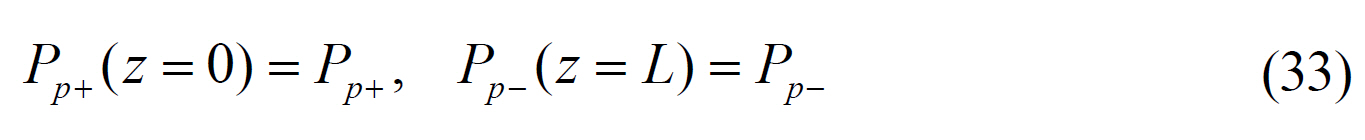


where
[TABLE 1.] Parameters of the Bismuth oxide-based EDF used
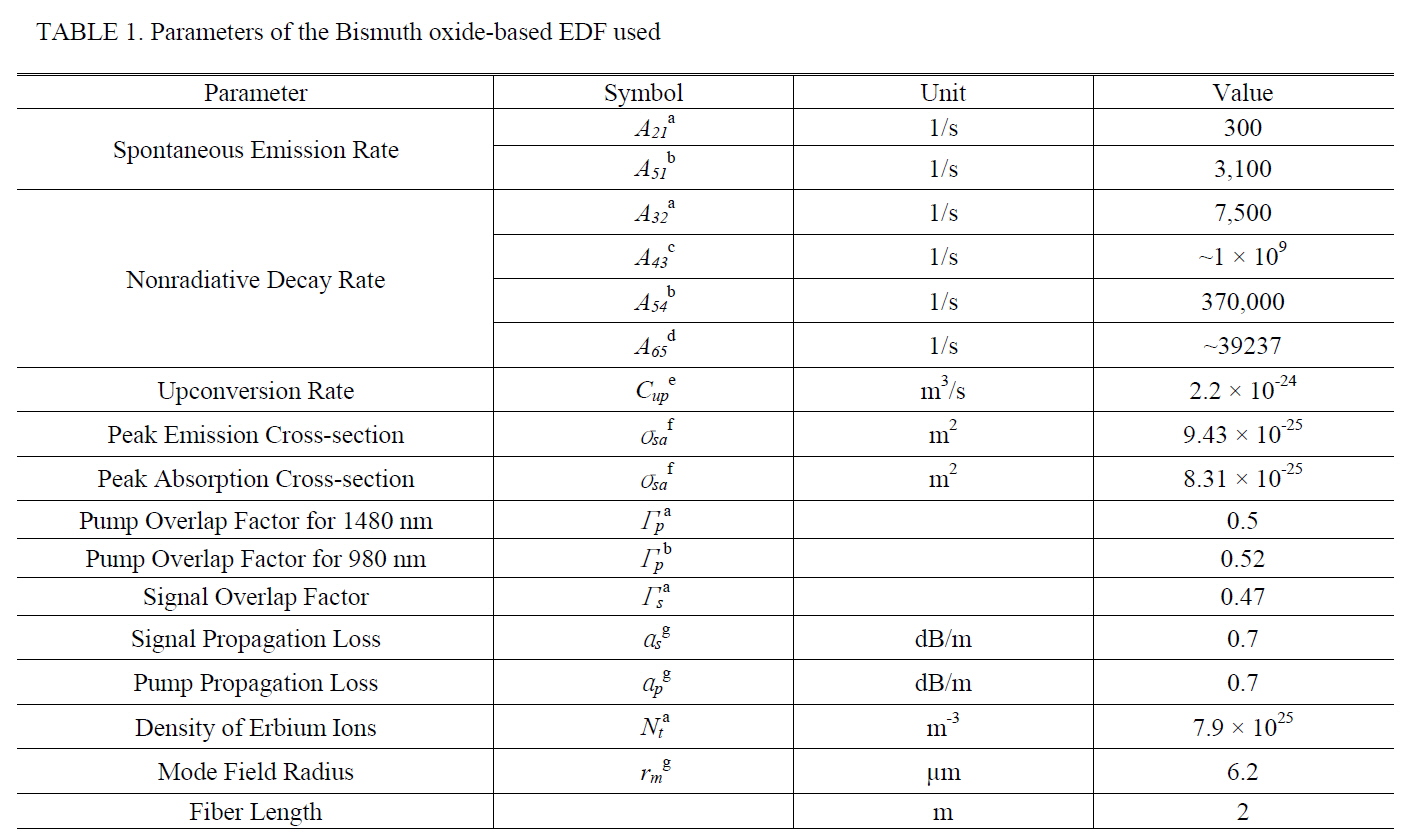
Parameters of the Bismuth oxide-based EDF used
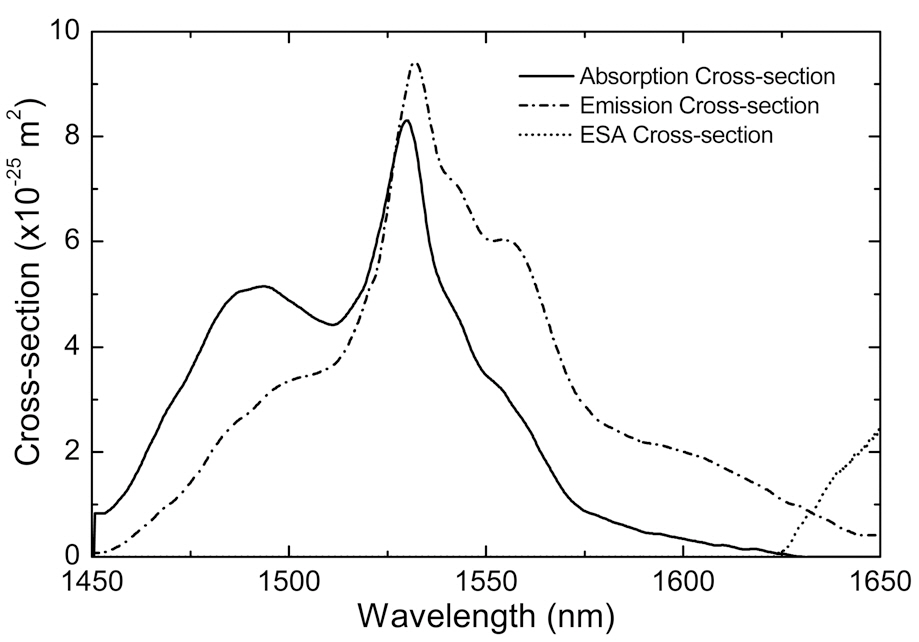
The signal absorption and emission cross-sections used in this work were obtained from [14, 15]. The pump ESA Cross-section was assumed to be
peak emission and absorption cross-sections are 9.43 × 10⁻²⁵ m2 at 1532 nm and 8.31 × 10⁻²⁵ m2 at 1530 nm, respectively.The signal ESA cross-section starts to appear at 1623 nm and increases monotonously up to 2.5 × 10⁻²⁵ m2 at 1650 nm. The signal ESA cross-section
III. ESTIMATION OF RELATIVE NUMBER OF PAIR IONS
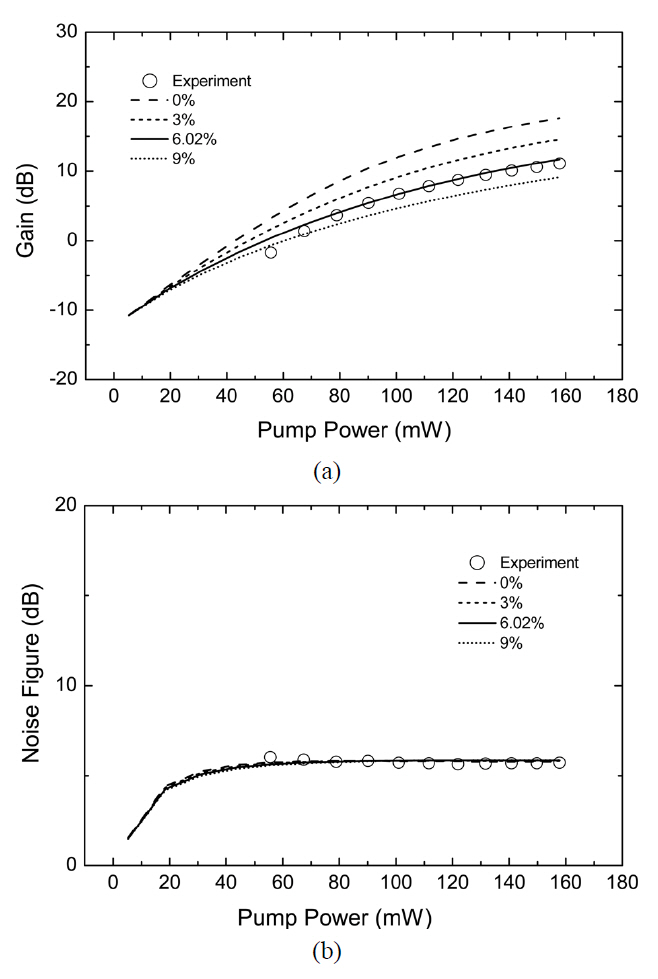
In order to estimate the relative number of paired ions(
Fig. 4(a) shows the numerically calculated gains for the four different
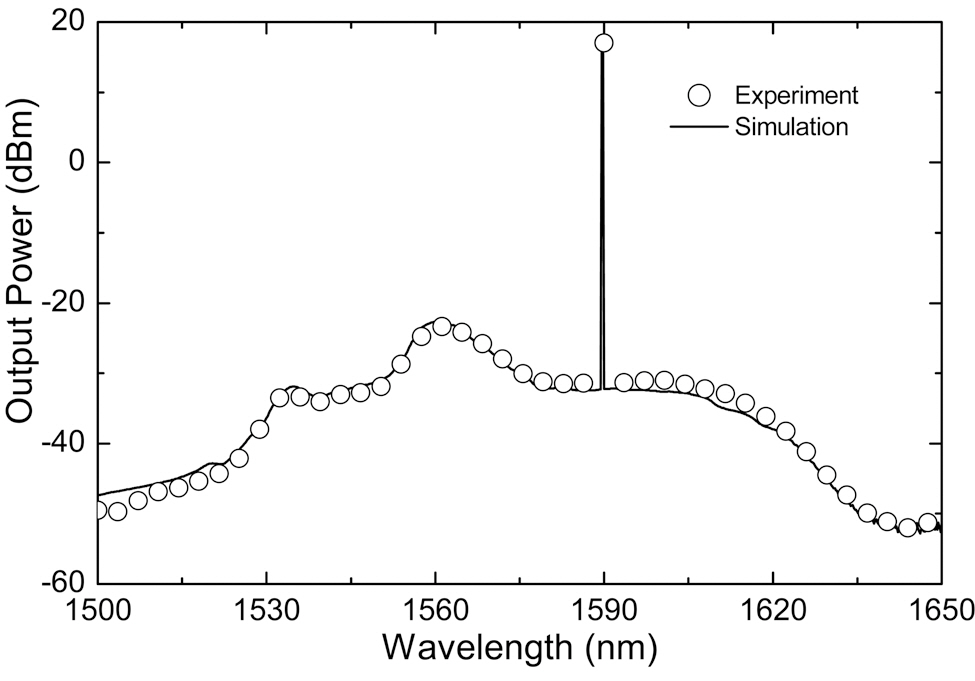
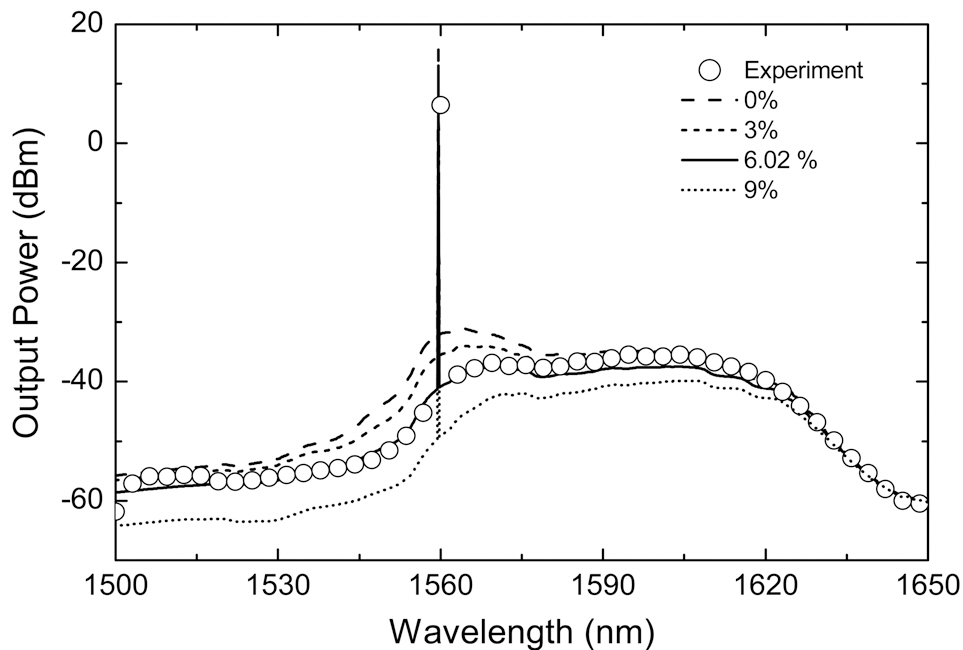
In order to confirm the estimated k value (6.02%) we carried out an output spectrum comparison. Fig. 5 shows the numerically calculated spectra for the various
It is clearly evident from the graph that
IV. IMPACTS OF PIQ ON GAIN AND NOISE FIGURE PERFORMANCE
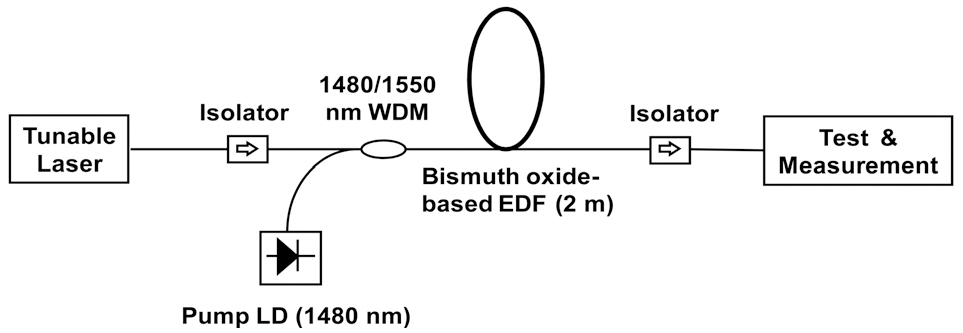
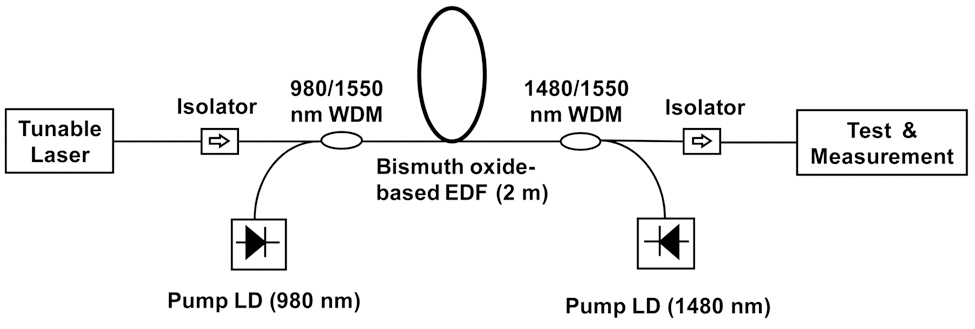
Finally, the impacts of the PIQ on the spectral gain and the NF were investigated. For this investigation, the experimental setup where the bismuth oxide-based EDF was pumped using a bidirectional pumping scheme is shown in Fig. 6. The forward pump power was 200 mW at 980 nm;the backward pump power was 160 mW at 1480 nm. The signal gain and the NF were measured and numerically simulated by sweeping the input signal beam wavelength from 1540 nm to 1635 nm by 5-nm steps in order to analyze the impacts of the PIQ. The input signal power was fixed at 0 dB m.
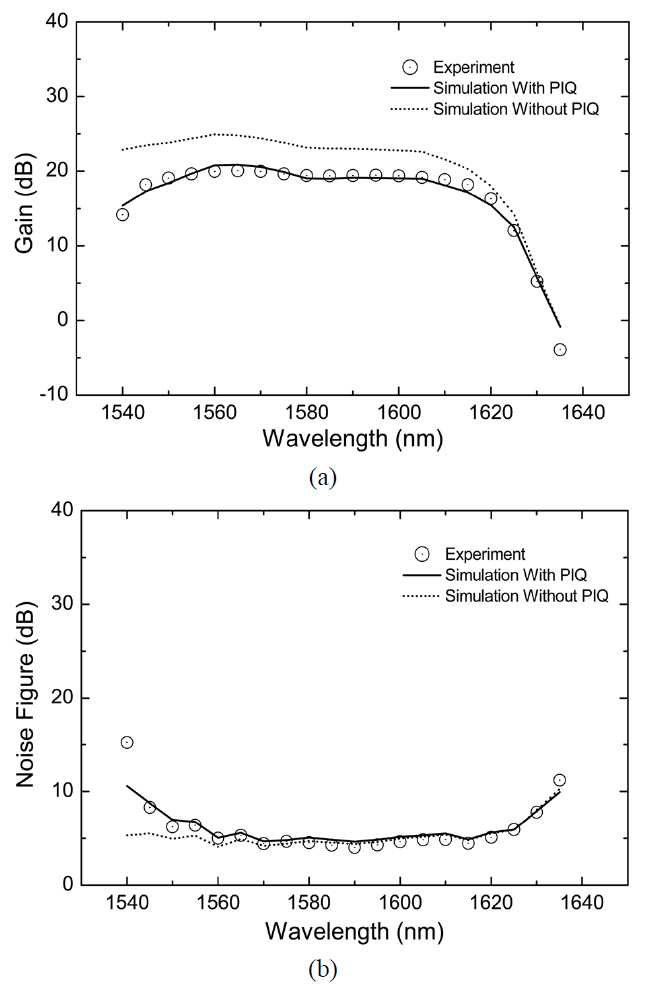
Fig. 7 shows the experimentally measured output spectrum along with the numerically calculated output spectrum based on
mental measurement, (ii) the numerical calculation with the PIQ, and (iii) the numerical calculation without the PIQ.The signal gain was observed to be reduced by ~5 dB over a gain bandwidth of ~90 nm from 1540 to 1630 nm,compared to the value that is supposed to be achieved without the PIQ.
Unlike the gain degradation dependent on the PIQ, the NF exhibited a completely different behavior. The NF was observed to remain unchanged at the wavelengths from 1560 to 1630 irrespective of the relative number of paired ions. This result is consistent with the observation found in Section III, where the NF at 1600 nm under the forward pumping scheme was fixed regardless of the relative number of paired ions. However, non-negligible NF degradation caused by the PIQ was observed at the 1540 ~ 1560 nm wavelengths. Such a spectral dependence of the NF degradation caused by the PIQ is believed to be due to the relative increase of the ion population at the metastable state despite the population inversion being unchanged.This effect needs to be further investigated
We have theoretically and experimentally investigated the pair-induced quenching effect in a commercially available bismuth oxide-based EDFA. By using the comparison between the numerically calculated and the experimentally measured gain values, the relative number of paired ions is estimated to be ~ 6.02% in the bismuth oxide EDF. The PIQ was observed to induce a ~5-dB gain reduction over a gain bandwidth of ~90 nm from 1540 to 1630 nm, compared to the value that is supposed to be achieved without the PIQ.Interestingly, NF degradation caused by the PIQ was observed only at the 1540 ~ 1560 nm wavelengths. This spectral dependence of the NF degradation caused by the PIQ needs to be further investigated.


![The absorption emission and signal ESA cross-sectionsof the bismuth EDF used in this study [7 14 15].](http://oak.go.kr/repository/journal/10733/E1OSAB_2010_v14n4_298_f002.jpg)