Pattern recognition can be applied to various kinds of fields, especially facial appearance, fingerprints, handwriting,and character recognition [1-7]. The joint transform correlator(JTC) has shown remarkable achievements for real time pattern recognition and target tracking applications [8-16]. The introduction of color information in the pattern recognition has become increasingly important, especially because of the wide spread of electronic image-acquisition devices such as color CCD cameras. The introduction of color information in pattern recognition by optical correlation is usually made by means of a multi-channel correlation technique that decomposes the source and the target color images in three red, green, and blue RGB channels. The correlation is made separately for each channel, and arithmetic or logical point-wise operations can be used to derive the final output [17-19]. The concept of separation into color channels led to the development of multi-channel optical color pattern-recognition systems. The multi-channel methods perform the correlation process in parallel for all the color channels that compose the image by the utilization of coherent optical correlators that are illuminated simultaneously with a few coherent sources, each having a different wavelength. The output plane consists of a set of superimposed correlation distributions that must be analyzed independently and composed together to render the detection decision. A common way in which objects are optically recognized is by use of a multi-channel JTC in which a filter matched to the target is used in each channel. The typical advantages of the JTC are that it uses a type of real time optical system which quantitatively analyzes and compares the color images by measuring a correlation peak and peak signal to-noise ratio (PSNR). A disadvantage of this approach is that it requires three different channels, which increases the system cost. For example, a spatial light modulator (SLM) is needed at each channel, two lenses are required at each channel, and an extra beam splitter and a mirror are also needed. The concept of multi-channel single output color JTC configuration was initially proposed by Deutsch to overcome such disadvantages[20]. However, the multi-channel single output color JTC has to take into account the separation between the input target image and the reference image. Deutsch [21] found that the separation between the input target image and the reference image for the same color must be the same and also larger than the sum of the widths of these images in order to prevent any unwanted overlapping between correlation outputs. To yield sharp correlation peaks, Alam et al. proposed a fringe-adjusted JTC based on Newton-Raphson algorithm [22]. However, they still used multi-channel and single output JTC to improve correlation discrimination.
We propose a new technique of color pattern recognition by decomposing the color image into three color components and recombining those components into a single gray image in the input plane. This new technique needs single input channel instead of three input channel and single output CCD camera, thus a simple JTC can be used. We present various kinds of simulated results to show that our newly proposed technique can accurately recognize and discriminate color difference. In the following section II, conventional multichannel color pattern recognition JTC and its basic theory is presented. In the section III, the proposed new method of single input channel and single output color pattern recognition JTC system are described in detail. Section IV describes simulation results for the color pattern recognition and, finally some comments are contained in the conclusion.
II. MULTI-CHANNEL SINGLE OUTPUT JTC
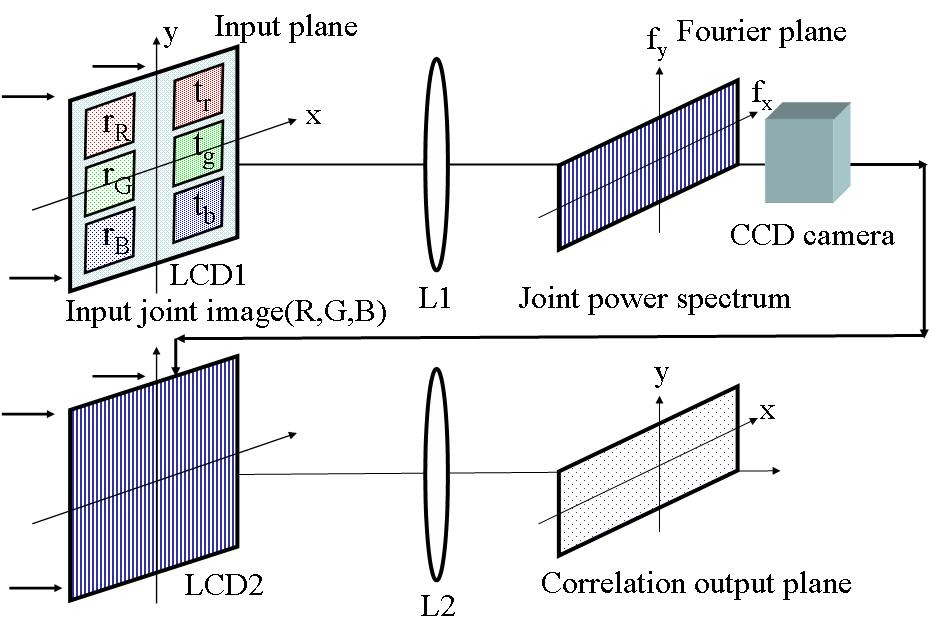
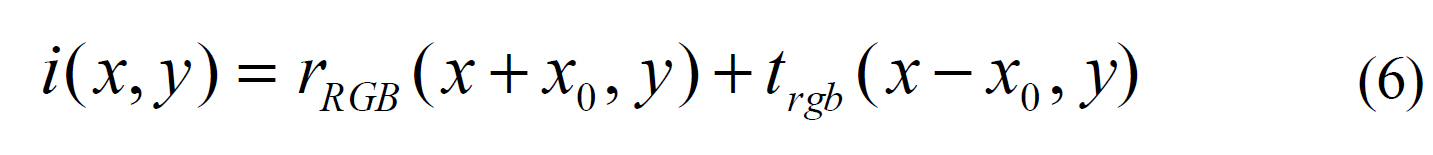
The arrangement of the multi-channel single output JTC is shown in Fig. 1. The input joint image is a monochromatic image that contains six gray-scale images. The red image(
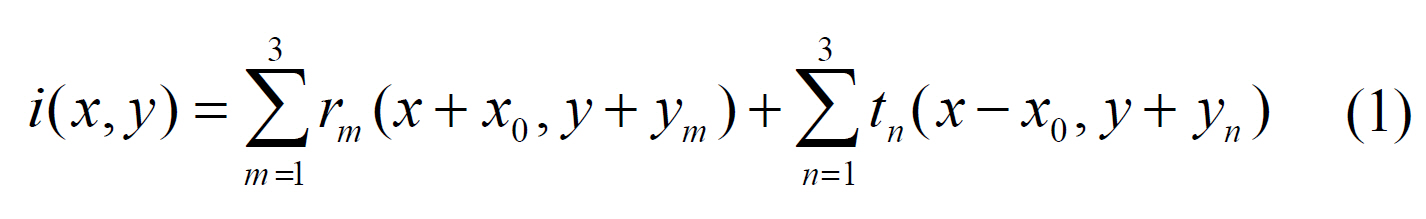
where
[FIG. 1.] Arrangement of the basic JTC for the multi-channelsingle output color pattern recognition.

of the reference image, and tn represents the three color components (
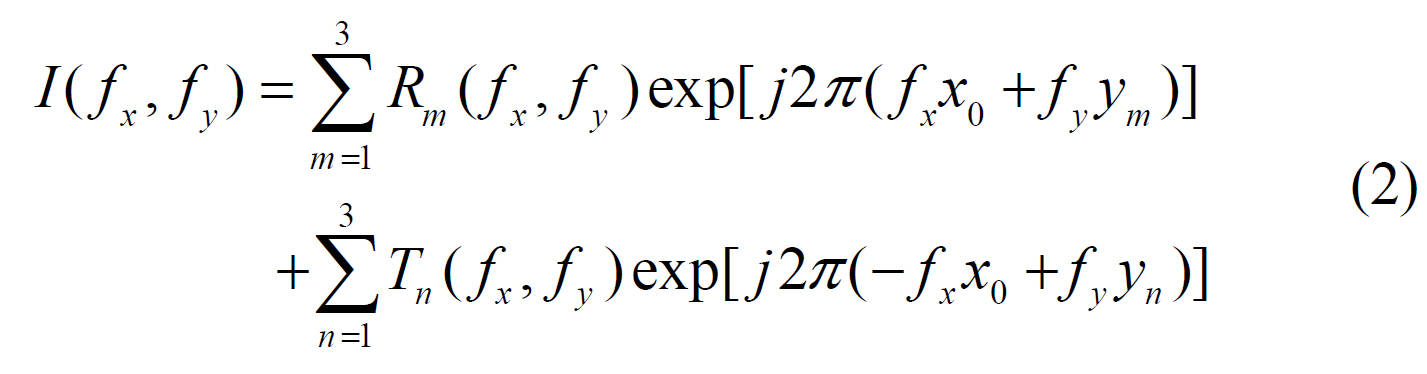
The intensity of this Fourier transformed signal forms an interference fringe pattern and it is called the joint power spectrum (JPS). JPS will be acquired with a light detector CCD on the Fourier plane. Therefore, JPS can be expressed as Eq. (3).
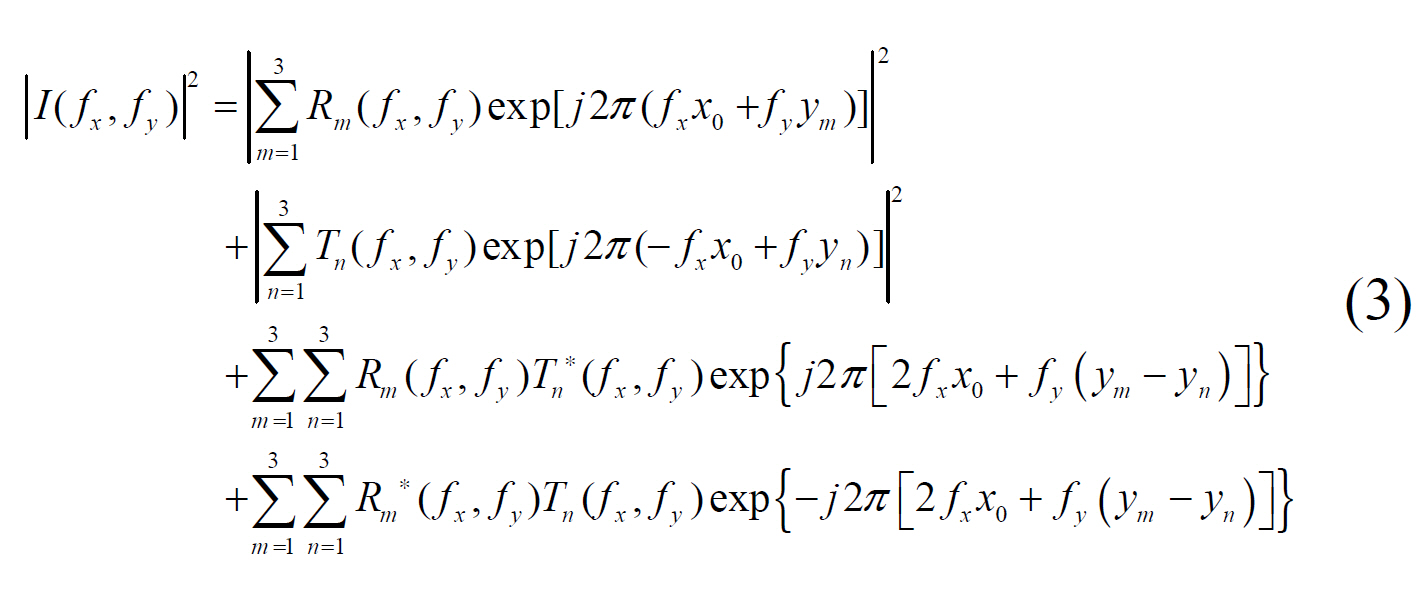
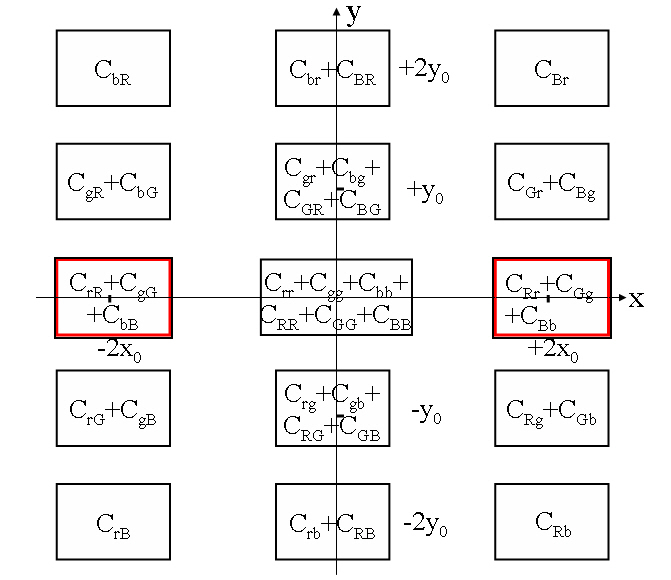
Here the symbol * denotes the complex conjugate. The cross-correlation output can be obtained by inverse Fourier transforming the JPS through the lens L2. There exist at the output plane 36 correlation terms grouped in 15 correlation locations, each location consisting of the coherent addition of a few overlapping cross-correlation terms. Figure 2 shows these 36 correlation outputs and 15 different locations. If we remove the zero order, DC components, the cross-correlation output displayed on the output plane through the inverse
Fourier transform lens L2 can be expressed as
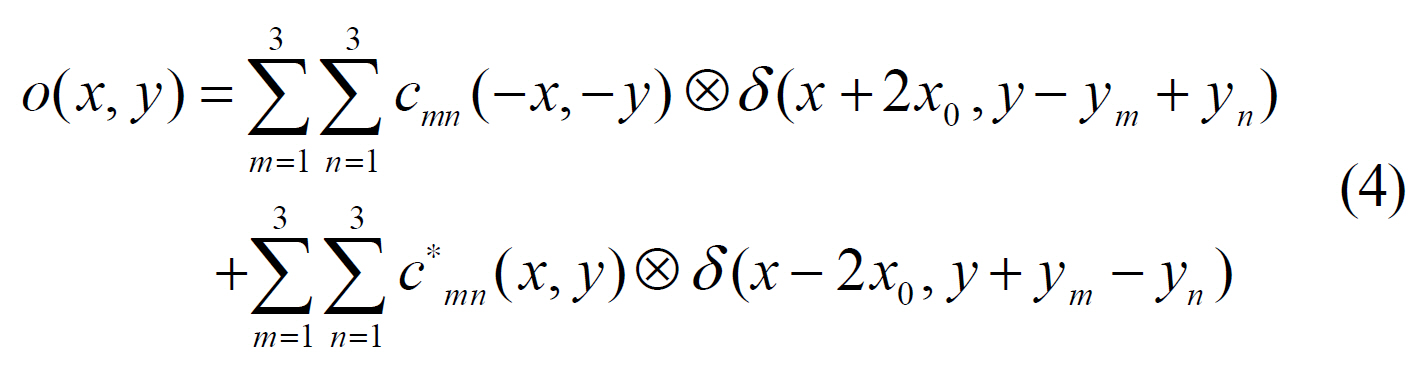
where

III. SINGLE-CHANNEL SINGLE OUTPUT JTC
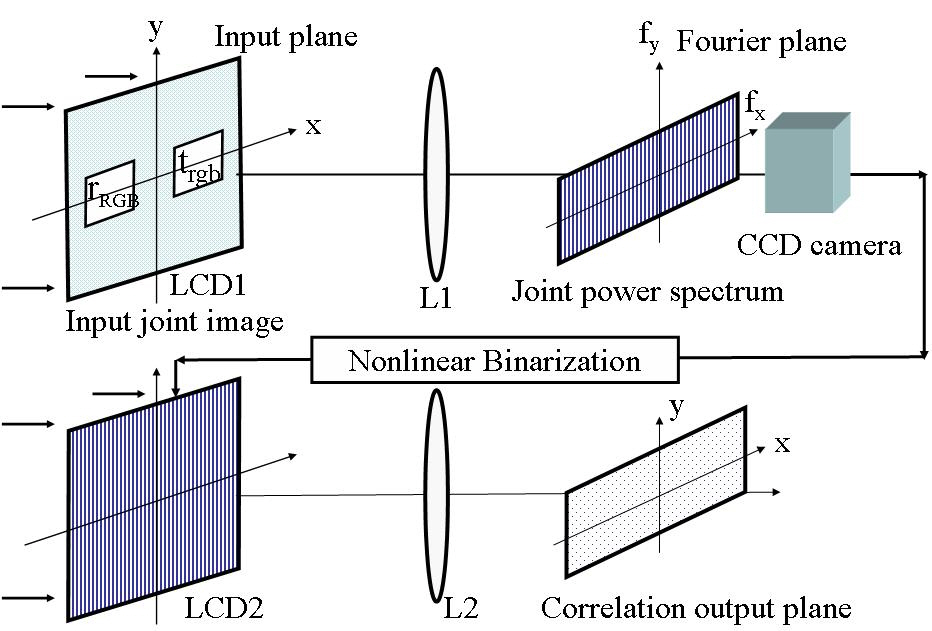
We present new single-channel single output JTC for the color pattern recognition of the color image. This method can achieve the color pattern recognition by decomposing the color image into three color components (red, green,and red) and recombining those components into a single gray image in the input plane instead of using these three color components. This new technique needs a single input channel instead of three input channels and single output CCD camera, thus a simple JTC can be used. Figure 3 shows the optical structure of the basic JTC system for the single-channel and single output color pattern recognition.Thus, the input joint images
where

Therefore, JPS, the intensity of the interfered light is captured by a light detector on the Fourier plane. The JPS contains noise and DC components which degrade the correlated signal obtained on the output plane in the second stage. The DC components should be blocked to obtain a well-correlated signal. DC components are blocked and non-linearity parameter
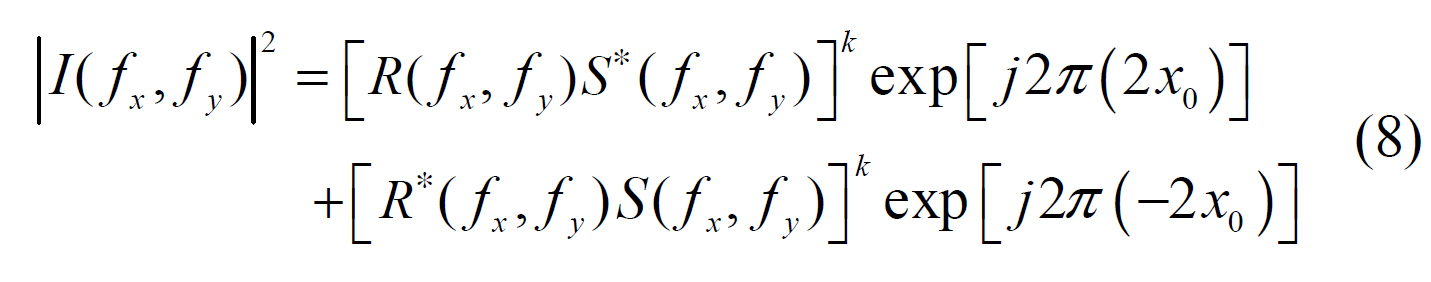
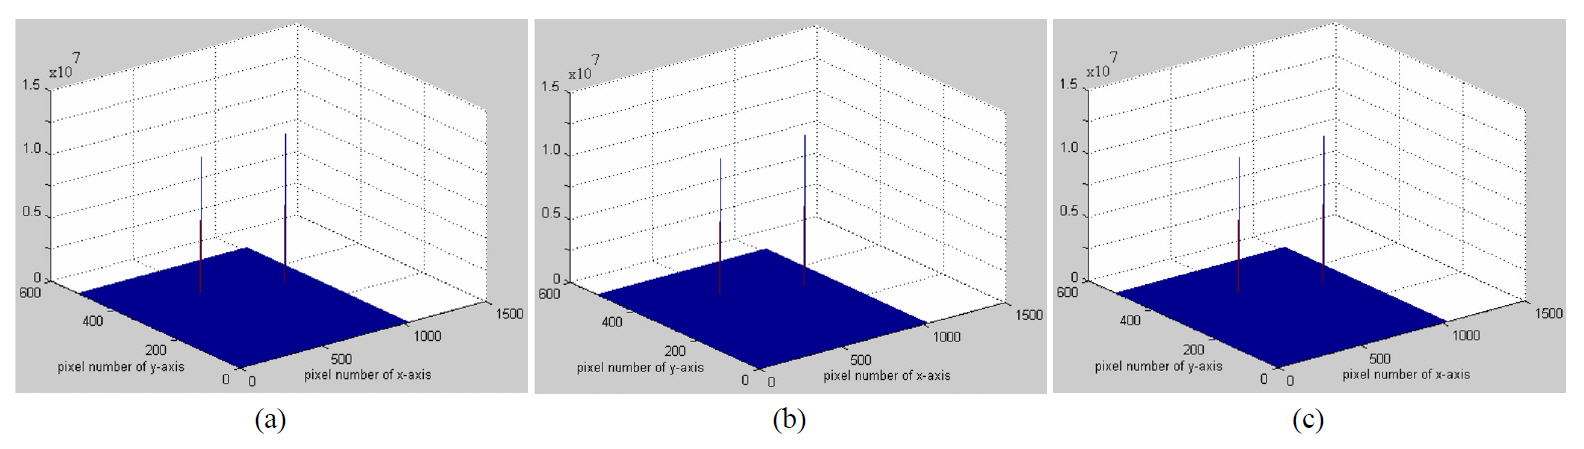
The cross-correlation output can be obtained by inverse Fourier transforming the JPS through the lens L2. The cross-correlation output displayed on the output plane through the inverse Fourier transform lens L2 can be expressed as Eq. (9).

There exist only two correlation terms at the output plane in comparison with those 36 correlation terms for the conventional three input-channel JTC showed on Fig. 2.
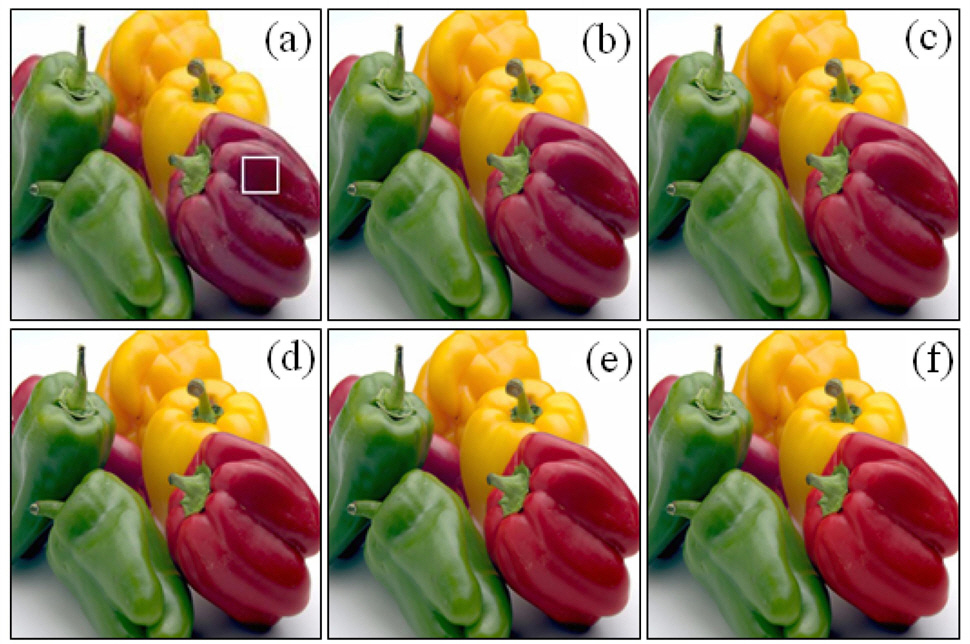
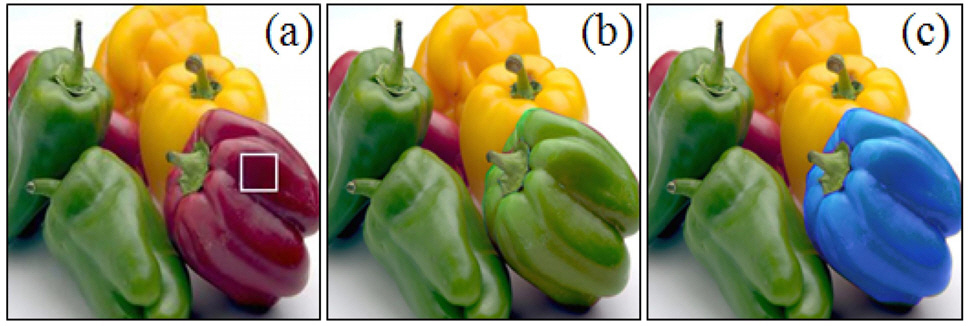
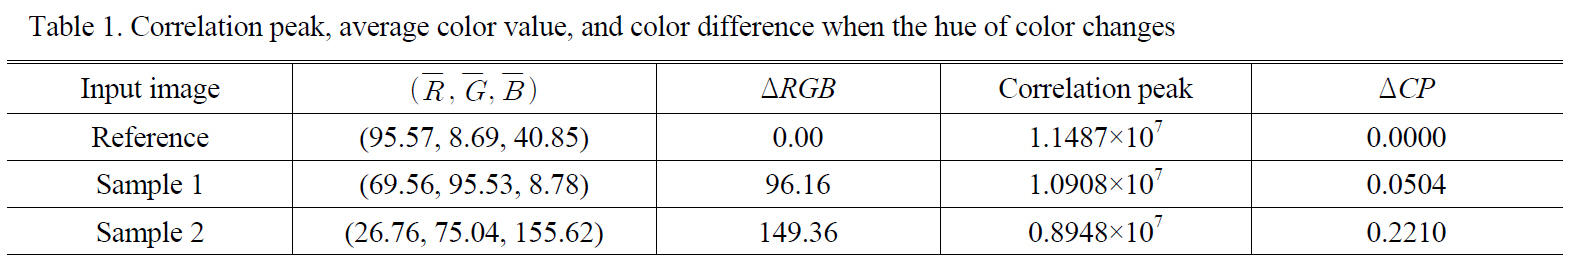
To evaluate the performance of the proposed single input channel and single output JTC for the color pattern recognition, we prepared a 256×256 color image of the fruit. We did several simulations to present detailed results concerning the performance of our new method. We grouped the color images of the fruit for the simulation of the discrimination of the color when the hue, saturation, and brightness of the color images change. First, in Fig. 4 three target images of the fruit are shown for the discrimination of the color when their hue changes. Figure 4(a) is the reference image, and sample 1 (Fig. 4(b)) and sample 2 (Fig. 4(c))are the target images which are different from the reference images in hue. The color of the pepper on the right is red for the match case, and its color was modified into green and blue for the mismatch case. The rectangle in white color indicates the 32×32 pixels for the calculation of the average color value of the three color components (R, G,and B) and the RGB color difference. The RGB color difference was calculated from the formula
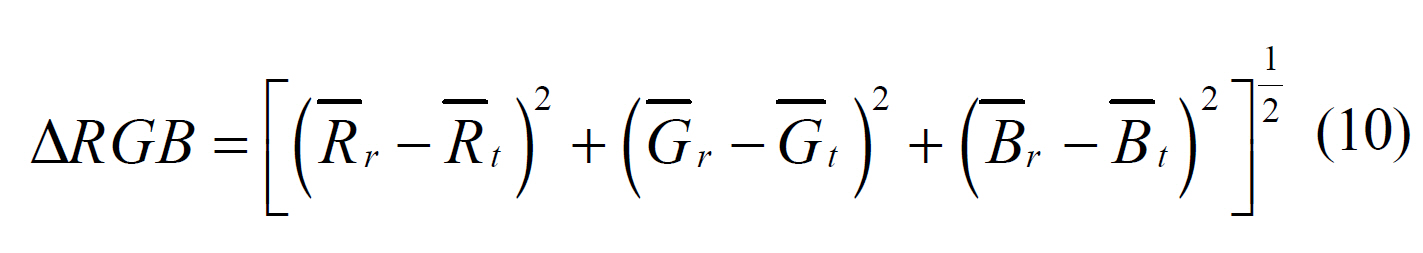
where
are the average values of the three color components R, G, and B of the reference color image respectively, and
are the average values of the
three color components R, G, and B of the target color image respectively. We introduced a correlation peak difference ratio Δ
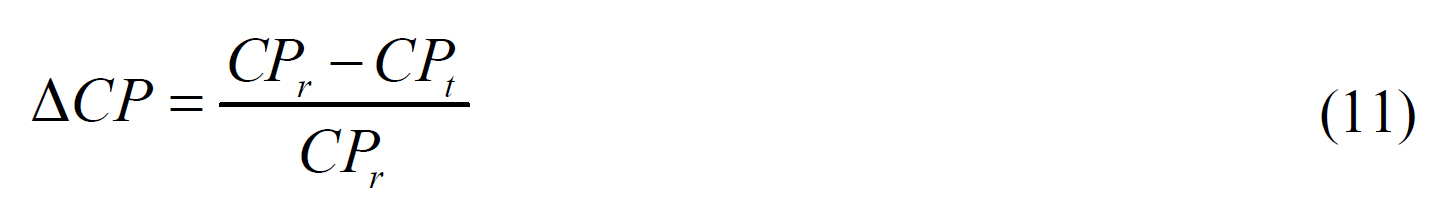
where
Correlation peak, average color value, and color difference when the saturation of color changes
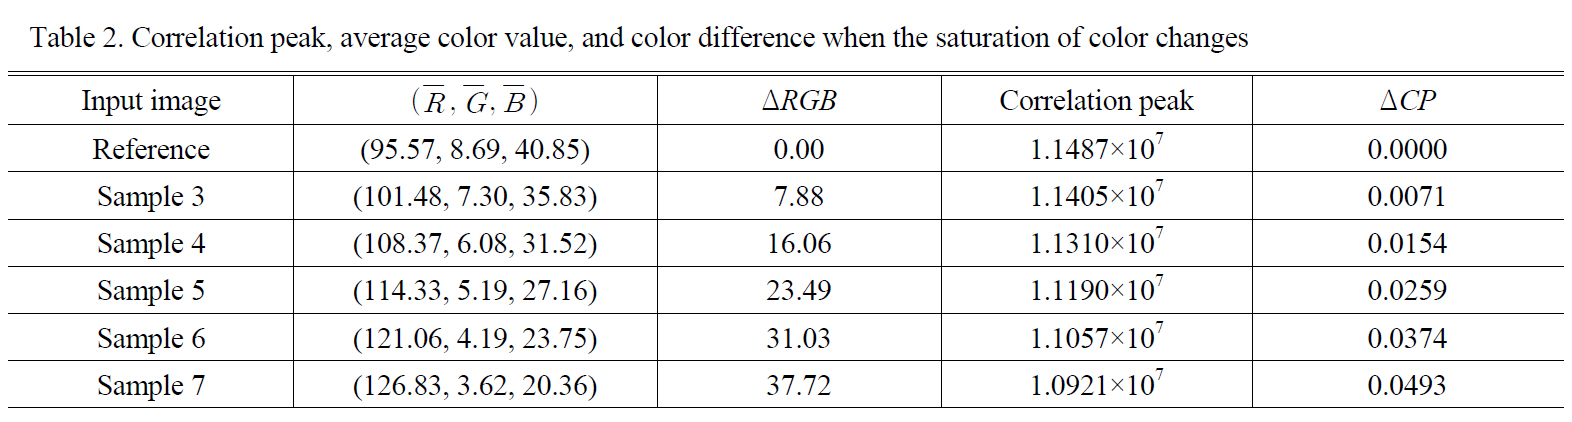
Correlation peak, average color value, and color difference when the saturation of color changes
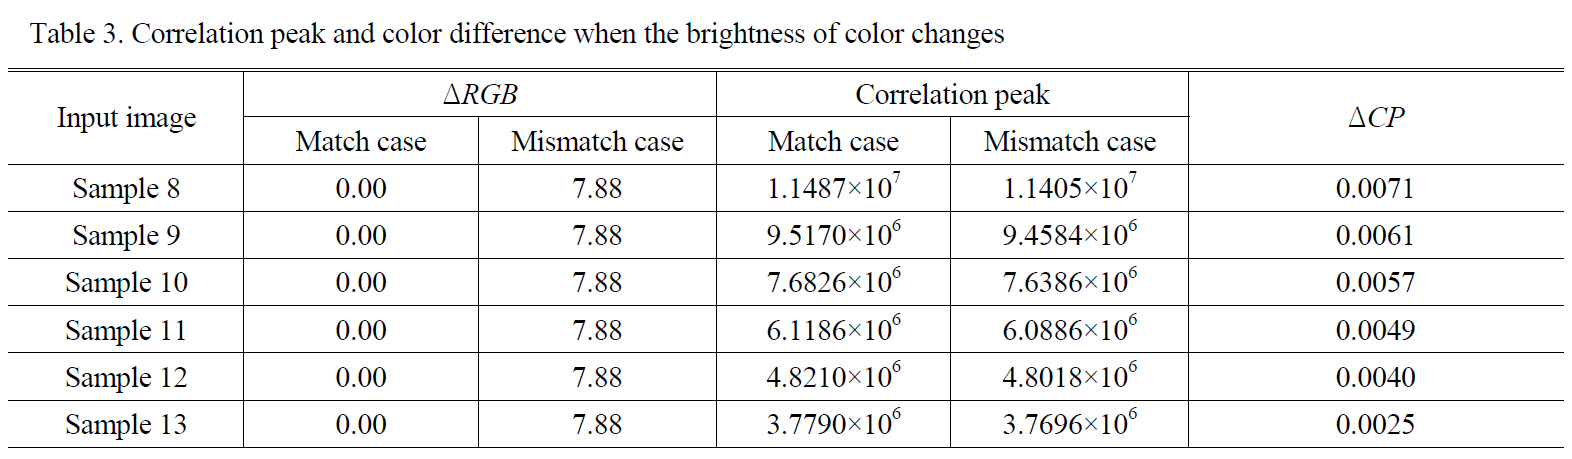
[Table 3.] Correlation peak and color difference when the brightness of color changes

Correlation peak and color difference when the brightness of color changes
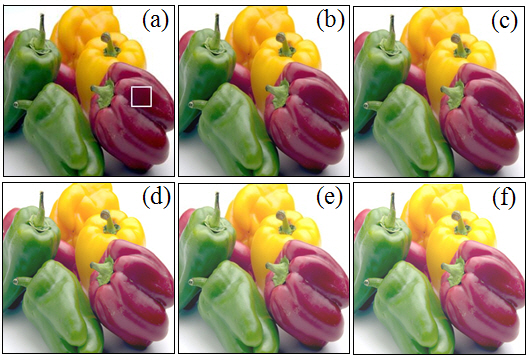
discrimination of the color images when the brightness of the input joint color images changes. In this paper, we propose the single input channel technique, and the input joint images consist of reference and target gray images.In other word, the three color values of the color image are converted into the brightness of each color. Thus, we want to know if when the brightness of the color images goes high, the discrimination of the color images fails. The color image shown on Fig. 6(a) is the same as the reference image (reference image in Table 1 and 2). We increased the brightness of the color images of Fig. 6(a) to a considerable level as shown on Fig. 6 from (b) to (f).These 6 images will be used as the reference images for each brightness level. Also, we prepared another 6 target images obtained by increasing the brightness of the target image (sample 3 in Table 2) shown on Fig. 5(b). Table 3 represents the correlation peaks, correlation peak difference ratio, and color difference of the color images according to each brightness level. In Table 3, the match case represents the case when the reference image is also used as a target image, and the mismatch case represents the case when the images obtained from sample 3 are used as target images for each brightness level. Again, 32×32 pixels of the images were selected for the calculation of the color difference. Table 3 indicates that the discrimination shows successful results according to a various brightness level.In addition, as we expect, Table 3 indicates that the color difference is almost the same in spite of the change of the brightness of the input joint color images. However, Δ
We proposed a new technique of color pattern recognition by decomposing the input color image into three color components (red, green, and red) and recombining those components into a single gray image in the input plane.Conventional color JTC needs three input channels, thus 36 correlation outputs appears at 15 different locations.However, our new single input channel JTC has only 2 correlation outputs, thus a simple JTC can be used. We presented various kinds of simulated results concerning the variation of the correlation peaks according to the hue,saturation, and brightness of the color images. Simulated results showed that the proposed technique can successfully achieve the color pattern recognition in wide dynamic range of color images.