A regular alternation of independent generations occurs in the life histories of many algal species, including the Rhodophyta. Stebbins and Hill (1980) proposed that maintenance of a haploid-diploid life history is an adaptation to seasonally variable environments and that diploidy is more adaptable than haploidy. This implies that in populations with distinct, alternate haploid and diploid generations, the trend is towards diploid dominance, with other life history patterns evolving (e.g., Dixon 1965);indeed, there are many species in which sporophytes are apparently the dominant generation. Valero et al. (1992)pointed out that it is difficult to rationalize the maintenance of a haploid-diploid life history when the ecological niches of the two generations are similar, particularly where the two life-history stages are isomorphic. In such instances, the life-history phases are ecologically inde-pendent and, especially if the two generations are perennial, they will be ecologically competitive, each generation obtaining its resources in a similar manner. In such intraspecific competitive situations, it can be queried whether one generation can become predominant in a population and whether this is predictable. May (1986) argued that if the two generations are demographically comparable, over time, the proportion of gametophytes and sporophytes should eventually reach equivalency because of stochastic events. However, if the two generations are not equivalent, one of the generations will predominate according to May’s mechanistic hypothesis.
In those species where one life-history generation dominates in a population, does this extend to all populations of the species? Reasons for dominance would therefore be inherent rather than the result of unique circumstances. This question has been addressed a number of times with respect to the Gigartinaceae, resulting in ambiguous conclusions. Gametophytic and / or sporophytic dominance have been reported, both for species of Mazzaella (as Iridaea) and Chondrus (e.g., Mathieson and Burns 1975, Hansen and Doyle 1976, Craigie and Pringle 1978, Bhattacharya 1985, Dyck et al. 1985, Hannach and Santelices 1985, May 1986, Luxoro and Santelices 1989, De Wreede and Green 1990, Fernandez and Menendez 1991, Piriz 1996), whereas Lazo et al. (1989) noted a similar proportion of gametophytes and sporophytes in populations in their study of Chondrus crispus Stackh.
Chondrus crispus (Irish moss) is the sole species of its genus present along shores of the Atlantic Ocean, where it is widely distributed and abundant throughout northern temperate waters, especially in Maritime Canada (McLachlan et al. 1987, McLachlan 1991, Taylor and Chen 1994). In some areas, C. crispus occurs essentially as ‘monospecific’ stands, dominating space in the lower littoral and upper sublittoral zones, in sufficient abundance to be harvested commercially. This species has been the most valuable commercial seaweed in Canada.
C. crispus has a “Polysiphonia-type,” life history with independent, isomorphic tetrasporophytic and gametophytic generations (Chen and McLachlan 1972, McLachlan et al. 1989, Taylor and Chen 1994). The two generations co-exist in populations as perennial plants (e.g., Chen and Taylor 1980, Bhattacharya 1985, Scrosati et al. 1994) with reproduction through both diploid and haploid spores (Taylor and Chen 1994).
The individual plant, or genet, of C. crispus consists of a basal holdfast that bears numerous dichotomously-branched, flattened fronds, or ramets, in various stages of morphological development (McLachlan et al. 1989, 52McLachlan 1991). The turnover rate for fronds is relatively high (Bhattacharya 1985), and largely relates to size, although individual fronds may persist for several years, depending upon physical conditions (Taylor et al. 1981). There is no evidence of seasonality of fronds as may occur in other gigartinacean species (cf. May 1986, De Wreede and Green 1990). Perennation occurs through the basal holdfast, which can persist for indefinite periods (Taylor et al. 1981). Once detached, holdfasts will not reattach, and detached fronds will not generate holdfasts. Growth of plants occurs through expansion of the holdfast with a continuous production of new fronds (McLachlan et al. 1989), whereas recruitment into new space occurs through spore reproduction. The frequency of reproductive fronds within a population has been reported to be relatively low (Prince and Kingsbury 1973, Chen and Taylor 1980, Lazo et al. 1989, McLachlan et al. 1989, Taylor and Chen 1994).
Species with isomorphic alternate generations, such as C. crispus, should be ideally suited to study intraspecific competition. Species of Gigartinaceae are particularly useful in this regard as sporophytic and gametophytic phases have different carrageenans, lambda type and kappa type, respectively (McCandless 1981), which can be distinguished by a simple, rapid colorimetric test involving resorcinol. Accordingly, the life history phase of fronds can be identified in their vegetative state, allowing large numbers of samples to be assessed easily and quickly (Craigie and Pringle 1978, Dyck et al. 1985, Lazo et al. 1989, De Wreede and Green 1990).
In a previous investigation of C. crispus in the southeastern Gulf of St. Lawrence along the coast of Prince Edward Island, where Irish moss is a commercial resource (McLachlan et al. 1987), the gametophytic / (tetra)sporophytic (G/S) ratio of the overall population was found to be essentially 1 : 1. Lazo et al. (1989) concluded that this ratio resulted from stochastic events in an area where the substratum was unstable, and that maintenance of the population occurred largely through spore reproduction. These conclusions support May’s (1986) stochastic hypothesis.
Irish moss is also harvested commercially along the Atlantic coast of Nova Scotia where there is a stable, hard-rock substratum (Roland 1982). Extracts of the commercial harvest from this area have consistently contained high proportions of the kappa-type carrageenan, characteristic of gametophytic generation. In contrast, extracts from Prince Edward Island resources have shown proportionally less of the kappa-type carrageenan (Ffrench 1970). Samples from a single site on Atlantic Nova Scotia confirmed an overwhelming proportion of gametophytes year-round in that population (Bhattacharya 1985). Such information suggests that the two phases of C. crispus in this area are not demographically equivalent.
We presently extended previous studies from Prince Edward Island and analyzed populations of C. crispus, both at commercial and non-commercial sites, over an extensive length of coastline along the Gulf of Maine and Atlantic shores of Nova Scotia to see if this gametophytic dominance extends to all populations. These studies have resulted in the development of two models for C. crispus populations in Maritime Canada: 1) populations with an equivalency of life history phases resulting from stochastic events, and 2) populations with a predominance of gametophytes resulting from mechanistic factors.
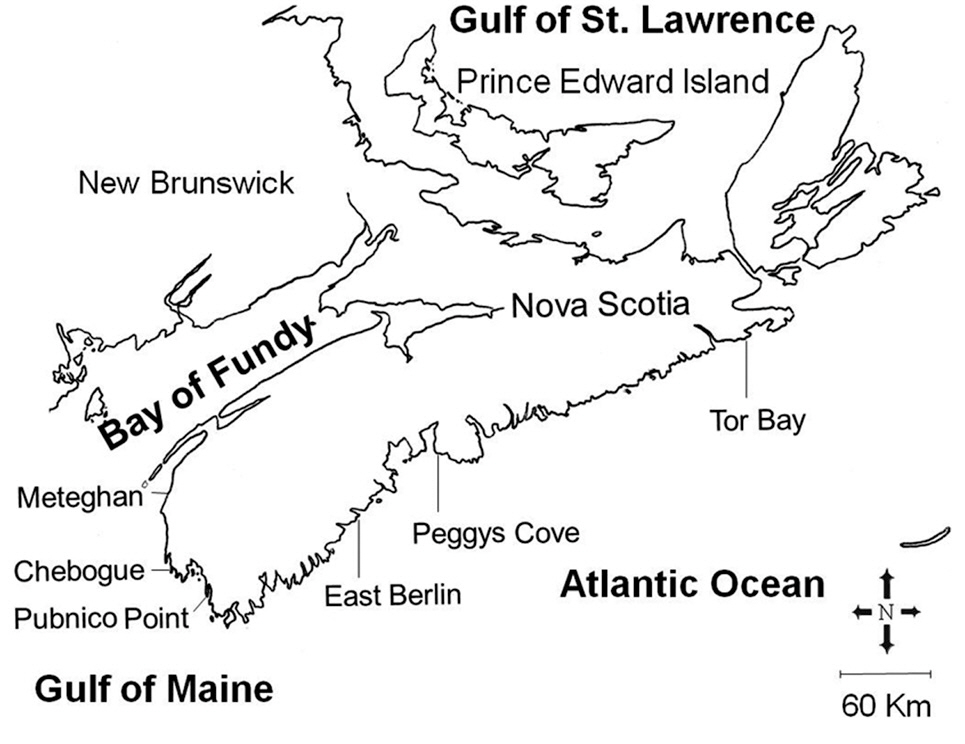
Our study area included the Atlantic coast of Nova Scotia from the eastern end of the mainland peninsula, and the approaches to the Bay of Fundy, a distance of about 500 km (Fig. 1). Three sites were selected within each of the two hydrographic regions, and were sampled between May and August, 1988. These sites ranged from fully exposed ones, such as Peggys Cove, to moderately exposed areas protected by off-shore islands, including Pubnico Point. Irish moss has been harvested by hand raking for many years at both Pubnico Point and Chebogue Point, while the other sites have not been harvested. The tidal amplitude along the entire Atlantic coast of the province is about 2 m, increasing within the Bay of
Fundy approaches to about 3.5 m at Pubnico and 5.5 m at Meteghan. The substratum is stable, consisting of shale, slate or granite (Roland 1982).
Two adjacent zones within the intertidal area, the mid-littoral fucoid-zone and the lower “Chondrus-zone,” were sampled at each site. Collections were made around the time of low-water spring tides. C. crispus was the predominant fleshy alga of the lower zone at all sites. In the higher zone, C. crispus occurred interspersed among and beneath the dominant fucoids, Ascophyllum nodosum (L.) LeJol. at semi-exposed sites and Fucus vesiculosus L. at exposed sites.
A 30 m transect line, marked in 0.5 m intervals, was laid parallel to the shore in both the upper and lower zones at each study site in areas with good stands of C. crispus. Quadrats of 0.1 × 0.1 m (0.01 m2) were randomly positioned at 15 points on the line. Fronds of C. crispus within individual quadrats were scraped from the substratum with a sharpened putty knife and collected into previously labeled polyethylene bags. The samples were maintained on ice until processed.
Fronds of C. crispus were separated from other macroalgae, and epiphytes were carefully removed from the fronds. Cleaned fronds were rinsed briefly under running tap water, thoroughly blotted and weighed. The large number of fronds that was usually present in Chondrus-zone quadrats necessitated subsampling; this was also required for some fucoid-zone quadrats. All fronds from an individual quadrat were shaken in a rounded plastic container divided into six equal sectors, and fronds that fell within randomly-chosen sectors were analyzed. If further subsampling was required, the procedure was repeated.
Each frond of the final sample was weighed (minimum weight, 0.005 g), and the number of dichotomies was recorded. The frond was scored as vegetative, female gametophytic or tetrasporophytic based on visual assessment. A careful examination of numerous fronds in occasional samples revealed extremely low frequencies of male fronds, which were scored as vegetative. Smaller fronds and portions, about 0.005 g wet weight (w-wt), of larger fronds were individually tested by the resorcinol reagent to ascertain the life-history phase of the frond (Yaphe and Arsenault 1965, Lazo et al. 1989). Care was taken not to include reproductive structures with segments of fronds to avoid influencing the outcome of the test.
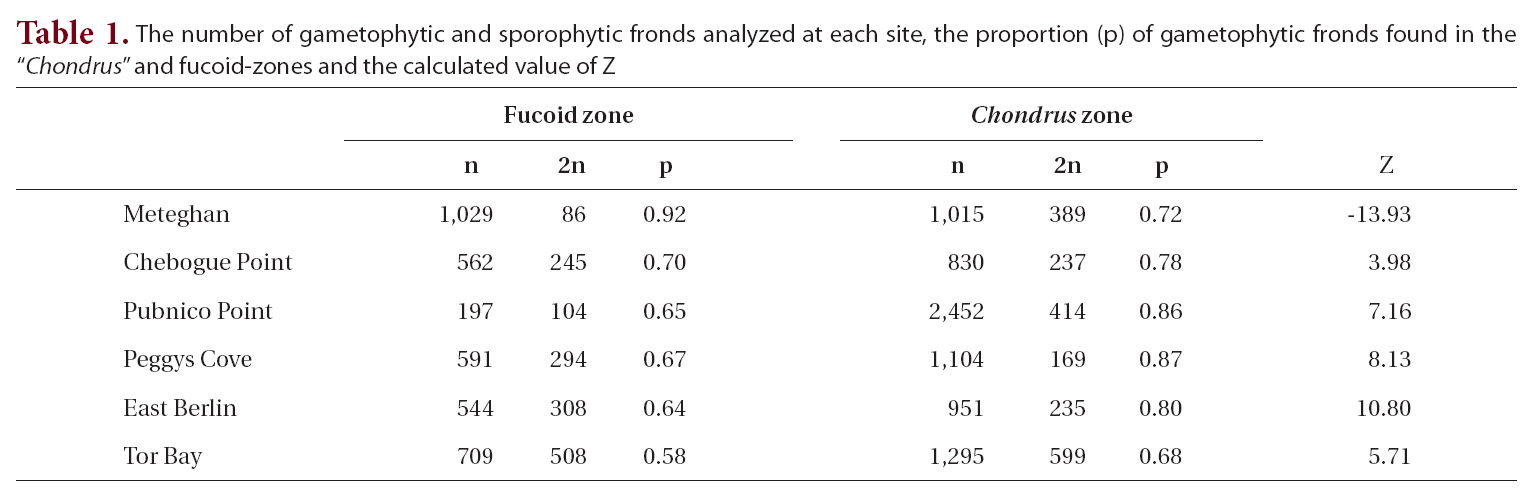
The proportion of gametophytic fronds was calculated both for the fucoid- and Chondrus-zones and for the two zones combined. A Z-test was used to determine if there was a significant difference between the proportion of gametophytic fronds in each of the zones.
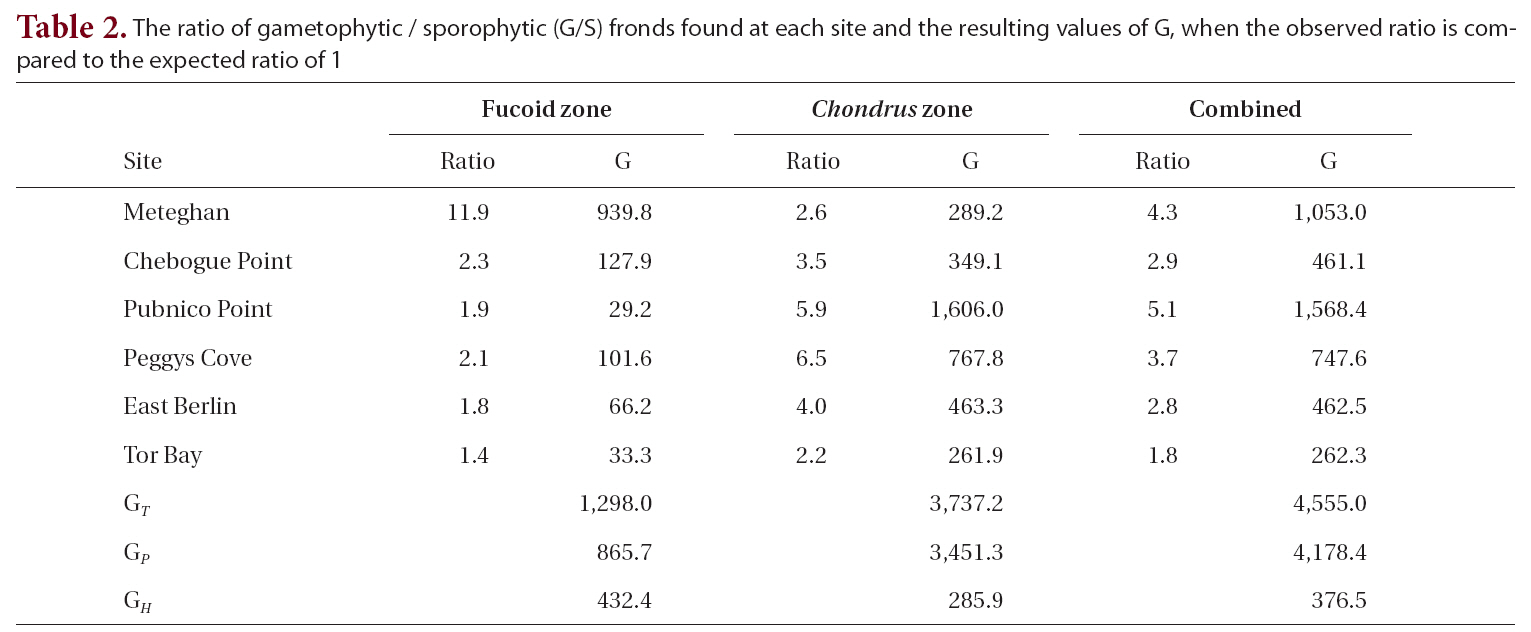
The observed G/S ratio for each site, for the two zones within a site and for the combined zones at each site was compared to a hypothesized ratio of 1 using a replicated Goodness of Fit Test. The additive nature of the G statistic allows an overall analysis of the data treating each site as a replicate in an interaction or heterogeneity G-test (Sokal and Rohlf 1995). The total G (GT ), is the sum of the G statistics for each site and is a measure of how well the data as a whole fit the hypothesis. The degree of heterogeneity among sites (GH ), was calculated similar to the interaction equation in a two-way ANOVA. The goodness of fit for the pooled data (GP), obtained by subtracting GH from GT, treats the six sites as replicates of a single population. A significant degree of heterogeneity permits the a posteriori test of sets of replicates by a simultaneous test procedure (STP) to determine whether all sites were different from one another or if there were homogeneous groups of sites.
Fronds were grouped into 0.02 g w-wt size classes and the percentage of gametophytic fronds in each size class was plotted. C. crispus fronds occurred in a size hierarchy with large numbers of small fronds and very few large fronds. For ease of illustration, fronds larger than 0.2 g were assigned to a single group as there were very few or none of these in individual 0.02 g classes. The percentage of total fronds assigned to each size class was also calculated.
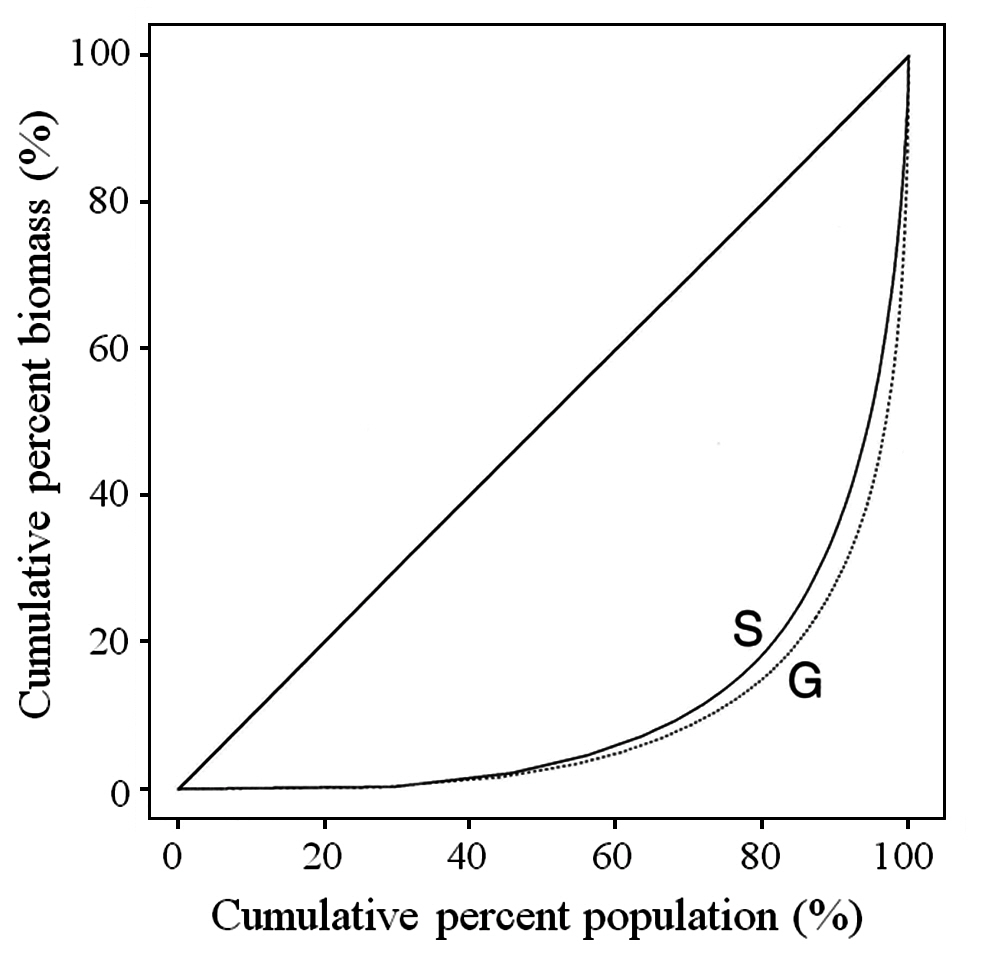
The Gini coefficient is used as a measure of size inequality within a population. The basis for the calculation is the Lorenz curve, which plots the cumulative percent biomass versus the cumulative percent of population. A straight diagonal line represents perfect equality in a population. The Gini coefficient is calculated as the ratio of the area between the diagonal and the Lorenz curve, and the total area under the diagonal (Weiner and Solbrig 1984). The larger the Gini coefficient, the more the size distribution is skewed towards having large numbers of small fronds and small numbers of large fronds.
It was of interest to determine whether the Gini coefficient varied between sites, zones or life history phase. As the usual assumption of normality required for analysis of variance seemed rather questionable for the Gini coefficient, it was decided to do the analysis using the bootstrap methodology (Efron and Tibshirani 1993). The observations at a particular site, zone and phase were sampled with replacement to obtain a bootstrap sample. The Gini coefficient was calculated for this new sample. This procedure was repeated 500 times to give a bootstrap distribution of the Gini coefficient for each factor. The variance of the Gini coefficient is calculated from the bootstrap distribution and this was used to run a weighted analysis of variance with three factors: site, zone and frond type. The weighted analysis of variance was run for each of the 500 bootstrap samples and this produced a bootstrap distribution for each of the factors and interactions in the model. The p-value for each of the factors is computed by finding the proportion of the bootstrap samples that produce more extreme values of the F-statistic for that factor than for the original sample.
The total number of fronds analyzed for each site, together with the proportion of gametophytic fronds, both in the fucoid- and Chondrus-zones, and the calculated Z values are given in Table 1. Frequency of reproductive fronds was <5% at Tor Bay and Chebogue Point, <1% at Peggys Cove and East Berlin, while at Meteghan and Pubnico Point reproductive fronds were not noted in the samples.
Within both sampling zones at all sites, the proportion of gametophytic fronds exceeded that of sporophytic ones (Table 1). In the fucoid-zone this ranged from a high of 92% to a low of 58%, with the percentages for five of the sites being around 65%. The highest percentage of gametophytic fronds occurred at Meteghan, a site that had been heavily ice-scoured two years prior to our sampling. Within the Chondrus-zone, the frequency of gametophytic fronds ranged from 68-87%. Apart from Meteghan, where the proportion of gametophytic fronds in the fucoid zone exceeded that in the lower zone, frequencies of gametophytes were higher in the Chondrus-zone, the differences being highly significant (p < 0.001).
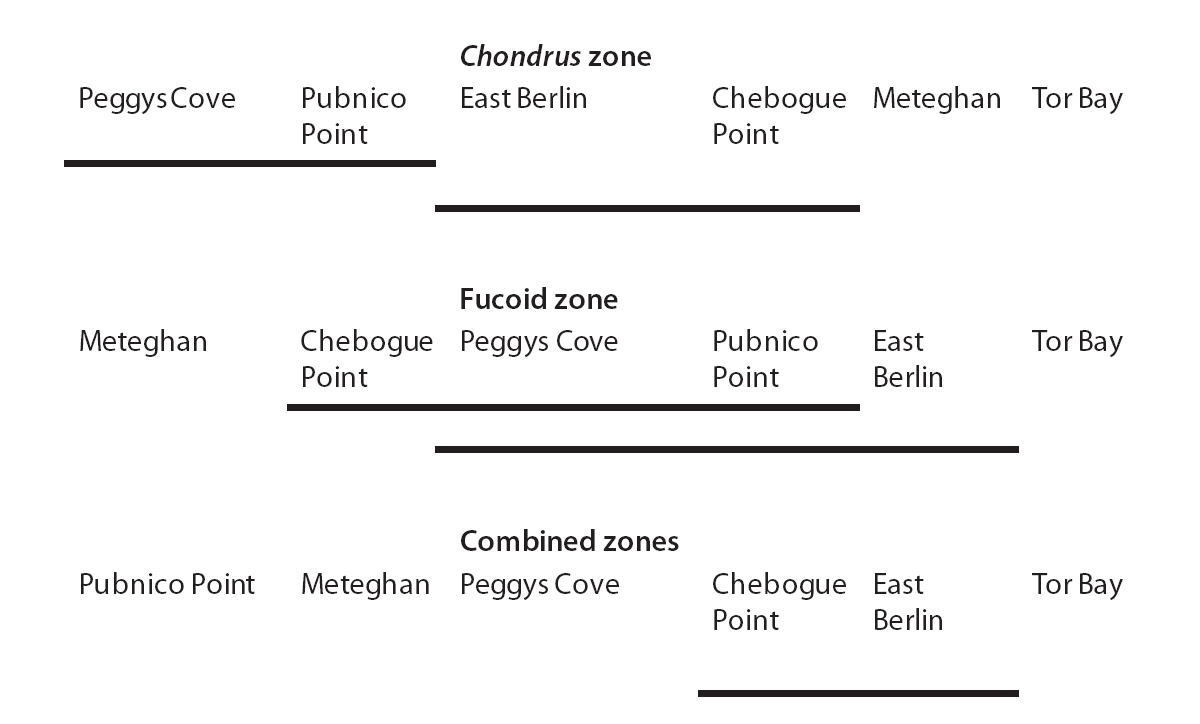
The G/S ratios for each zone and for both zones combined are displayed in Table 2, along with the calculated G statistic. The G values were very high in all instances, showing that the G/S ratios differed significantly (p < 0.001) from the null hypothesis. The overall G/S ratio in the Chondrus and fucoid zones was 3.7 : 1 and 2.3 : 1, respectively, and for the entire population studied was 3.1 : 1, which represented significant departures from the hypothetical ratio of 1 : 1. Although the trend was towards disproportionate frequencies of gametophytes, the six sites were dissimilar in magnitude. The test for homogeneity among replicates revealed that both for the fucoid- and Chondrus-zones, two different groups of homogeneous sites were identifiable and, when the zones are combined, similar ratios were limited to Chebogue Point and East Berlin (Fig. 2).
Typical of most plant populations, C. crispus has a hierarchy with many small fronds and few large fronds. As noted earlier, the inequality of the population can be shown using the Lorenz curve and the Gini coefficient. The Lorenz curve for the overall data is shown in Fig. 3 both for tetrasporophytes (S) and gametophytes (G). The Gini coefficients for tetrasporophytes and gametophytes, 0.78 and 0.82, respectively, were not significantly different (p = 0.564). The p-values resulting from the bootstrap analysis of the three main factors ? site, zone and phase ? and for all interactions between factors, were large, indicating that the Gini coefficient was not affected by any of the factors considered in the analysis, or by any of the interactions among the factors.
A very high frequency of small fronds with few dichotomies was observed in samples from Meteghan and Chebogue Point, sites which are harvested by raking. Meteghan, as mentioned, had also been recently ice-scoured. In these samples, fronds ranged up to 3.1 g w-wt, but only 1.5-12% of all fronds were more than 0.2 g w-wt. In samples from the Atlantic-shore sites (i.e., East Berlin, Peggys Cove and Tor Bay) fronds ranged up to 38.63 g w-wt and 21-33% exceeded 0.2 g w-wt.
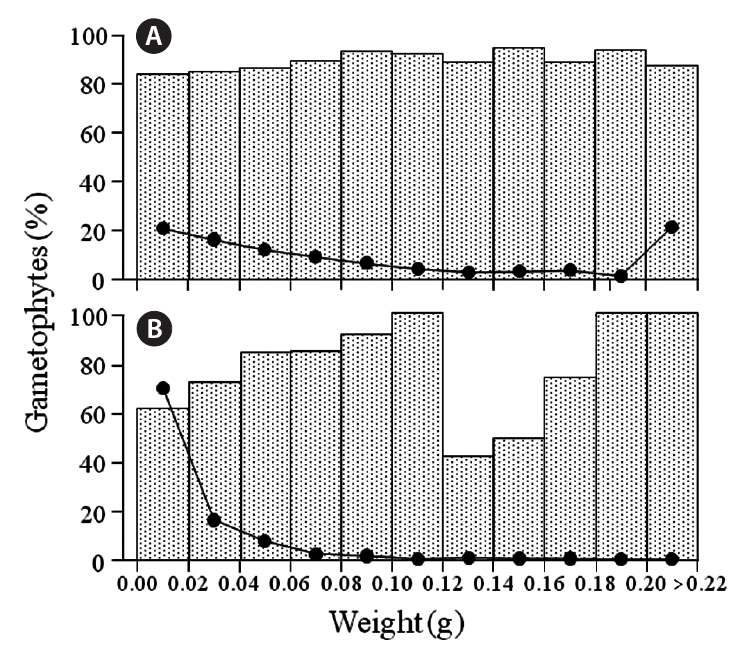
Gametophytic fronds from the Chondrus zone dominated almost all size classes at the six sites, and the frequencies of life-history phases were about the same for most classes (cf. Fig. 4); exceptions were in the 0.16-0.18 g class at Chebogue Point and the 0.14-0.16 g class at Meteghan, although these results may not be statistically
significant because of low numbers. Similarly, gametophytic fronds were generally predominant throughout the size classes in the fucoid-zones, but there was greater variation in their frequency, from a minimum of 36% at Tor Bay to 100% in many classes. The percentages of gametophytic fronds rarely fell below 50% in any of the classes and, because of small sample sizes, these incon-
sistencies, may also be non-significant. The exception was at Meteghan, where the percentage of gametophytic fronds was consistently high. The class-distribution of fronds at Peggys Cove, both in the fucoid- and Chondrus-zones, is shown in Fig. 4. Data for the other sites are not presented as the results are similar to those for Peggys Cove.
A stable substratum was typical of all sites in the study area, although these varied widely in wave exposure. Predominance of gametophytic fronds of C. crispus was typical of these shores, and the G/S ratio was significantly different from 1 at all sites. This observation is consistent with the recent surveys of Garbary et al. (2011), and the more localized sampling of Scrosati et al. (1994) and Scrosati and Mudge (2004). Collectively, these data point to long-term stability of the population, where a regular alternation of generations of C. crispus must be relatively minor and maintenance of the population occurs largely through expansion of established basal holdfasts and regeneration of new fronds. There are no supporting data or circumstantial evidence to suggest that spore reproduction is a major factor in maintaining these populations of C. crispus. Even where populations may have been badly damaged by biological vectors (Scheibling 1986) or physical forces (Minchinton et al. 1997), recovery through regeneration of basal holdfasts occurs relatively quickly. Scrosati and DeWreede (1999) derived a model based on a very simple life history, which predicts that in populations of Gigartinaceae the G/S ratio would stabilize around 2.83 with variations in nature due to environmental and physiological factors. Our observation of an overall G/S ratio of 3.1 in a stable population supports their conclusion.
Dominance of gametophytic fronds was common to all sites; although the G/S ratios differed among sites in both zones, homogeneous groups of sites could be extracted (Fig. 2). Such observations are not surprising, given the long distances involved plus considerable variation in other factors such as exposure, tidal amplitude, declivity of the shore, structure of the substrata and so forth, which may affect the ratio. The two most widely separated sites, Tor Bay and Meteghan, stood apart from the others on the basis of their respective G/S ratios, whereas Pubnico Point, which has been harvested annually, and Peggys Cove, an area that has not been exploited commercially, grouped together. There are no obvious reasons for the homogeneity or heterogeneity of sites, and congruency among widely separated sites may be an exception. Nevertheless, the general predominance of the gametophytic life-history phase suggests that mechanistic factors are the major reasons for the structure of the population.
We had assumed previously that when space was not a limiting factor, the distribution of gametophytes and sporophytes would be the result of stochastic events (McLachlan et al. 1988, Lazo et al. 1989, McLachlan 1991), and that there would be an equivalency of life-history generations. Thus, the predominance of gametophytic C. crispus in the fucoid-zones at all our study sites was not anticipated. Free space in this zone is available among the fucoids, which generally form a complete canopy. At five of the study sites, gametophytic predominance in the fucoid-zone was less than in the Chondrus-zone, the Meteghan site being an exception. There was, however, at least 40% more gametophytic fronds than sporophytic ones at all sites and the overall ratio was significant, at 2.3 : 1. The decrease in gametophytic dominance was greatest at Tor Bay, where the ratio was 1.4 : 1. The physical sweeping action of the fucoid fronds or the fucoid canopy may have had a selective effect on the life-history generations. This does not, however, seem particularly plausible as, for example, the G/S ratios at Peggys Cove and Pubnico Point were similar, yet the predominant fucoid was Fucus vesiculosus at the former site and Ascophyllum nodosum at the latter. With their different thallus architecture, these brown algae might be expected to have a different effect on the understory C. crispus. At Meteghan, severe ice abrasion had removed both larger C. crispus fronds as well as most of the fucoid canopy the winter previous to sampling. The unusually high proportion of gametophytic fronds in the fucoid zone may have occurred as a result of fronds regenerating rapidly from existing holdfasts.
Frequencies of gametophytic fronds remained generally consistent throughout the size classes of a population, suggesting that gametophytic thalli (genets) predominated throughout the population rather than an abundance of smaller gametophytic fronds and fewer larger sporophytic ones (cf. McLachlan et al. 1989). Furthermore, because fronds of both generations occurred throughout the year with no apparent seasonality of either generation (Bhattacharya 1985, Taylor and Chen 1994), sampling during a single season, as we did, should not have biased the results, as might be expected from the study of DeWreede and Green (1990) on another gigartinacean alga Mazzaella (as Iridaea). Further investigations (Shaughnessy et al. 1996) on factors determining the habitat of Mazzaella splendens and M. linearis noted that sporophytes of M. linearis dominated in the winter, contrary to the prediction of a model. Although the model of Shaughnessy et al. (1996) held true for M. splendens, it is evident that hypotheses to explain dominance of one life history generation in populations of Gigartinaceae are not generally applicable or conclusive.
McLachlan et al. (1988, 1989) showed that gametophytes and sporophytes of C. crispus are equivalent in continuboth sizes of plants and reproductive fronds. We have confirmed previous results (Lazo 1987, McLachlan et al. 1988, Lazo et al. 1989) documenting high percentages of small fronds and very few large ones in Nova Scotian populations. The overall Gini coefficient for this population is 0.82, illustrating a large size hierarchy present in the population, or a large proportion of small fronds along with a small number of large fronds. The size distribution of the fronds as measured by the Gini coefficient does not vary across site or zone or by type of frond. This size hierarchy is common to both sporophytes and gametophytes.
Seasonality of reproduction (Taylor and Chen 1994) may be the major reason for the low frequency of fertile fronds in our samples, as collections were limited to a 4-month period with same-day sampling at each site. In C. crispus, expression of reproductive structures correlates with frond size (Lazo et al. 1989, Lazo and McLachlan 1989) and, as there were relatively few large fronds, low frequencies of reproductive fronds would be predicted. It has also been noted that occurrences of larger reproductive fronds of individual plants correlate with an apparent lack of reproduction by smaller fronds. Thus, only one or two fronds of individual thalli are simultaneously reproductive (McLachlan et al. 1989), even though other fronds may be of sufficient size for reproduction (Lazo and McLachlan 1989). This indicates suppression of reproductive expression, and reproductive frequency should be based on thalli rather than individual fronds, in which case the incidence of reproduction would be considerably higher.
The two hypotheses ? stochastic and mechanistic ? put forth by May (1986) are of particular relevance in attempting to account for distributions of life-history generations in the present instance, and are not mutually exclusive. In an earlier study from the lower Gulf of St. Lawrence (Lazo et al. 1989), the equivalency of life-history generations reported for C. crispus was attributed to the dynamic nature of the population. There was a relatively rapid turnover of genets owing to the unstable substratum, and maintenance of the population was proposed to be largely through spore recruitment, as space was not a limiting factor. The distribution of life-history generations in this situation was attributed to stochastic events (May’s stochastic hypothesis) and the inability of mature genets to persist for long periods. Our interpretation of the structuring of the population in the southern Gulf of St. Lawrence is that not only are mature plants losing and replacing fronds, but entire plants, including the holdfasts, are also continually lost from the population. This creates a ‘sterile’ space because of the friable nature of the substratum. Fertile plants produce either carpospores (diploid) or tetraspores (haploid), which settle and germinate on this unoccupied space and develop into multi-frond genets, thus perpetuating the cycle. Occurrences of the two generations primarily reflect stochastic events. Thus, predominance of one or the other life-history phase may exist for a finite period in small areas. Nevertheless, the overall population will be characterized by an equivalency of life-history generations.
Physical conditions along the Atlantic coast and Gulf of Maine differ from those of the southern Gulf of St. Lawrence, and are presumed to have a marked effect on populations of C. crispus and distribution of life-history phases. In our mechanistic model for this area, spores of C. crispus develop into mature plants with a continuous loss and replacement of fronds from basal holdfasts. As the substratum is stable, the holdfasts continue development, and intraspecific competition becomes a prime factor. Accordingly, if one life-history generation is more competitive that phase eventually will dominate. Spore production continues from fertile fronds of both generations, so that a minor portion of the population continues to develop from spores where space is available, but the assumption is that space is a limiting factor. The result is a stable population, maintained largely by perennation through the gametophytic basal holdfasts. Sporophytic plants are relatively few as they are less competitive. However, with an overabundance of gametophytes, carpospore production favors establishment of sporophytes in the population for a finite period.
Gametophytes of C. crispus in our area are considered more competitive than sporophytes. Sporophytic fronds are highly susceptible to infection by an endophytic green alga, Acrochaete operculata Correa et Nielsen (Correa and McLachlan 1991, 1992). This endophyte is regarded as a primary pathogen (Correa and McLachlan 1994), and infections result in physiological dysfunctions and physically weaken the fronds, which, in addition, become increasingly attractive to grazing by amphipods and isopods. Equally important, infections by the green endophyte facilitate secondary invasions of the fronds by other endophytes and pathogens (Correa and McLachlan 1992, Correa and Sanchez 1996, Craigie and Correa 1996). Gametophytic fronds are not affected to the same extent by the green endophyte, presumably because of differences in cell wall composition of the two life-history generations. Accordingly, over time, the gametophytic phase is selected and, once dominance is established, continu-ance is ensured through longevity and productivity of established holdfasts. At this point we suggest that primary infections of sporophytic material have been effective in maintaining relatively low frequencies of this life-history generation, even where competition for space is not a major factor.
We do not know to what extent our models can be projected to other species within the Gigartinaceae. As noted, the haploid and diploid generations of these species, also elaborate different cell wall carrageenans. A species of can also be infected by the same green endophyte that attacks C. crispus (Correa and McLachlan 1991, as Iridaea), and Mazzaella laminarioides (Bory) Fredericq in Chile was noted to be adversely affected by another green endophytic species (Correa and Sanchez 1996). Moreover, Luxoro and Santelices (1989) previously reported that sporophytic fronds of this species were more susceptible to grazing than gametophytic ones, which predominated in the population. There may be, therefore, a commonality among species of Gigartinaceae, supporting May’s (1986) mechanistic hypothesis. The situation within the southern Gulf of St. Lawrence is undoubtedly a unique set of circumstances. We know of no other parallel, and equivalency of life-history phases for C. crispus may be an exception.